Guide
The Essential Guide to A/B Testing
Alexandre Suon · 2026-09-25
A/B testing lets real customers, not opinions, decide which version of a page, email or feature works better. This guide explains how a test works, how to size and read one, the ten mistakes that most often mislead teams, and how single tests become a programme that improves the customer experience.
Executive summary
- A/B testing is a randomised controlled experiment. Visitors are randomly split between the current experience (A) and a changed one (B), so any systematic difference in results is caused by the change.
- Most ideas don't win. At Google and Bing only about 10–20% of experiments produce positive results, and across Microsoft about a third of ideas help, a third do nothing and a third do harm. That is precisely why testing beats opinion.
- Size the test before you launch it. At a 3% conversion rate, detecting a 10% relative lift with 95% confidence and 80% power needs about 53,000 visitors per variant.
- Don't stop early. Checking results repeatedly and stopping at the first “significant” reading pushes the false-positive rate from the promised 5% to about 20% with ten looks, and above 30% with fifty.
- The value is in the programme, not the single test. Strong research, clear hypotheses, trustworthy data and a shared memory of what was learned are what turn tests into better customer experiences and revenue.
Section 1 · The basics
What is A/B testing?
A/B testing (also called split testing or bucket testing) is a method of comparing two versions of a web page, app screen, email or feature by showing each to a randomly selected group of users at the same time, then measuring which version performs better against a goal defined in advance.
Version A is the control — the experience customers see today. Version B is the variant (or treatment) — the same experience with one deliberate change. Because users are assigned at random, the two groups are statistically alike in every respect except the change itself. If B's conversion rate is reliably higher, the change caused it.
Explained simply: instead of arguing in a meeting about whether a new checkout button will work, you let a sample of real customers decide — and you use statistics to make sure the verdict isn't a coincidence.
The idea is not new. The statistician Ronald Fisher formalised randomised experiments for agricultural research in the 1920s and 1930s, and medicine adopted them as the gold standard for clinical trials. What changed with the web is cost: an online experiment can reach tens of thousands of people in days, for almost nothing. Google ran its first A/B test in 2000; today large digital companies run thousands of experiments a year.
A/B testing vs split testing vs multivariate testing
“A/B testing” and “split testing” are used interchangeably. Some teams reserve split URL testing for experiments where each version lives at a different URL. Multivariate testing is different: it changes several elements at once and tests every combination to understand how they interact. We compare all the designs in section 4.
Section 2 · How it works
How A/B testing works
Every A/B test, whatever the tool, follows the same mechanics:
- Eligible traffic is defined — for example, all mobile visitors reaching a product page.
- Each visitor is randomly assigned to A or B (usually 50/50) and stays in that group for the duration of the test, so returning visitors see a consistent experience.
- Behaviour is measured for both groups on the metrics you chose before launch.
- A statistical test estimates the difference between the groups and how confident you can be that it is real rather than random noise.
- A decision is made: ship B, keep A, or iterate — and the learning is recorded.
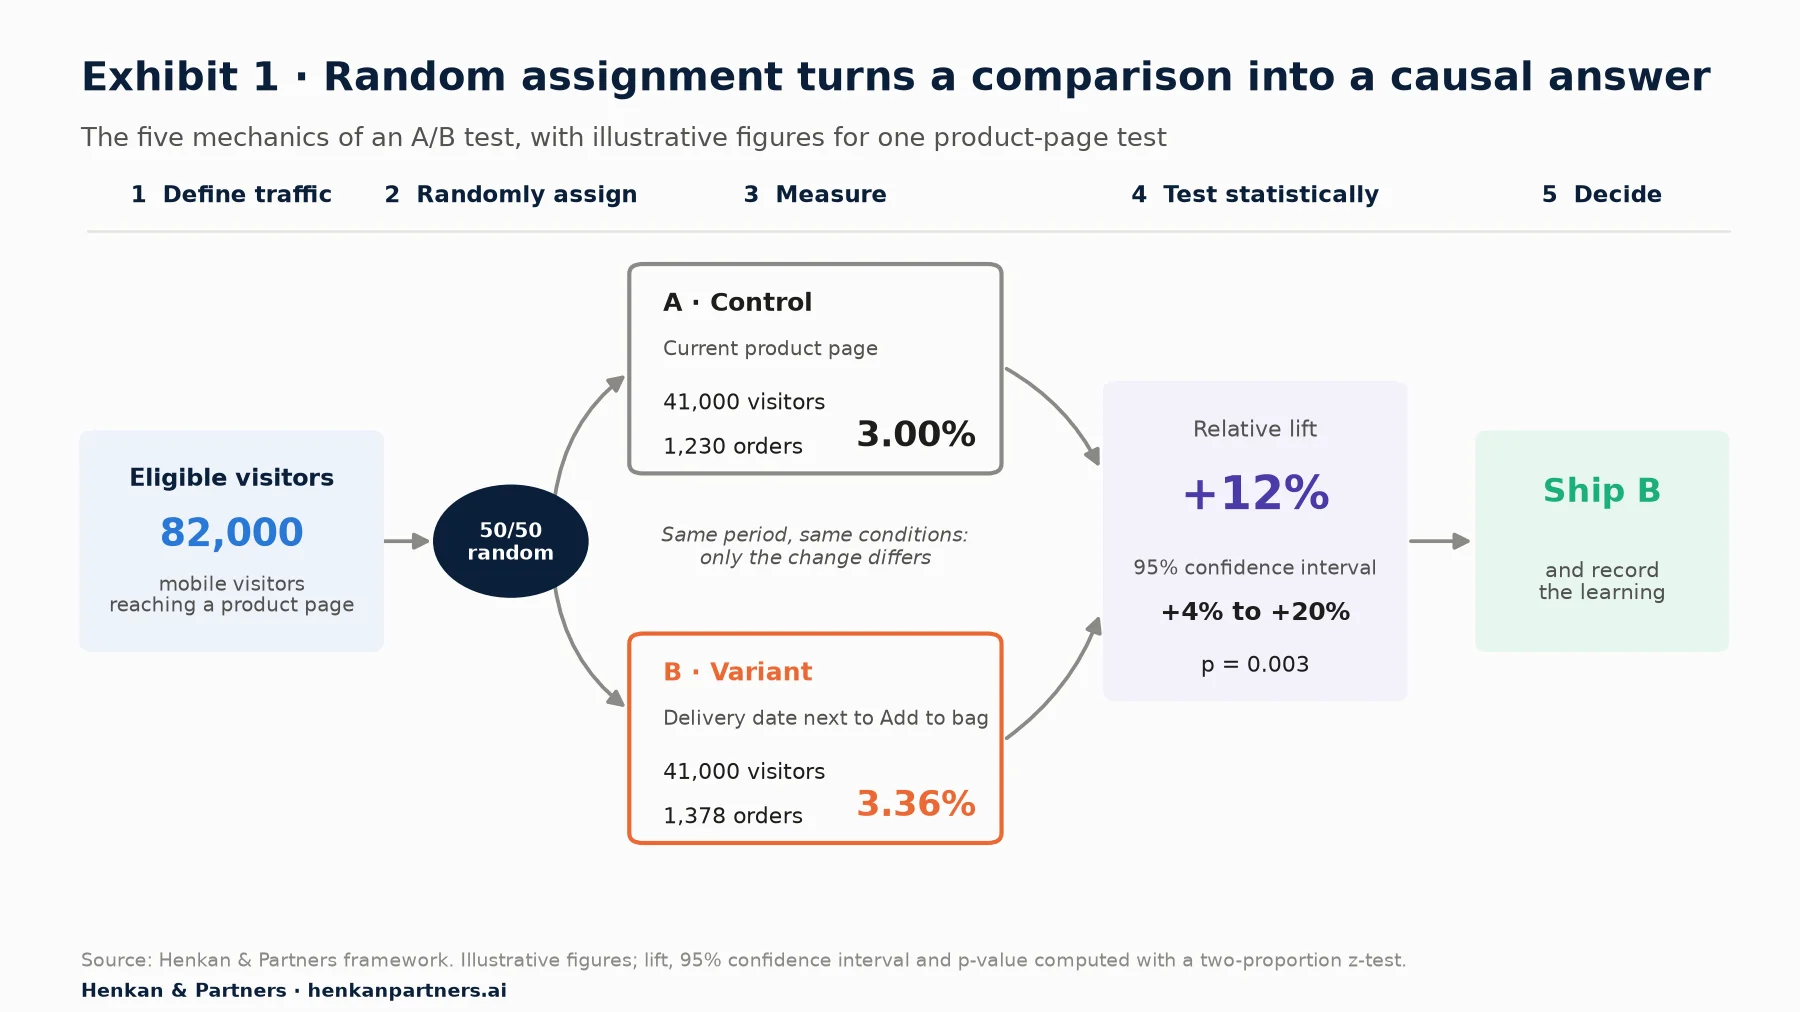
What this shows. The five mechanics in the list above map onto one flow. Random assignment is the step that matters most: because both groups see the site in the same period and conditions, the 0.36-point gap can be attributed to the change. The statistical test then turns that gap into a lift with a range (+4% to +20%) and a p-value (0.003), which is what the decision should rest on.
Randomisation is what makes A/B testing so powerful. A before/after comparison can be distorted by seasonality, a marketing campaign, a competitor's promotion or a change in traffic mix. A properly randomised test exposes both versions to exactly the same conditions over the same period, which isolates the effect of the change.
Client-side vs server-side testing
Client-side tests modify the page in the visitor's browser with JavaScript after it loads. They are quick to set up and suit visual and content changes owned by marketing or CRO teams, but can cause “flicker” if implemented poorly. Server-side tests (including feature-flag experiments) decide which version to render before the page reaches the browser. They are faster, flicker-free and suited to pricing, search algorithms, recommendation logic and app features, but require engineering involvement. Mature programmes use both. See our A/B test coding & QA practice for how we build and quality-check variants.
Section 3 · Why it matters
Why A/B testing matters: most ideas don't win, and nobody can tell which in advance
The case for A/B testing rests on an uncomfortable fact: our intuition about what customers will do is usually wrong. In a widely cited Harvard Business Review article, Ron Kohavi and Stefan Thomke report that at Google and Bing only about 10–20% of experiments generate positive results, and that across Microsoft roughly a third of tested ideas improve the target metric, a third have no effect and a third make things worse.
The same article describes a small change to how Bing displayed ad headlines. The idea sat in the backlog for more than six months because nobody rated it highly. When it was finally tested, it increased revenue by 12% — worth more than $100 million a year in the US alone. Without the test, it would never have shipped; with an opinion-based process, plenty of the losing ideas would have.
That is the real benefit of A/B testing. It improves conversion, yes, but more fundamentally it:
- Replaces opinion with evidence, so decisions stop depending on the most senior voice in the room.
- Reduces the risk of change: a bad idea is caught on a fraction of traffic for a few weeks, not rolled out to everyone indefinitely.
- Measures true impact, including on revenue, average order value and retention — not just clicks.
- Builds customer understanding that compounds: each test teaches you something about what your customers value.
- Improves the customer experience. The end goal is not a higher conversion rate for its own sake; it is an experience good enough that customers buy more, return more often and stay longer. Conversion and lifetime value follow.
Section 4 · Test designs
Types of A/B tests: six designs for different questions and traffic levels
“A/B test” is often used as shorthand for any online controlled experiment. In practice there are several designs, each suited to a different question and traffic level.
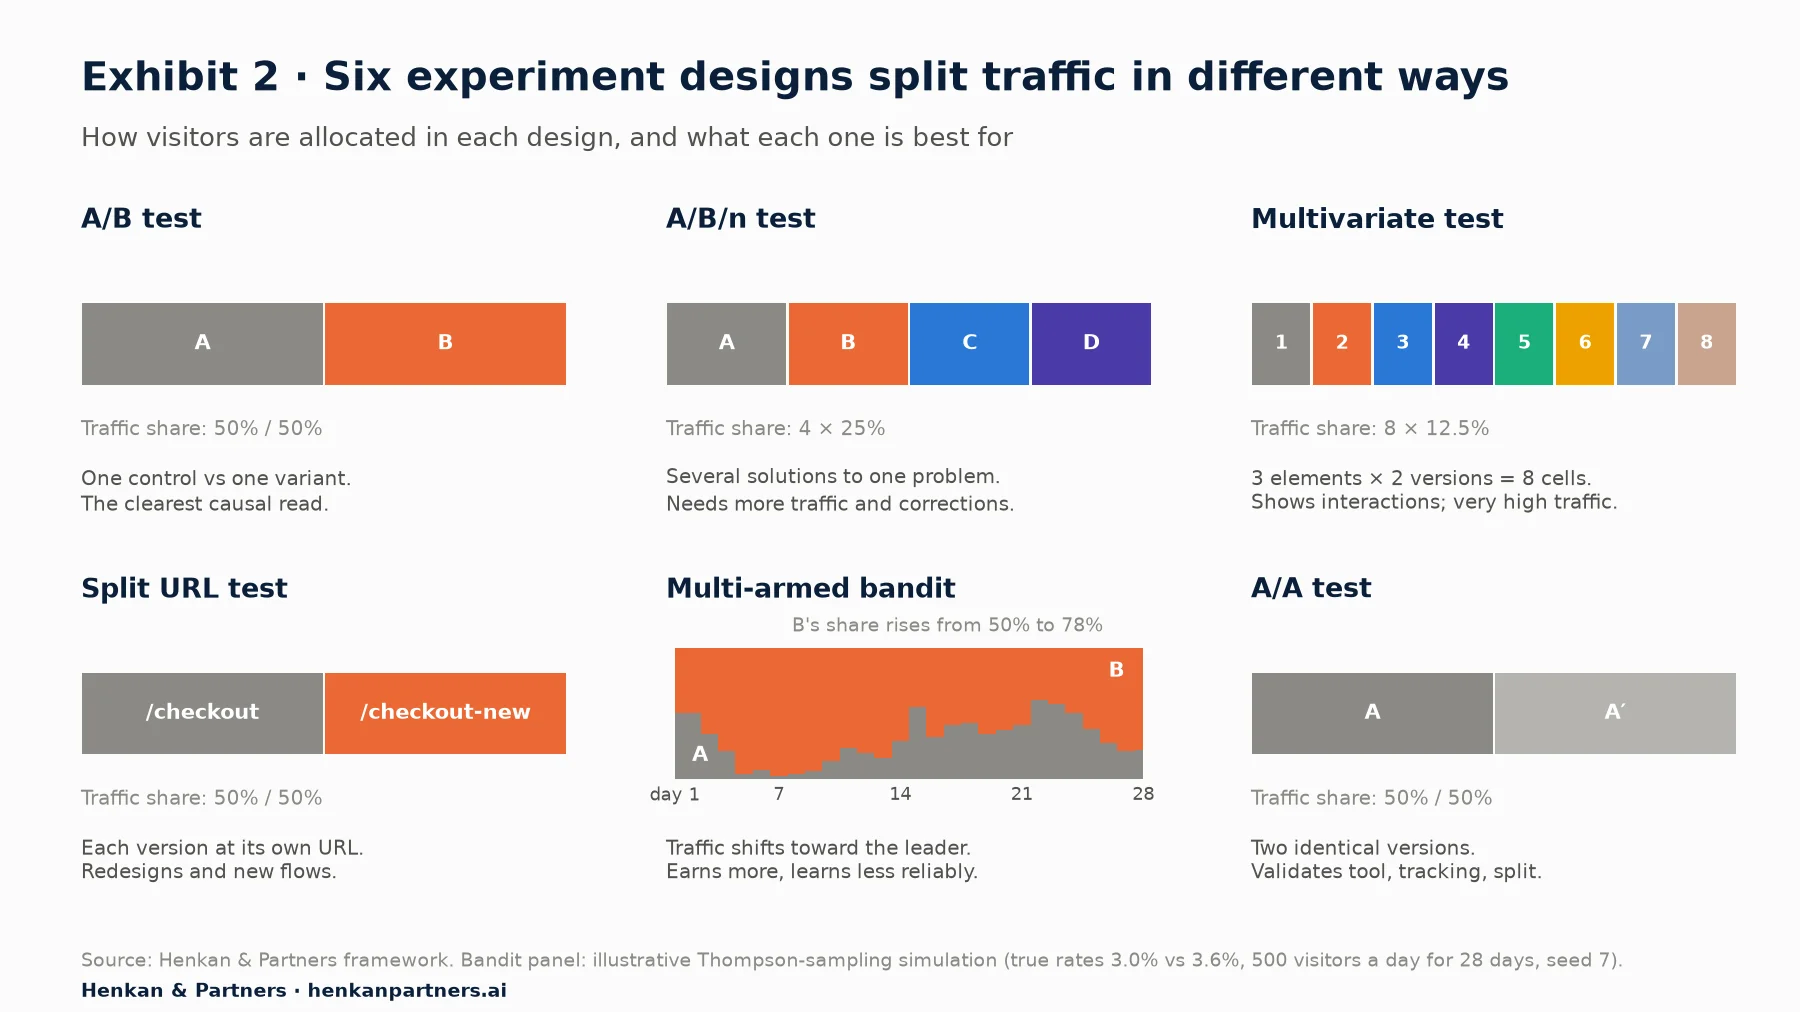
What this shows. Every design except the bandit keeps the split fixed, which is what makes a clean causal read possible. The more ways traffic is divided (four in A/B/n, eight in a three-element multivariate test), the fewer visitors each version gets and the longer the test must run. The bandit shifts traffic toward the leader: it earns more during the test but estimates the effect less reliably.
| Design | What it compares | Best for | Traffic needed |
|---|---|---|---|
| A/B test | One control vs one variant | Most questions; the clearest causal read | Baseline |
| A/B/n test | One control vs two or more variants | Several distinct solutions to the same problem | Higher — traffic is split more ways, and multiple comparisons need correcting |
| Multivariate test (MVT) | Every combination of several changed elements | Understanding how elements interact | Very high — 3 elements × 2 versions = 8 cells |
| Split URL test | Versions hosted at different URLs | Redesigns, new templates, new checkout flows | Baseline |
| Multi-armed bandit | Versions whose traffic share shifts toward the leader | Short-lived campaigns where earning matters more than learning | Lower for decisions, but estimates are less reliable |
| A/A test | Two identical versions | Validating your tool, tracking and randomisation | Baseline |
Two further variations are worth knowing. Multi-page (funnel) tests apply a consistent change across several steps of a journey — for instance, showing delivery costs on product, cart and checkout pages. Personalisation tests target a variant at a specific segment (new visitors, a country, a loyalty tier) and measure it against a held-out control group from that same segment; see our personalisation practice.
Section 5 · What to test
What to test: A/B testing examples
Almost anything a customer sees or experiences can be tested: copy, layout, imagery, navigation, forms, pricing presentation, offers, recommendations, search ranking, emails, push notifications and ads. The question is not what can be tested but what is worth testing — which comes from research, not a list of ideas.
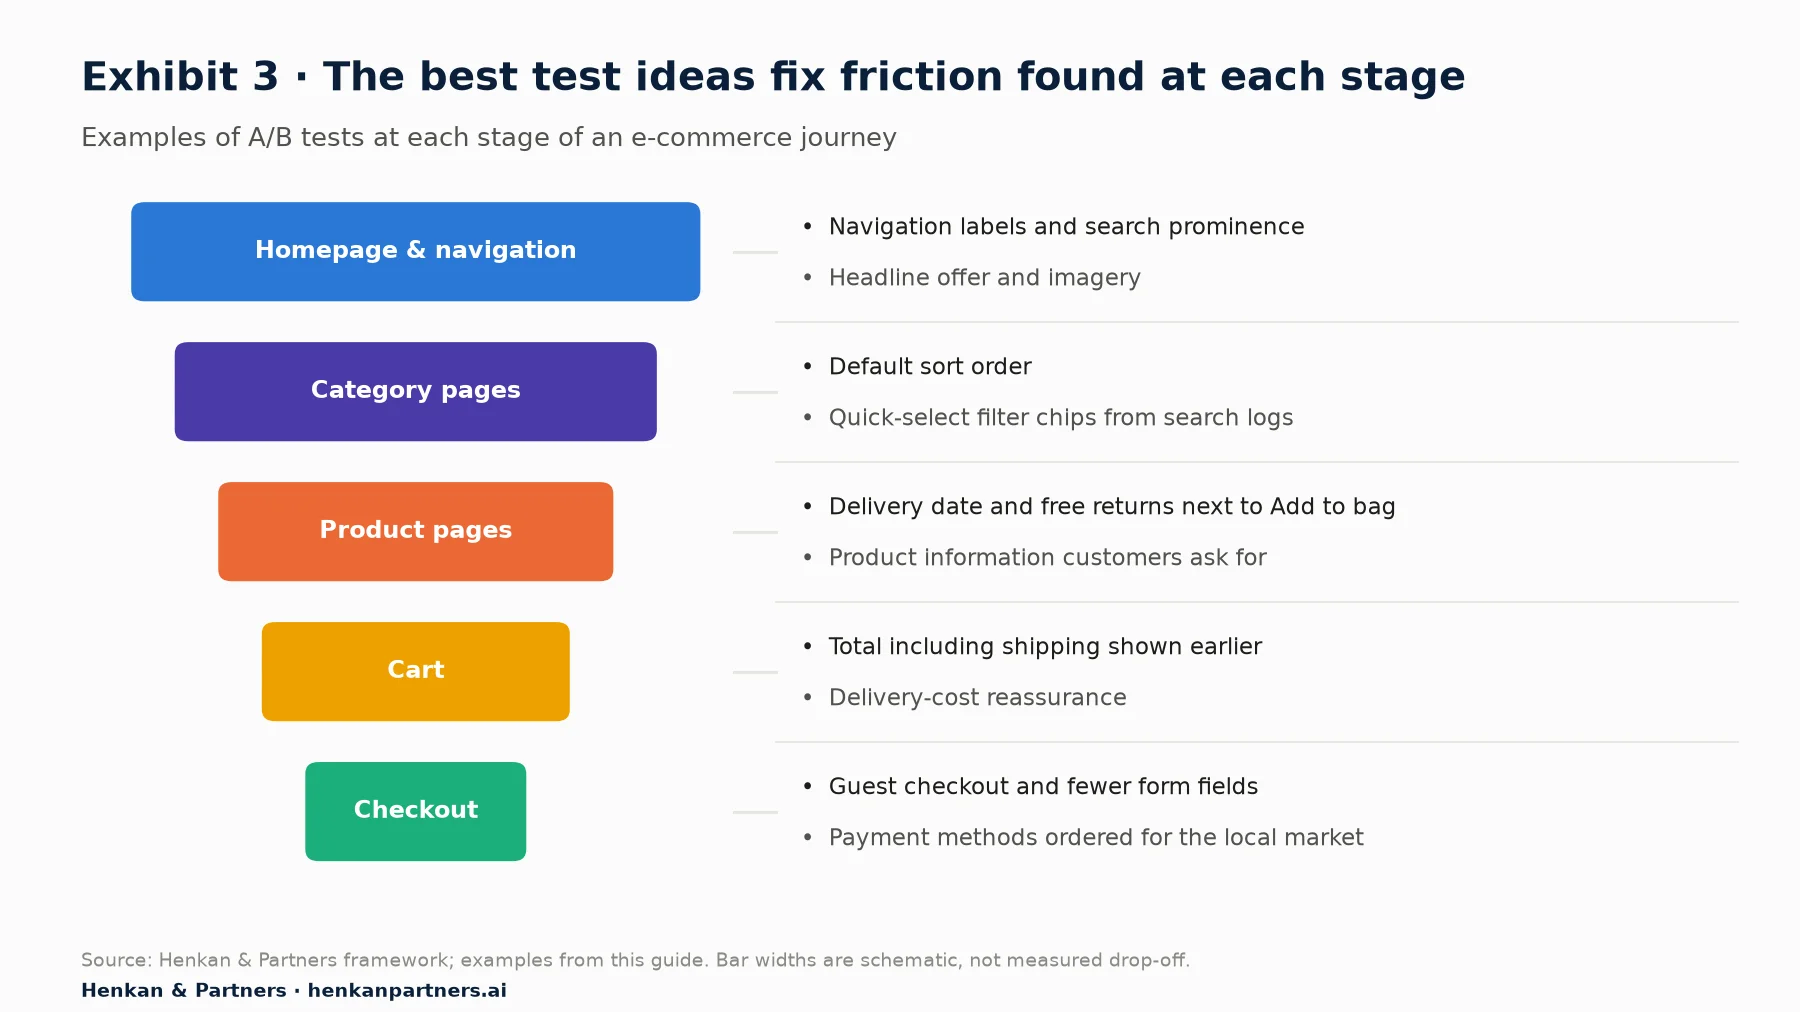
What this shows. Each stage has its own typical sources of friction, from finding the right product to trusting the delivery and payment terms. The examples are starting points, not a to-do list: test where your own research shows most customers or revenue are lost.
E-commerce examples
- Product pages: showing delivery dates and free-returns information next to the “Add to bag” button rather than in a tab further down.
- Category pages: changing the default sort order, or adding the filters customers use most in search logs as quick-select chips.
- Cart: displaying the total including shipping earlier to avoid a late surprise at checkout.
- Checkout: offering guest checkout, reducing form fields, or reordering payment methods to match the local market.
SaaS and lead-generation examples
- Pricing page: annual vs monthly billing as the default; highlighting a recommended plan.
- Sign-up: single-step vs multi-step forms; social sign-in; removing the credit-card requirement for a trial.
- Onboarding: a guided checklist vs a blank workspace — measured on activation and retention, not just completion.
Travel, hospitality and financial services examples
- Search results: presenting total price vs nightly price; flexible-date calendars.
- Booking flows: the order and default state of add-ons such as insurance or breakfast.
- Applications: progress indicators and save-and-resume in long forms such as loan or insurance quotes.
A note on button colours. The classic “red vs green button” test makes a good teaching example and a poor strategy. Cosmetic changes rarely move revenue measurably. The biggest wins come from tests that remove a real source of friction or doubt revealed by research — unclear delivery costs, a confusing form field, missing product information.
Section 6 · The process
How to run an A/B test in 8 steps
A reliable A/B testing process has eight steps. Skipping the first three is the most common reason programmes stall at a low win rate.
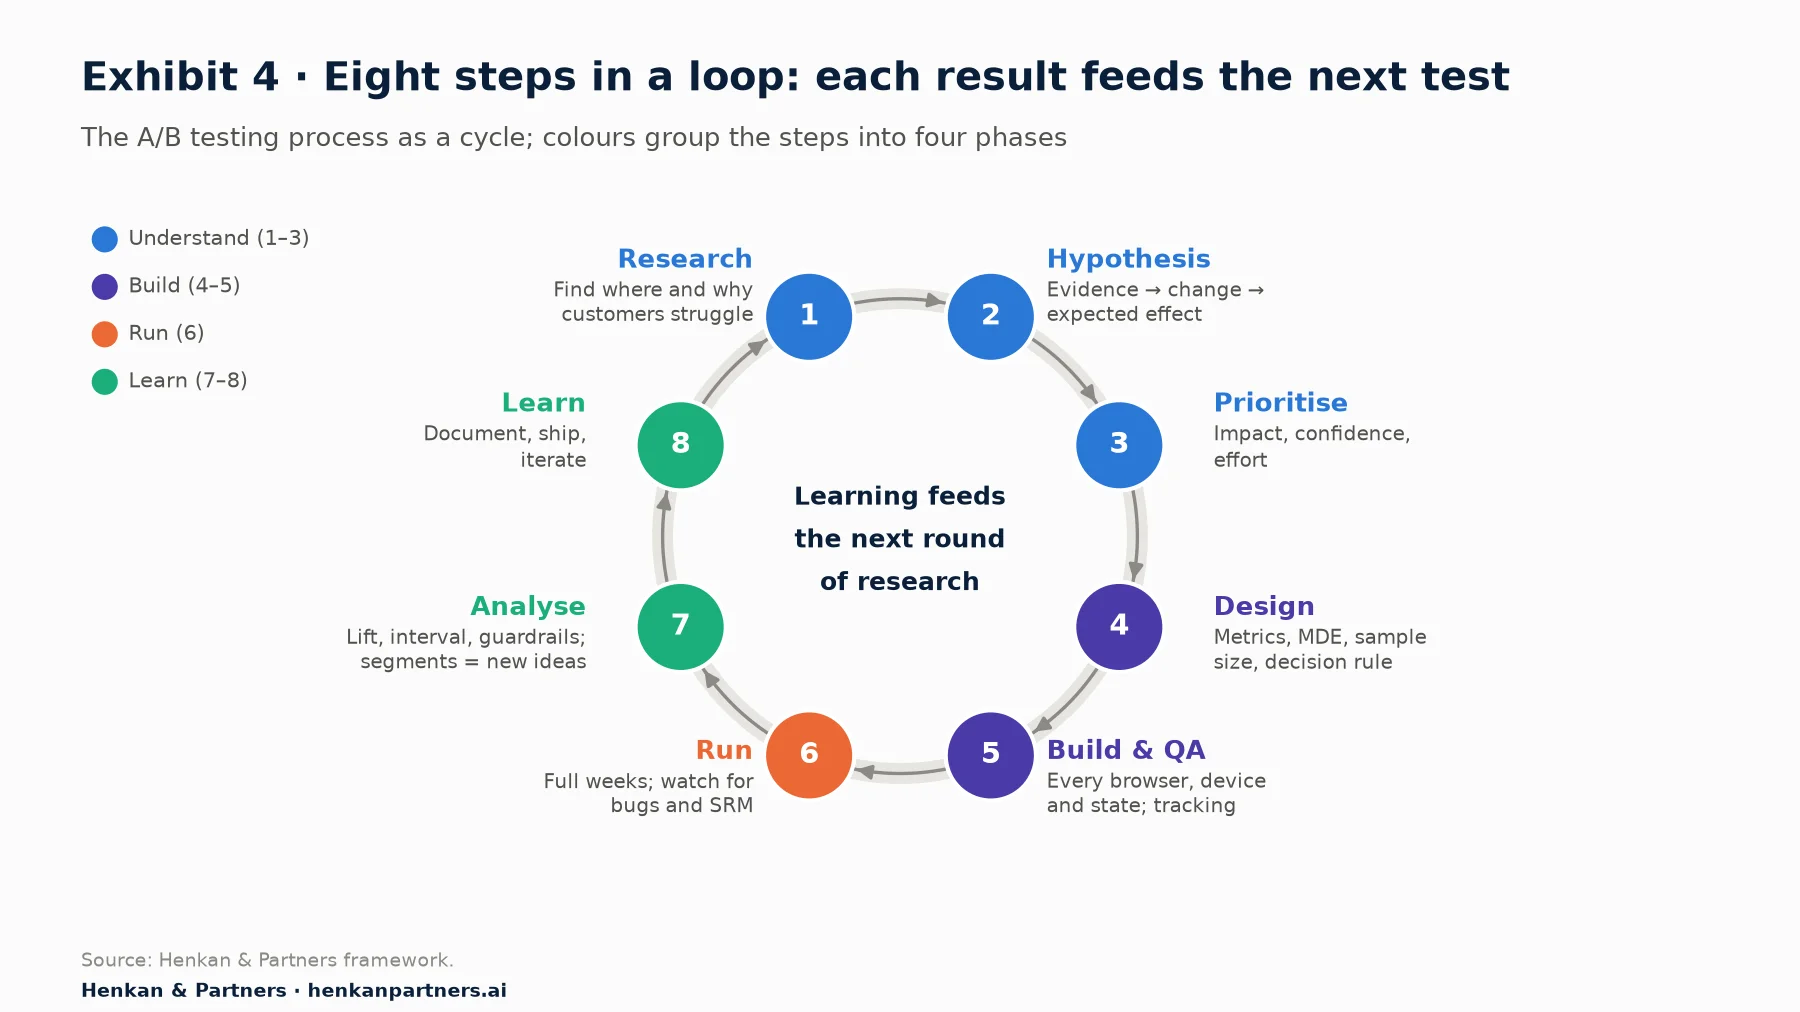
What this shows. Three of the eight steps happen before anything is built, and two happen after the test ends. Skipping the first three produces weak ideas; skipping the last two means the next test starts from scratch. Each result, winning or losing, feeds the next round of research.
Step 1 — Research: find where and why customers struggle
Start from evidence. Product analytics shows where customers drop off; session replay and heatmaps show how they behave; voice-of-customer research — surveys, interviews, reviews, support tickets — tells you why. Look for problems that are both significant (they affect many customers or a lot of revenue) and specific (you can see what goes wrong).
Step 2 — Hypothesis: state what you expect and why
A good hypothesis links an observation to a change and a measurable outcome:
Because we observed [evidence],
we believe that [change] for [audience]
will cause [effect on customer behaviour],
which we will measure with [primary metric].
For example (hypothetical): Because 38% of exit-survey respondents on product pages cited uncertainty about delivery times, we believe that showing an estimated delivery date next to the Add to bag button for all visitors will increase confidence to buy, which we will measure with order conversion rate. A hypothesis written this way tells you what to learn whether the test wins or loses.
Step 3 — Prioritise: test what matters most first
You will always have more ideas than traffic. Score each on expected impact, confidence (how strong the supporting evidence is) and effort, using a framework such as ICE or PIE. Weight confidence heavily: ideas backed by several independent sources of evidence win more often.
Step 4 — Design the experiment
Before building anything, write down:
- the primary metric, plus secondary and guardrail metrics (section 8);
- the audience and the pages or triggers where the test runs;
- the minimum detectable effect (MDE) — the smallest lift worth detecting;
- the sample size and duration that follow from it (section 7);
- the decision rule: what result leads you to ship, stop or iterate.
Writing this down before launch — pre-registration — is the single best protection against fooling yourself later.
Step 5 — Build and QA
Develop the variant and test it on every major browser, device and screen size, in every state (logged in and out, empty cart, error messages). Check that tracking fires identically in both versions. Many “losing” tests are actually broken tests.
Step 6 — Run and monitor
Launch to the planned audience and run in full weeks so every day of the week is represented. Monitor for bugs and for sample ratio mismatch (a split that deviates from the one you configured), but do not use interim results to decide the outcome unless your statistical method is designed for it.
Step 7 — Analyse
At the planned end date, read the primary metric first: the estimated lift, its confidence interval and its significance. Then use secondary metrics to understand why, and check guardrails. Treat segment findings (mobile vs desktop, new vs returning) as new hypotheses to test, not conclusions — slicing results many ways will always produce some false “wins”.
Step 8 — Learn, document and iterate
Ship winners, but above all record the learning: the hypothesis, the evidence, screenshots, results and what you now believe about your customers. Inconclusive and losing tests are as informative as winners. A searchable archive of past tests prevents teams from re-running old ideas and lets new hypotheses build on everything already learned.
Section 7 · Statistics
A/B testing statistics, explained
You do not need a statistics degree to run good A/B tests, but you do need to understand five ideas. Get these right and you avoid most of the ways tests mislead.
Statistical significance and the p-value
Even if B has no real effect, the two groups will never convert at exactly the same rate — random variation guarantees some difference. Statistical significance asks: if the change truly did nothing, how likely would a difference at least this large be? That probability is the p-value. By convention a result is called significant when p < 0.05, i.e. at a 95% confidence level.
What this means in practice: when there is no real effect, you will still declare a “winner” about 5% of the time. That is the false-positive rate you agree to accept. Note what significance does not tell you: that the effect is large, that it is commercially meaningful, or that there is a 95% chance B is better.
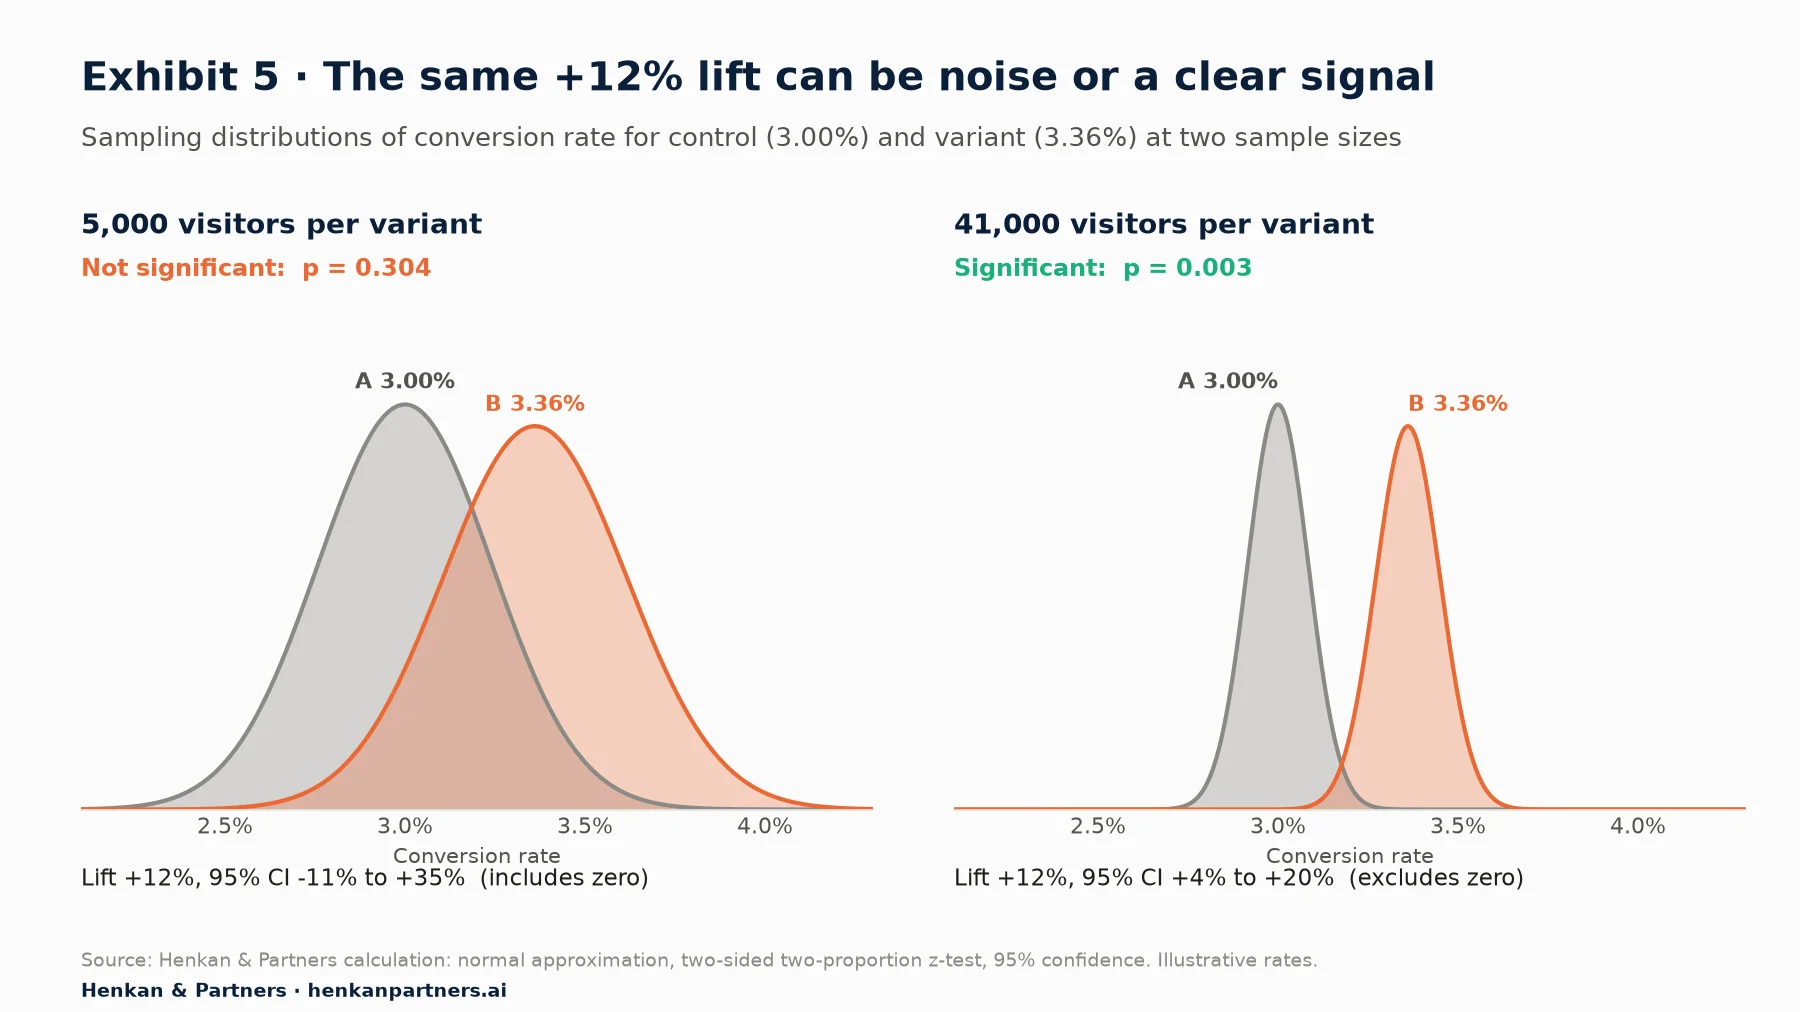
What this shows. Significance is about overlap, not about the size of the gap. The observed lift is identical in both panels. With 5,000 visitors per variant, the uncertainty around each rate is wide, the curves overlap heavily and the interval (−11% to +35%) includes zero, so the result could easily be noise. With 41,000 visitors per variant, the curves separate and the interval (+4% to +20%) excludes zero.
Confidence intervals: report a range, not a point
A confidence interval gives the range of lifts consistent with the data. “+12%, 95% CI +4% to +20%” is far more useful than “+12%, significant”: it says the true effect is probably positive and could be modest or large. An interval of −3% to +9% tells you the test could not distinguish a small loss from a solid gain.
Statistical power and the minimum detectable effect
Power is the probability that your test detects a real effect of a given size. The standard target is 80%. The minimum detectable effect (MDE) is the smallest true lift your test is designed to detect at that power. Choose the MDE from a business perspective — what lift would justify the change? — and then work out the traffic you need. An underpowered test is not neutral: it will usually come back inconclusive, and when it does show a “winner”, the estimated effect is likely to be exaggerated.
Sample size: how many visitors do you need?
Sample size depends on three things: your baseline conversion rate, the MDE, and the significance and power levels. A convenient approximation for 95% significance and 80% power is:
n per variant ≈ 16 × p × (1 − p) ÷ δ²
where p = baseline conversion rate and δ = absolute difference to detect
Worked example. Your product page converts at 3% and you want to detect a 10% relative lift (3.0% → 3.3%, so δ = 0.003). The approximation gives 16 × 0.03 × 0.97 ÷ 0.003² ≈ 51,700 visitors per variant; the exact two-proportion calculation gives about 53,200. With two variants, that is roughly 106,000 visitors. If 10,000 eligible visitors reach the page each day, the test needs about 11 days — so you would plan for two full weeks.
| Baseline conversion rate | MDE +5% | MDE +10% | MDE +15% | MDE +20% |
|---|---|---|---|---|
| 1% | 637,000 | 163,100 | 74,200 | 42,700 |
| 3% | 207,900 | 53,200 | 24,200 | 13,900 |
| 5% | 122,100 | 31,200 | 14,200 | 8,200 |
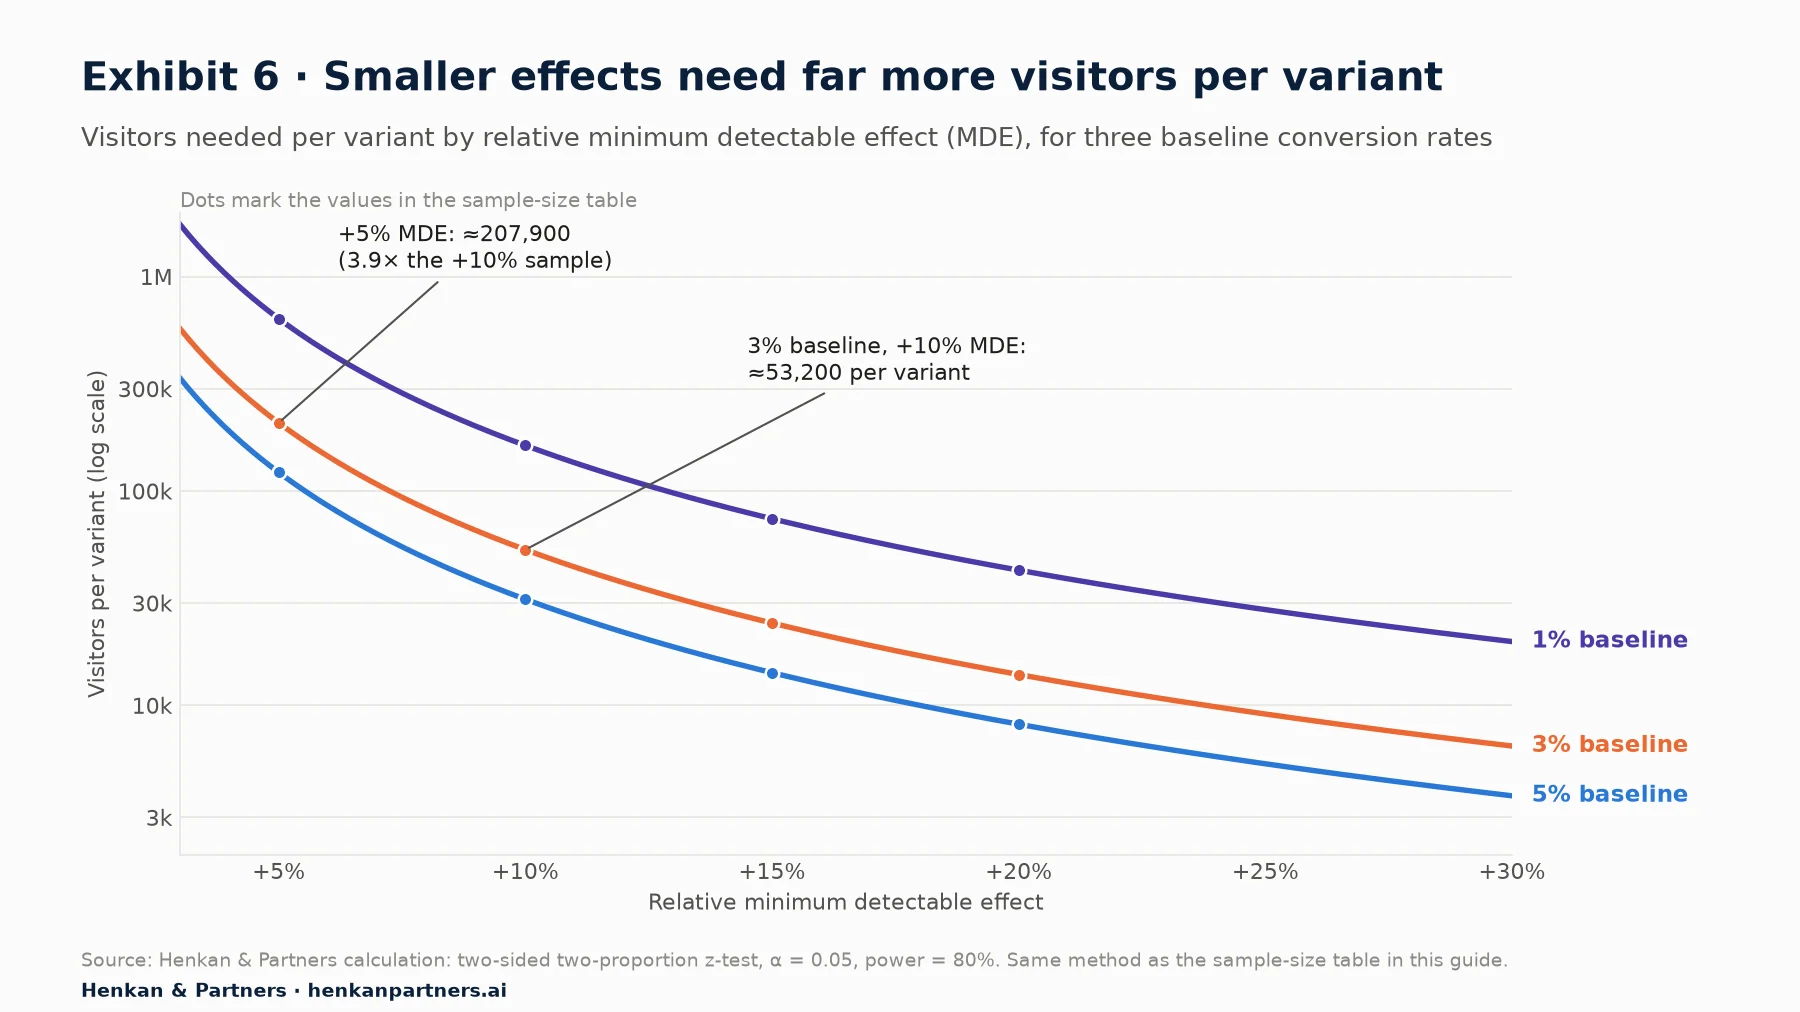
What this shows. Sample size falls steeply as the effect you want to detect grows. At a 3% baseline, halving the MDE from +10% to +5% raises the requirement from about 53,200 to about 207,900 visitors per variant, 3.9 times more. If the numbers are out of reach, test a bolder change rather than run an underpowered test.
How long should an A/B test run?
- Until the planned sample size is reached — calculated before launch.
- In full weeks, at least one and ideally two business cycles, so weekday and weekend behaviour are both represented.
- Usually two to four weeks. Much longer and cookie deletion, returning visitors and external events start to contaminate the result.
- Avoid unusual periods such as Black Friday or sales launches unless that is precisely what you are testing.
Frequentist, Bayesian and sequential testing
Most tools use one of three statistical approaches. Frequentist (fixed-horizon) tests — the p-values and confidence intervals above — are valid only when you analyse once, at the planned sample size. Bayesian methods report the probability that B beats A, which many stakeholders find more intuitive, but they are not a licence to stop whenever the number looks good. Sequential testing is designed for continuous monitoring: it adjusts the thresholds so you can look at results as often as you like and stop early for a clear win or loss without inflating errors. Whichever method your tool uses, learn what its stopping rules assume.
Variance reduction: getting answers faster
Techniques such as CUPED, developed at Microsoft, use each visitor's pre-experiment behaviour to remove noise from the comparison. On metrics that correlate strongly with past behaviour — revenue, sessions — they can cut the required sample size substantially, which translates directly into faster tests. Several modern platforms now offer it as a setting.
Section 8 · Metrics
Choosing the right metrics: one decides the test, the others explain it and protect the business
A test is only as good as what it measures. Every experiment needs three tiers of metrics, set before launch.
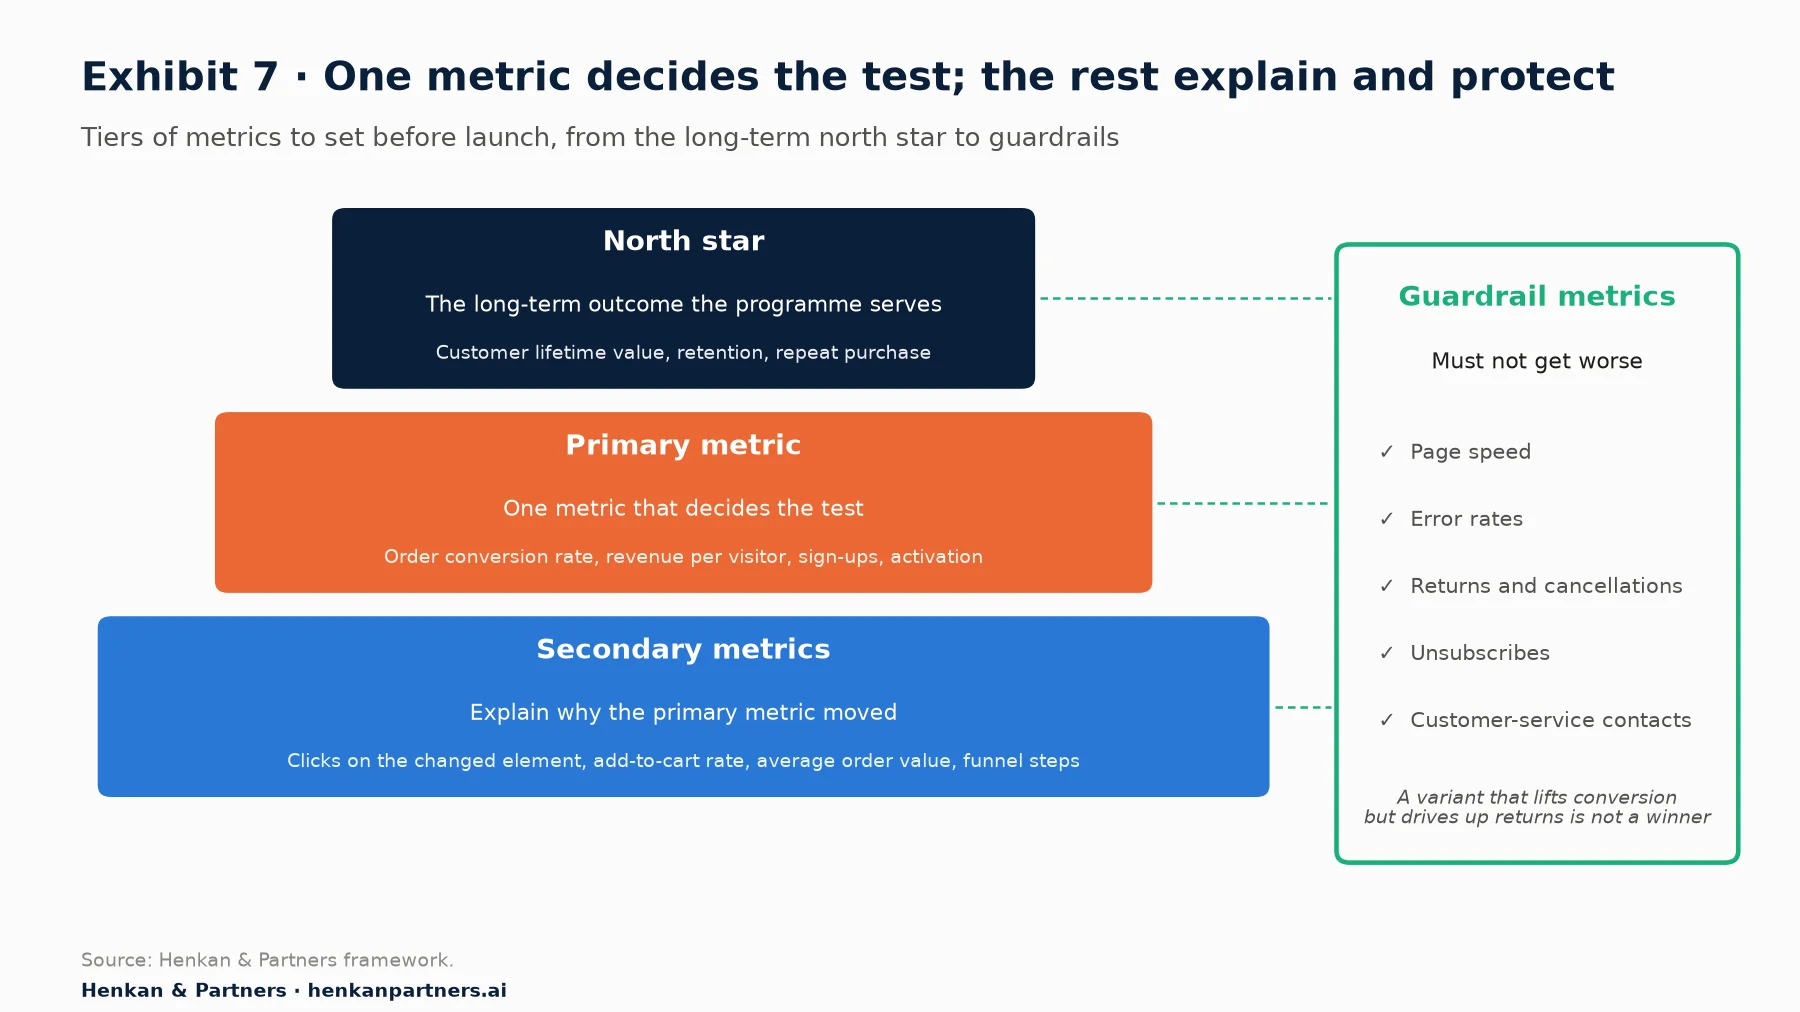
What this shows. Each tier has one job. The north star (customer lifetime value, retention) is what the programme ultimately serves but is rarely measurable within a two-to-four-week test. The primary metric decides the test and should be the closest measurable proxy for it. Secondary metrics explain why it moved. Guardrails apply to every tier: a win on the primary metric does not count if it damages speed, returns or customer service.
- Primary metric. One metric that decides the test, as close as possible to business value: order conversion rate, revenue per visitor, sign-ups, activation. Revenue per visitor captures both conversion and basket size but is noisier, so it needs more traffic.
- Secondary metrics. Metrics that explain the result: clicks on the changed element, add-to-cart rate, average order value, progression through each funnel step.
- Guardrail metrics. Things that must not get worse — page speed, error rates, returns, cancellations, unsubscribes, customer-service contacts. A variant that lifts conversion but drives up returns is not a winner.
Be wary of vanity metrics. A variant can increase clicks on a banner while reducing purchases. Where possible, look beyond the session to what the change does for retention and customer lifetime value.
Section 9 · Mistakes
10 common A/B testing mistakes
Most bad decisions from A/B testing come not from the tools but from a small set of avoidable errors.
1. Peeking and stopping early
Checking a fixed-horizon test every day and stopping the moment it reaches significance is the most damaging mistake in A/B testing. Every look is another chance for random noise to cross the threshold. Our simulation of 10,000 A/A tests per scenario, where there is no real difference, shows the false-positive rate climbing from the promised 5% to about 20% with ten looks and above 30% with fifty (Exhibit 8).
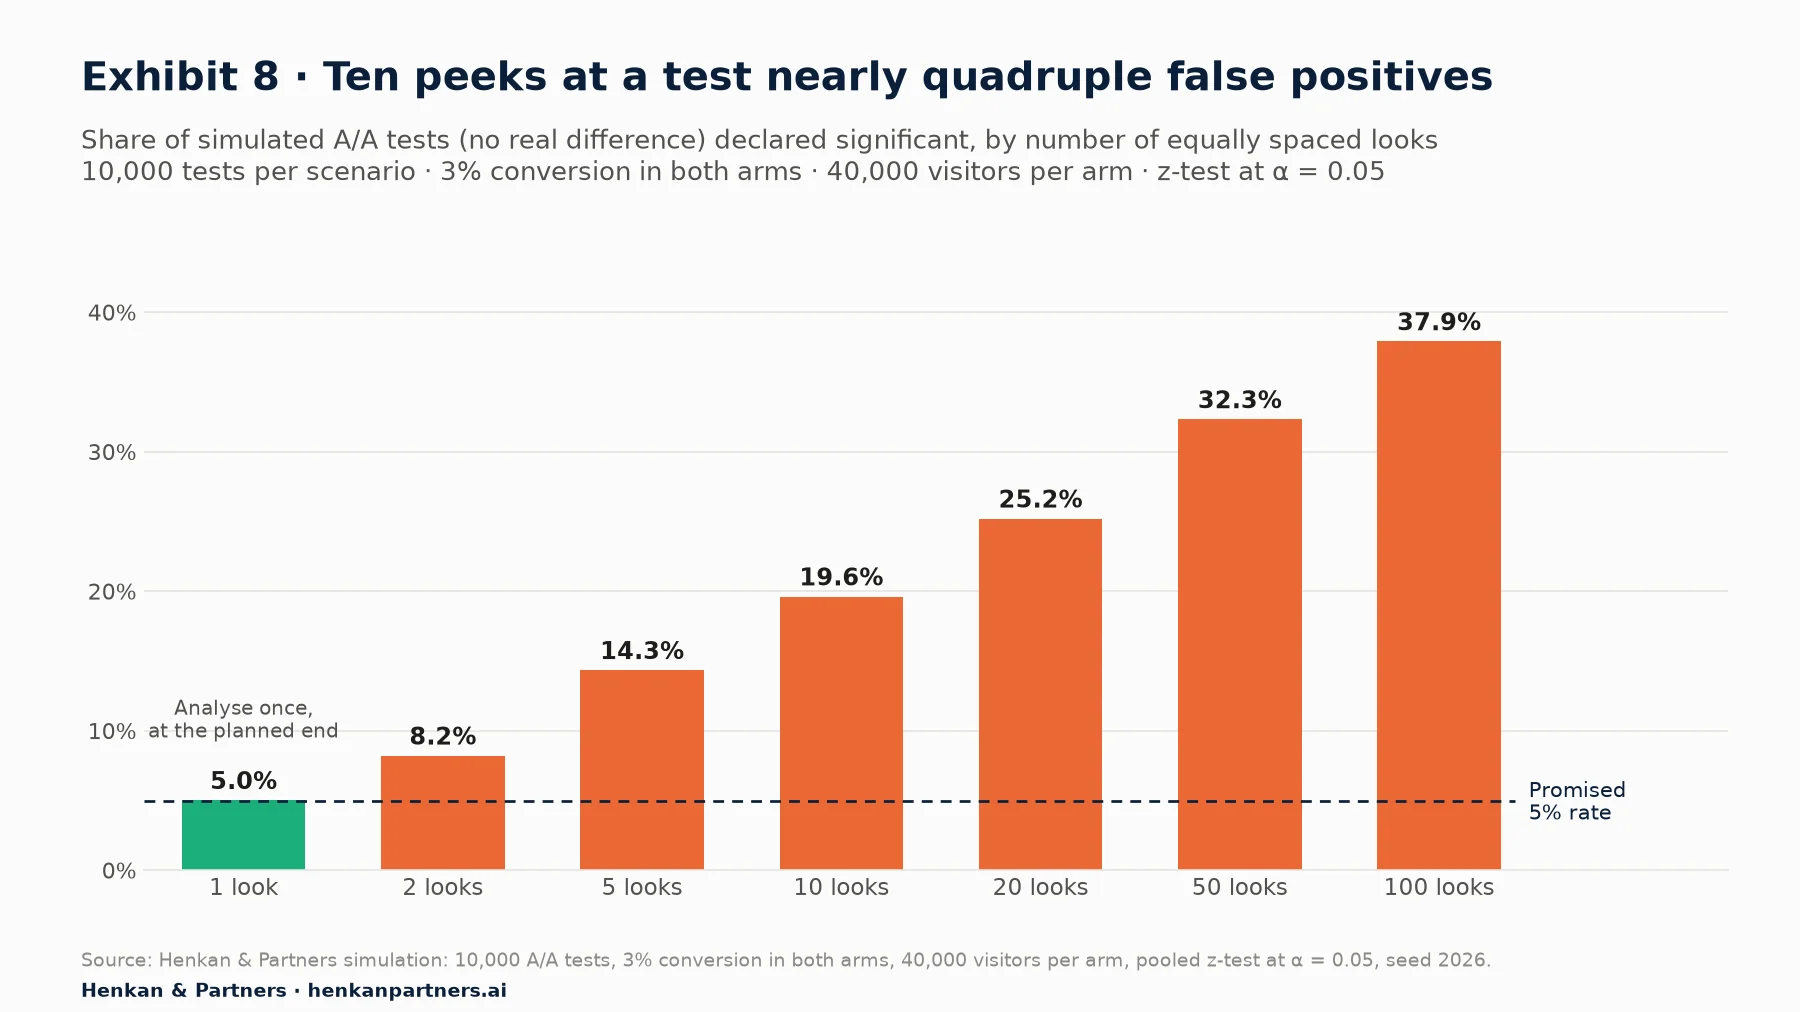
What this shows. Analysed once at the planned end, the test keeps its promise: 5.0% false positives. Every extra look is another chance for noise to cross the threshold, so the error rate climbs to 19.6% with ten looks (roughly daily checks on a two-week test) and 32.3% with fifty. The results match the classic analysis of repeated significance testing by Armitage and colleagues (1969).
Fix: commit to the sample size up front, or use a sequential method built for continuous monitoring.
2. Running underpowered tests
Launching without a sample-size calculation usually means the test cannot detect any realistic effect. Fix: calculate first; if traffic is too low, test a bolder change, a higher-traffic template or a closer metric.
3. Ignoring sample ratio mismatch (SRM)
If you configured a 50/50 split and see 50,000 visitors in A but 48,800 in B, something is wrong — a redirect, a bot filter, a tracking bug. A chi-square test puts the chance of that split happening randomly at about 1 in 7,400. Fix: check SRM automatically on every test and do not trust results that fail it.
4. Changing the test mid-flight
Editing the variant, changing the traffic allocation or adding pages after launch mixes different experiments together. Fix: stop and restart as a new test.
5. Fishing across metrics and segments
With twenty metrics and ten segments, something will look significant by chance. Fix: one pre-registered primary metric; treat segment findings as hypotheses for follow-up tests.
6. Testing without a research-based hypothesis
Random ideas produce random results and no learning. Fix: every test traces back to evidence from analytics, user research or previous tests.
7. Poor QA and flicker
A variant that breaks on one browser, or briefly shows the original before switching, will lose for reasons unrelated to the idea. Fix: systematic cross-device QA and a flicker-free implementation.
8. Ignoring novelty and seasonality
Returning users may click on something simply because it is new; a promotion can change who is visiting. Fix: run full weeks, avoid atypical periods, and check whether the effect fades over the test.
9. Declaring “no difference” too soon
An inconclusive result means the test could not detect an effect of the planned size — not that the effect is zero. Fix: read the confidence interval to see which effects you can rule out.
10. Not documenting what you learned
Without a record, teams forget, re-test old ideas and cannot build on past results. Fix: a shared, searchable repository of every test, winner or not.
Section 10 · SEO
A/B testing and SEO: following Google's guidance keeps rankings safe
A frequent concern is whether A/B testing harms search rankings. Following Google's published guidance, it does not:
- No cloaking. Never show search engine crawlers different content from what users see, and don't treat Googlebot as a special segment.
- Use `rel="canonical"` on split-URL variants, pointing to the original URL.
- Use 302 (temporary) redirects, not 301s, when redirecting visitors to a variant URL.
- Run tests only as long as necessary, then ship the winner and remove the test code.
SEO tests themselves — changing titles or content on groups of pages and measuring organic traffic — follow a different design, because you split pages rather than users. That is a topic of its own.
Section 11 · Tools
A/B testing tools: choose by who runs the tests and where they run
The right platform depends on who runs your tests, where they run and how much statistical control you need. The market falls into three broad families:
| Family | Examples | Suited to |
|---|---|---|
| Web experimentation & personalisation suites | AB Tasty, Kameleoon, Optimizely, VWO, Dynamic Yield | Marketing, e-commerce and CRO teams; visual editors plus code; client- and server-side |
| Feature-flag & product experimentation platforms | LaunchDarkly, Statsig (Amplitude since 2026), GrowthBook, Datadog Experiments (formerly Eppo), Harness FME (formerly Split) | Product and engineering teams testing features server-side, often on warehouse data |
| Analytics & behavioural insight | GA4, Adobe Analytics, Amplitude, Mixpanel, Contentsquare, Microsoft Clarity | Research before tests and deeper analysis after them |
When choosing, weigh: client-side vs server-side support and flicker handling; statistical engine (fixed-horizon, Bayesian, sequential, CUPED); integration with your analytics and data warehouse; data privacy and hosting (particularly for European companies); governance features for many teams; and total cost relative to your traffic.
Disclosure: Henkan & Partners is a partner of AB Tasty, Kameleoon and Contentsquare, and works across all the platforms listed.
Section 12 · Programme
From individual tests to an experimentation programme
One test can fix one problem. A programme changes how an organisation decides. The companies that get the most from A/B testing share a few traits:
- Research-led roadmaps. Hypotheses come from analytics, customer research and past results rather than the loudest opinion.
- Trustworthy data. Clean tracking, automated SRM checks and A/A tests, so nobody has to argue about whether the numbers are right.
- Velocity with quality. Enough tests to learn quickly, each one properly powered and QA'd.
- The right measures of success. Not just win rate, but learning rate, cumulative impact and the share of decisions informed by evidence.
- Institutional memory. Every result captured and searchable, so knowledge survives team changes and compounds over time.
- Culture. Leaders who accept that most ideas fail, celebrate learning from losing tests, and let data overrule seniority.
This holds whatever your size. A two-person team can run a handful of well-chosen tests a quarter; a large retailer may run hundreds with an embedded experimentation team. What matters is that each test is designed to produce a decision you can trust. Not sure where you stand? Talk to us for a candid review of your programme.
Section 13 · AI
A/B testing in the age of AI: cheaper ideas make validation more valuable
Is A/B testing dead? Quite the opposite. AI is changing how experimentation is done, not whether it is needed:
- Research at scale. AI can analyse thousands of reviews, survey answers and session recordings to surface friction points in hours rather than weeks.
- Faster hypotheses and variants. Generating copy, layouts and even variant code takes minutes, which raises the number of ideas worth considering.
- Pre-testing with synthetic users. AI personas grounded in real behavioural and survey data can help screen and refine ideas before they reach live traffic. They generate hypotheses; they do not replace the experiment.
- Conversational analysis. Assistants connected to analytics and testing tools let teams query results in plain language instead of waiting for a dashboard.
As producing ideas gets cheaper, the bottleneck moves to validating them. When anyone can generate a hundred variants, a rigorous, randomised way of finding out which ones actually help customers becomes more valuable, not less. Explore our AI & automation work to see how we apply this in practice.
FAQ
Frequently asked questions about A/B testing
Frequently asked questions
What is A/B testing in simple terms?
A/B testing shows two versions of the same page, email or feature to two randomly chosen groups of people at the same time, then measures which version performs better on a metric decided in advance. Because the groups are random, the difference in results can be attributed to the change rather than to luck or seasonality.
What is the difference between A/B testing and split testing?
In everyday use they mean the same thing: splitting traffic between versions to compare performance. Some teams reserve “split URL testing” for tests where each version lives on a different URL, typically for full-page redesigns.
How long should an A/B test run?
Long enough to reach the sample size calculated before launch, and always in full weeks so every weekday is represented. In practice most tests run for two to four weeks. Stop at the planned end date, not when the dashboard first shows a significant result.
How much traffic do you need for A/B testing?
It depends on your baseline conversion rate and the smallest lift you want to detect. At a 3% conversion rate, detecting a 10% relative lift with 95% confidence and 80% power needs about 53,000 visitors per variant. Lower-traffic sites should test bolder changes, use higher-frequency metrics such as add-to-cart, or combine testing with qualitative research.
What does statistical significance mean in an A/B test?
A result is statistically significant when a difference as large as the one observed would be unlikely if the change had no real effect. At the usual 95% confidence level (p < 0.05), you accept a 5% chance of declaring a winner when there is no true difference. Significance says nothing about whether the effect is large enough to matter commercially.
Does A/B testing really work?
Yes, when it is run with sound method. Randomised controlled experiments are the most reliable way to establish cause and effect in digital products. Companies such as Microsoft, Google, Booking.com and Netflix run thousands of them to guide product decisions. Most individual ideas do not win, which is exactly why testing them is valuable.
Is A/B testing dead?
No. What is fading is low-value testing of cosmetic tweaks. AI makes it faster to research, generate hypotheses, build variants and analyse results, and more changes reach customers than ever, so a reliable way to prove what works is more important, not less.
What is the difference between A/B testing and multivariate testing?
An A/B test compares complete versions of an experience. A multivariate test changes several elements at once and tests every combination, which shows how elements interact but splits traffic across many more cells, so it needs far more visitors.
Does A/B testing hurt SEO?
Not if you follow Google's guidance: do not show crawlers different content from users (cloaking), use rel=canonical on split-URL variants pointing to the original, use temporary 302 redirects rather than 301s, and end tests once you have a result.
Can you A/B test with low traffic?
Yes, with adjustments: test bigger changes that could plausibly move the metric by 15–30%, test on high-traffic templates rather than single pages, choose metrics closer to the change, accept longer run times, and use qualitative research and user testing to de-risk decisions that traffic cannot validate.
Key terms
- Control
- The existing version (A) that variants are compared against. Without a control running at the same time, you cannot separate the effect of your change from seasonality or campaigns.
- Variant (treatment)
- A changed version (B, C…) being tested. Changing one idea per variant keeps the result interpretable.
- Conversion rate
- The share of visitors who complete the target action. It is the most common primary metric, and its baseline level drives how much traffic a test needs.
- Lift (uplift)
- The relative difference between variant and control, e.g. 3.0% → 3.3% is a +10% lift. Always read it with its confidence interval, not on its own.
- p-value
- The probability of seeing a difference at least this large if the change had no real effect. Below 0.05 is the usual bar; it is not the probability that B is better.
- Confidence level
- 1 minus the accepted false-positive rate; 95% is standard. It fixes how often you will declare a winner when there is none.
- Confidence interval
- The range of effect sizes consistent with the data. It tells you how large or small the true effect could plausibly be, which a single number hides.
- Statistical power
- The probability of detecting a real effect of a given size; 80% is standard. Low power means most tests come back inconclusive and the wins you see are exaggerated.
- Minimum detectable effect (MDE)
- The smallest true effect a test is designed to detect. It is a business choice, and it drives sample size more than anything else.
- Sample ratio mismatch (SRM)
- A traffic split that differs significantly from the configured split, signalling a technical problem. A test that fails an SRM check should not be trusted.
- Guardrail metric
- A metric that must not deteriorate for a variant to be shipped. Guardrails stop a conversion win from hiding damage to speed, returns or customer service.
- A/A test
- A test of two identical versions, used to validate the testing set-up. It checks that your tool, tracking and randomisation produce the errors you expect and no more.
- Multi-armed bandit
- An algorithm that shifts traffic toward better-performing variants during the test. It earns more during short campaigns but gives less reliable estimates of the effect.
- CUPED
- A variance-reduction technique that uses pre-experiment data to reach conclusions with fewer visitors. It shortens tests on metrics that correlate with past behaviour, such as revenue.
Sources
Figures on experiment outcomes come from published work by Ron Kohavi and colleagues at Microsoft, cited below. Sample sizes, confidence intervals and p-values in this guide were computed by Henkan & Partners with the standard two-proportion z-test (two-sided, α = 0.05, power = 80% where relevant). The peeking and bandit figures come from Monte Carlo simulations with fixed random seeds, whose parameters are stated with each exhibit. Tool ownership was checked in September 2026.
- Kohavi, R. & Thomke, S. (2017). The Surprising Power of Online Experiments. Harvard Business Review, September–October 2017 · reprint PDF.
- Kohavi, R., Tang, D. & Xu, Y. (2020). Trustworthy Online Controlled Experiments: A Practical Guide to A/B Testing. Cambridge University Press · chapter 1 excerpt.
- Deng, A., Xu, Y., Kohavi, R. & Walker, T. (2013). Improving the Sensitivity of Online Controlled Experiments by Utilizing Pre-Experiment Data (CUPED). WSDM '13.
- Armitage, P., McPherson, C. K. & Rowe, B. C. (1969). Repeated Significance Tests on Accumulating Data. Journal of the Royal Statistical Society, Series A, 132(2).
- Google Search Central. A/B testing best practices for Search.
- Christian, B. (2012). The A/B Test: Inside the Technology That's Changing the Rules of Business. Wired.
- Fisher, R. A. (1935). The Design of Experiments. Oliver & Boyd.
- Wikipedia. A/B testing (history, including Google's first test in 2000).
- Datadog (2025). Datadog acquires Eppo · GrowthBook. Split (Harness) alternatives · Convert. Statsig moves from OpenAI to Amplitude (tool ownership changes).
- Henkan & Partners analysis: sample-size calculations (two-proportion z-test), illustrative significance calculations, bandit simulation and peeking simulation (10,000 A/A tests per scenario).