Market Report
The A/B Testing Tool Market, 2006–2026: Size, Funding, M&A and What Comes Next
Alexandre Suon · 2026-09-25
In twenty years, A/B testing software went from a free Google add-on to a $1–2B category that OpenAI, Datadog and private equity now compete to own. This is how the market was built, who paid for it, and where the product is heading.
Executive summary
- The core A/B testing software market is worth $1–2B in 2026 and grows about 11% a year. Published estimates range 14× ($0.58B to $8.13B); the credible ones and a bottom-up count of vendor revenue both land in the $1–2B range.
- Value has come from exits more than from organic growth. The two defining deals, Adobe–Omniture ($1.8B, 2009) and OpenAI–Statsig ($1.1B, 2025), are sixteen years apart and bought very different things: a marketing suite, then an engineering and AI-evaluation capability.
- The market has gone through four eras: pioneers absorbed by marketing suites (2006–09), a VC-funded visual-editor boom led by Optimizely (2010–16), consolidation and the move server-side (2017–22), and a warehouse-native, AI-driven phase triggered by the shutdown of Google Optimize (2023–26).
- Independence is now the exception. By September 2026, Optimizely belongs to Insight Partners, VWO and AB Tasty merged under Everstone, Eppo sits in Datadog, Split in Harness, and Statsig's customers moved to Amplitude.
- The next contest is over who runs the experiment loop. AI now writes variants and hypotheses, and agents are starting to launch and read tests themselves. The remaining moat is trustworthy statistics running on the company's own data, plus an institutional memory of what has been learned.
- Private equity is likely to keep consolidating the market. The most plausible strategies are rolling up mid-sized CRO specialists, adding data and AI capabilities, and then selling to a data or AI platform, the route that produced the largest recent exits.
Section 1 · The basics
An A/B testing tool splits traffic between versions and tells you, with a known level of confidence, which one performs better
An A/B test (also called a split test or online controlled experiment) shows two or more versions of a page, feature or message to randomly assigned groups of users at the same time, then compares an outcome such as conversion rate or revenue per visitor. Because assignment is random, any difference larger than chance can be attributed to the change itself, not to seasonality, marketing campaigns or the mix of visitors that week.
An A/B testing tool automates the four jobs involved: assigning each user to a variant and keeping them there, delivering the variant, measuring the outcome, and deciding whether the result is statistically reliable. The history of the market is largely a story of which of those four jobs vendors chose to own. Three architectures exist today:
| Architecture | How it works | Typical user | Examples |
|---|---|---|---|
| Client-side | A JavaScript tag changes the page in the visitor's browser after it loads. | Marketing and CRO teams testing layouts, copy and offers | VWO, AB Tasty, Kameleoon, Convert, Optimizely Web |
| Server-side / feature flags | Code on the server or in the app decides which version to serve, using an SDK. | Product and engineering teams testing features, pricing and algorithms | Optimizely Feature Experimentation, LaunchDarkly, Split (Harness), GrowthBook |
| Warehouse-native | Assignment happens anywhere; results are computed on the company's own data warehouse. | Data teams that want one version of the truth | Eppo (Datadog), Statsig Warehouse Native, GrowthBook, Optimizely Analytics |
Most large companies now use more than one of these. The shift from the first row to the third, between 2006 and 2026, explains why the buyers of these companies changed from marketing software groups to data and AI companies.
A worked example: one test followed through the tool
An online retailer wants to show the expected delivery date next to the add-to-cart button. The current page is the control, the new one the variant. Figures are illustrative.
- Plan. Product pages convert 3.0% of visitors. The team wants to detect a lift of 10% or more (3.0% to 3.3%), its minimum detectable effect. At 95% significance and 80% power, that needs about 53,000 visitors per version: roughly three full weeks at 40,000 visitors a week.
- Assign. Each visitor is placed at random in control or variant, 50/50, and kept there on every visit through a cookie or login.
- Deliver. A client-side tool inserts the date in the browser after loading; a server-side tool renders it before sending, avoiding flicker.
- Measure. The tool counts orders per visitor in each group, plus guardrails such as average order value and page load time.
- Decide. After three weeks, with about 60,000 visitors per group, control converts 3.00% (1,800 orders) and the variant 3.25% (1,950). The lift is +8.3% (95% confidence interval roughly +2% to +15%), which is significant. The team ships it and records the learning.
Most tests do not end this way: at Microsoft, only about one-third of well-designed experiments improved their target metric. Test volume, reliable answers and a memory of what was tried matter more than any single winner. Our A/B testing guide covers each step in detail.
For marketers. Work out how many tests your traffic supports before comparing tools: here, about one every three weeks. A pricier tool does not change that; bolder changes, busier pages and variance reduction do.
For investors. A vendor's pricing power depends on which of the four jobs it owns. Delivery and visual editing are easy to copy; trusted statistics and a link to the customer's own data are not, and they drew the largest recent deals.
Section 2 · Market size
A/B testing software is a $1–2B category, not the $8B some reports claim
Anyone searching for the size of the A/B testing market meets figures that cannot all be true. Five publishers covering 2023–2026 give current-year values between $0.58B and $8.13B, a spread of 14 times (Exhibit 3). Three of them (Research and Markets, Future Market Insights and Verified Market Reports) agree closely: $1.3–1.7B with annual growth of about 11%, reaching $2.7–4.8B in the early to mid 2030s.
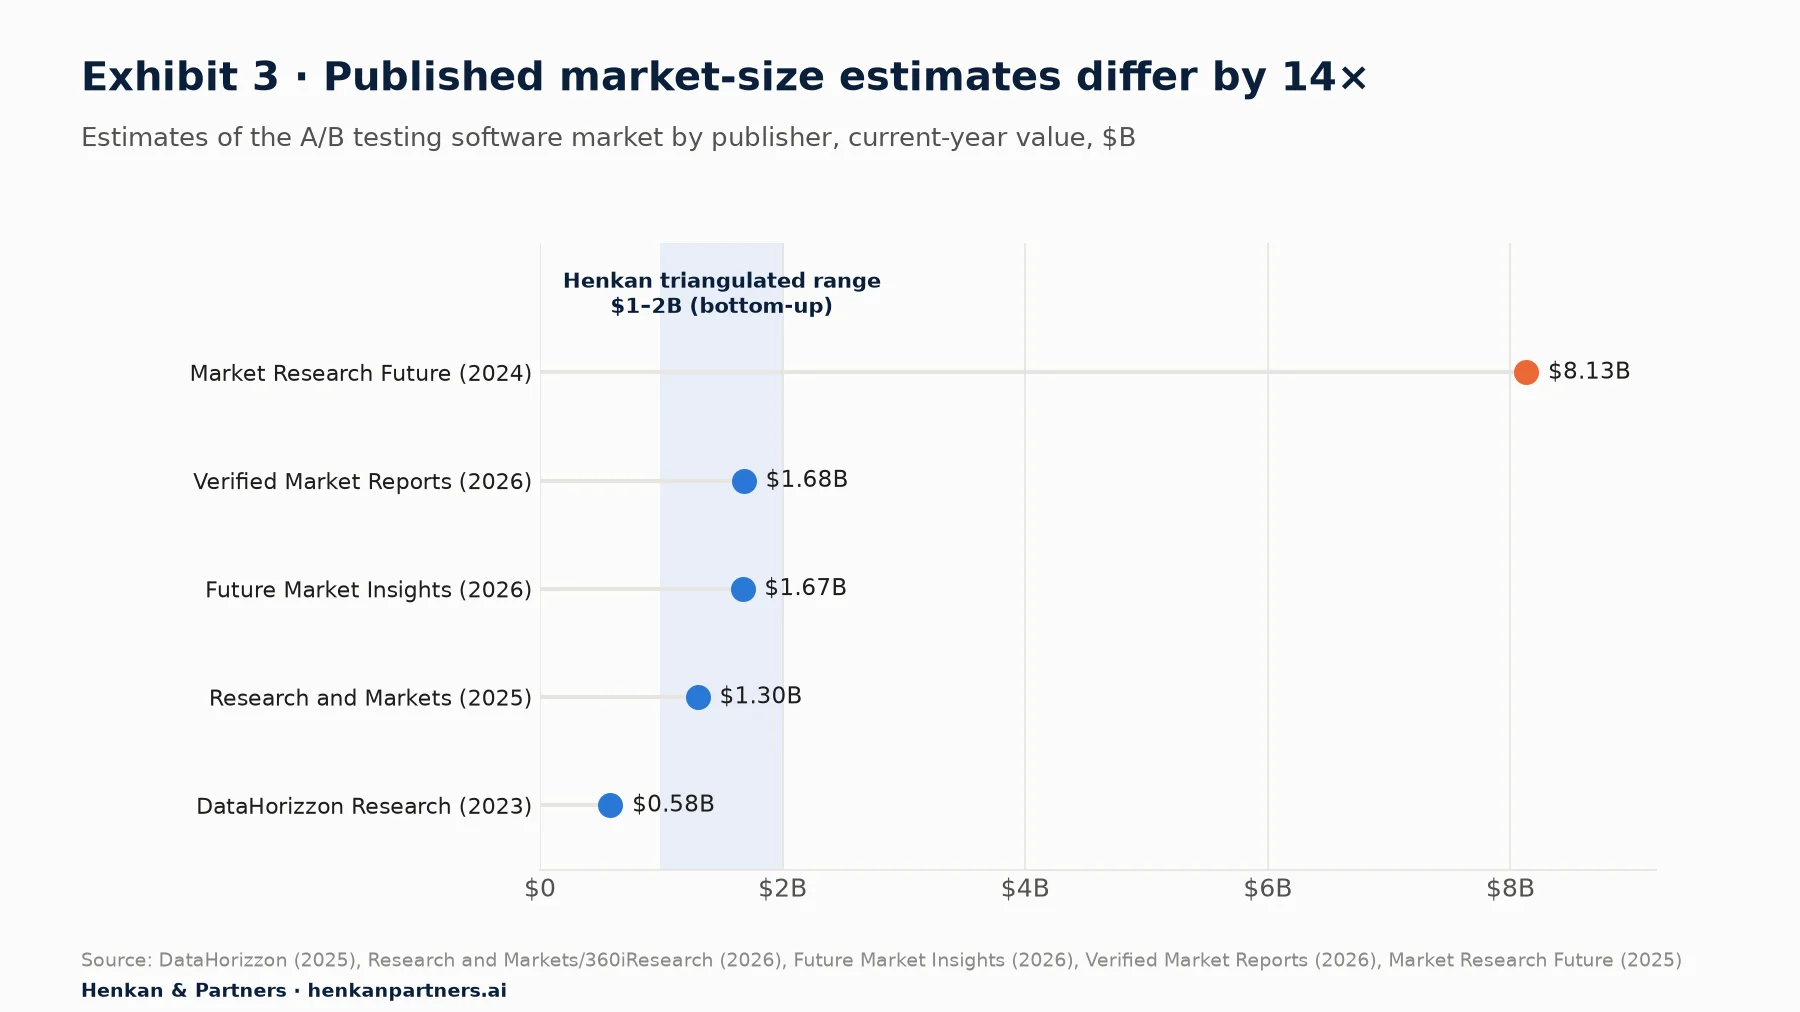
What this shows. Four of the five estimates sit within $1.1B of each other; one is five times higher than the rest. When a single report is far from the pack, it has usually defined the market more broadly, not found something the others missed. If you need a number for a business case, use the cluster, state the range, and say which definition you used.
A bottom-up count supports the lower cluster. The merged VWO and AB Tasty group reports more than $100M in annual revenue across 4,000+ customers. Statsig had about $40M in annual recurring revenue when it raised its Series C in May 2025. Optimizely reported $400M of ARR in 2024, but that figure covers its whole digital experience platform, including content management and commerce, so only part of it is experimentation. Adobe Target, Kameleoon, Dynamic Yield, Convert, Eppo, GrowthBook and the experimentation modules of Amplitude, PostHog and LaunchDarkly add the rest. Summed, experimentation-specific revenue plausibly lands between $1B and $2B. It does not reach $8B.
How to read market reports. The high estimates usually fold in adjacent categories such as personalization engines, digital experience platforms or analytics. Broader categories are much larger: "experience optimization platforms" is estimated at $17.7B for 2025. Use them for context, and never as the size of A/B testing alone.
Why published market sizes differ so much
Four reasons explain the gap. Scope: high estimates fold in personalization or whole digital experience platforms. Method: most reports work top-down from spending surveys, not from named vendors' revenues. Suite accounting: Adobe reports one Digital Experience segment without breaking out Target, and Optimizely's ARR covers its whole platform. Free and bundled tools: Google Optimize was free for most of the market's history, GrowthBook is open source, and analytics platforms now include testing, so usage can grow while licence revenue does not.
For investors, size a market from named competitors' revenues and treat report totals as a ceiling. For marketers, the useful number is your programme's cost against the revenue of the pages it tests.
Adoption is broad but shallow. According to BuiltWith data compiled by Convert, about 2.2 million websites run an A/B testing tool, around 0.2% of all sites. Among high-traffic sites the share rises steeply: 32% of the top 10,000, 21% of the top 100,000 and about 11.5% of the top million. These counts only detect client-side tags, so server-side and warehouse-native testing, the fastest-growing segment, goes uncounted.
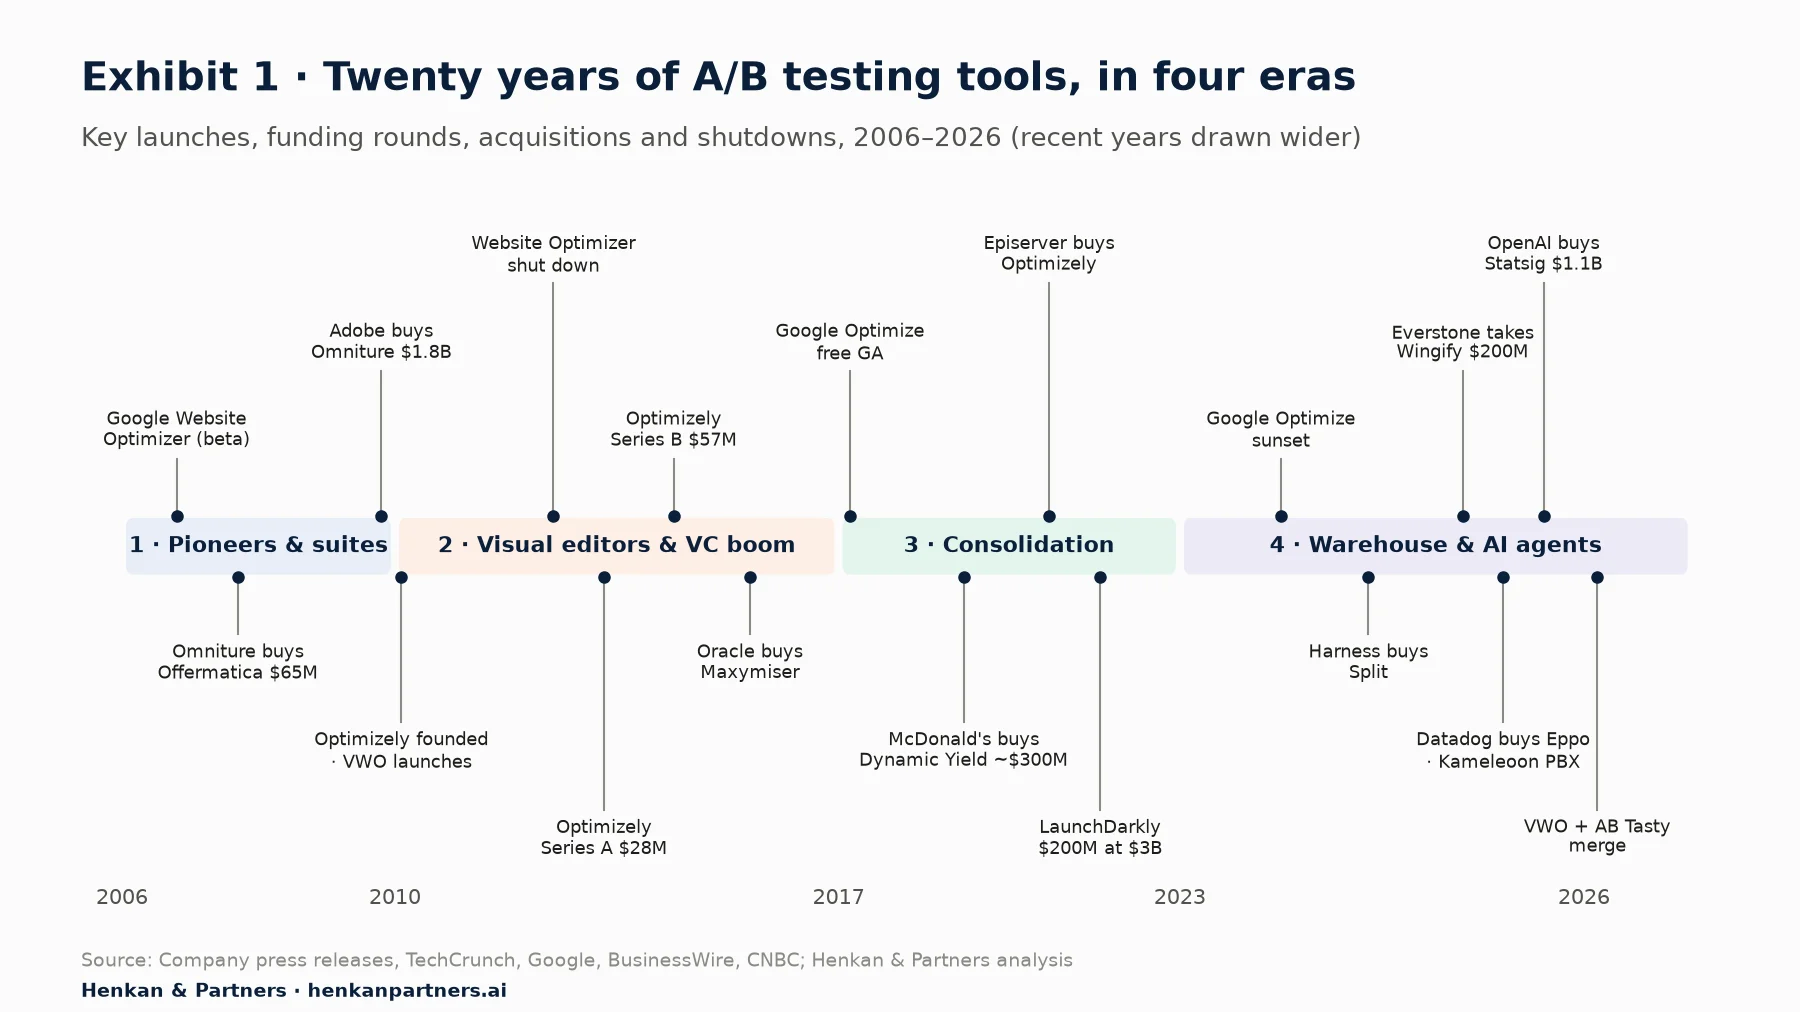
What this shows. Each era starts with a change in who can run a test. Google made testing free in 2006, the visual editor removed the need for a developer in 2010, SDKs put testing into product code from 2017, and warehouses and AI changed who analyses and designs tests from 2023. Deals follow each shift a few years later, as established players buy the capability they missed.
Section 3 · 2006–2009
Google made testing free, and the marketing suites bought the pioneers
The commercial market predates 2006. SiteSpect (Boston, 2004), Offermatica and Optimost sold testing to large retailers and publishers through services-heavy contracts. The turning point came on 18 October 2006, when Google launched Website Optimizer in beta for AdWords advertisers and then opened it to everyone in 2007. Multivariate testing became free, and the specialists had to compete on service and integration.
Within two years the enterprise analytics suites absorbed them:
- September 2007: Omniture bought Offermatica for $65M. The product became Test&Target, later Adobe Target.
- October 2007: Interwoven bought Optimost for $52M in cash. Autonomy then bought Interwoven for $775M in January 2009.
- September 2009: Adobe agreed to buy Omniture for about $1.8B, placing testing inside what became Adobe Experience Cloud.
The pattern of this era was that testing was treated as a feature of web analytics, bought by suite vendors to round out their platforms. Maxymiser (2006) and Monetate (2008) were founded in this period and followed the same enterprise, services-led model.
Why it happened. In 2006 a test meant editing templates, deploying code and hand-calculating significance, so only large retailers and publishers ran them, usually with a vendor's consultants. Analytics vendors already held the traffic data and the enterprise relationships. Adding testing let them sell "measure and act" in one contract, and buying a specialist was faster than building one. For the specialists, a free Google tool made staying independent harder.
Section 4 · 2010–2016
The visual editor put testing in marketers' hands, and venture capital paid for the land grab
In January 2010 Dan Siroker and Pete Koomen founded Optimizely in Y Combinator's winter batch. Its what-you-see-is-what-you-get editor let a marketer change a headline or button with a snippet of JavaScript and no developer. Paras Chopra launched VWO (Visual Website Optimizer, from Wingify, founded in 2009) on the same idea and grew it without outside capital. In France, AB Tasty and, in 2012, Kameleoon followed. Qubit (London, 2010) and Dynamic Yield (Tel Aviv, 2011) came in through personalization.
Google shut Website Optimizer down on 1 August 2012 and folded a simpler version into Google Analytics Content Experiments. That left room for independent tools, and investors moved in. Optimizely raised about $196M in equity by our count:
| Date | Round | Amount | Lead investor | Other investors |
|---|---|---|---|---|
| Apr 2013 | Series A | $28M | Benchmark | Bain Capital Ventures, Battery, InterWest, Google Ventures |
| May 2014 | Series B | $57M | Andreessen Horowitz | Benchmark, Bain Capital Ventures |
| Oct 2015 | Series C | $58M | Index Ventures | a16z, Bain, Battery, Benchmark, Salesforce Ventures and others |
| Jun 2019 | Series D | $50M | Goldman Sachs | Accenture Ventures (plus a $55M credit line) |
By 2013, BuiltWith found Optimizely and VWO on almost half of all websites that ran an A/B test. Forrester's first Wave for online testing (Q1 2013) counted about 20 vendors serving enterprise clients. Peers raised too: Monetate $15M (2011), Qubit $40M in a Goldman Sachs-led Series C (2016), AB Tasty $17M in its Series B (2017). Oracle bought Maxymiser in August 2015 for an undisclosed price, the last big suite acquisition of the period.
Why it happened. Three things lined up. Cheap JavaScript tags meant a test could go live without a release cycle. E-commerce and SaaS businesses had enough traffic to reach significance in days, not months. And the 2008 Obama campaign, where Siroker ran digital analytics, gave A/B testing a famous success story that made it a boardroom topic. Venture investors saw a self-serve product with low acquisition costs and a large market of marketers who had never tested before.
Search behaviour tracks the boom. Interest in "optimizely" rose past interest in "a/b testing" itself in 2013 and peaked in 2015 (Exhibit 4).
Section 5 · 2017–2022
Testing moved into the product stack, and the independents consolidated
Google returned in March 2017 with Google Optimize, free and tied to Google Analytics, after more than 250,000 requests for access during the beta. Entry-level client-side testing became a commodity again. Vendors responded by moving upmarket and into engineering:
- Server-side and full-stack SDKs let product teams test pricing, algorithms and back-end logic, not only page layouts. Optimizely Full Stack and similar products turned experimentation into a developer tool.
- Feature flags became the delivery vehicle for experiments. LaunchDarkly raised $200M at a $3B valuation in August 2021, and Split and GrowthBook (open source, 2020) grew in the same segment.
- Personalization and recommendations became the upsell. McDonald's bought Dynamic Yield for more than $300M in 2019 and sold it to Mastercard in 2022.
Ownership concentrated. Kibo bought Monetate (2019). Episerver, owned by Insight Partners, bought Optimizely in 2020 and took its name in January 2021, turning an experimentation specialist into a content-and-commerce suite that later added Zaius and Welcome. AB Tasty raised a $40M Series C led by Crédit Mutuel Innovation in 2020 and bought Epoq in 2022. Coveo bought Qubit in 2021. Ronny Kohavi, Diane Tang and Ya Xu's Trustworthy Online Controlled Experiments (2020) made statistical rigour a buying criterion, not an academic concern.
Why it happened. Client-side testing hit two limits. Free Google Optimize undercut the entry-level price, and browser privacy changes and page-speed concerns made JavaScript tags that rewrite pages harder to defend. Meanwhile the highest-value tests moved into places a tag cannot reach: search ranking, recommendations, pricing, checkout logic and mobile apps. Vendors followed the budget from marketing to product and engineering, and the suite owners bought what they could not build quickly.
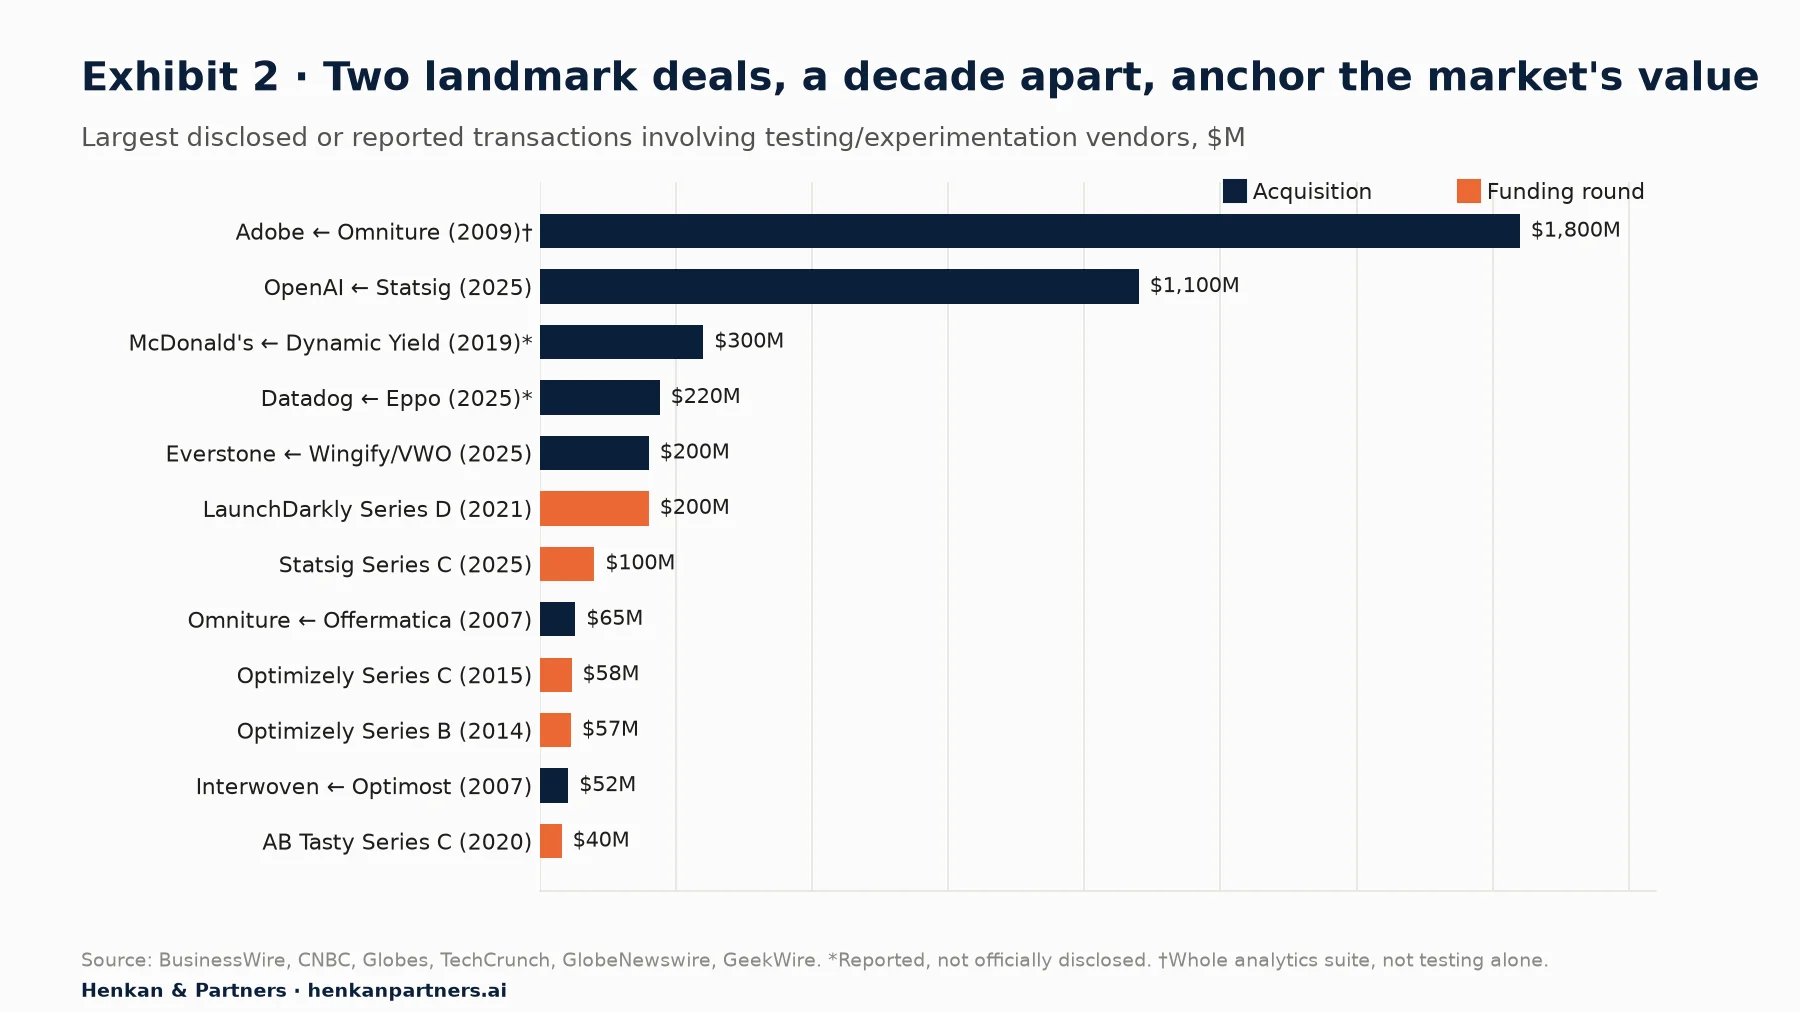
What this shows. Most rounds and deals in this market sit below $300M. Only two transactions pass $1B, and both bought more than a testing tool: Omniture was a full analytics suite, and Statsig brought a team OpenAI wanted for building AI products. Experimentation on its own has rarely commanded a large price; experimentation combined with data or distribution has.
Section 6 · 2023–2026
Google's exit reset the market, and data and AI companies became the buyers
On 30 September 2023 Google shut down Optimize and Optimize 360 without a successor and pointed GA4 users to AB Tasty, Optimizely and VWO. A large base of small and mid-sized teams had to choose a paid tool or stop testing. Searches for "google optimize alternative" still run at around 40 a month in the US three years later.
At the same time, a new generation built for data and engineering teams reached scale. Statsig (founded 2021 by ex-Facebook engineers) and Eppo (public in 2022) computed results on the customer's own data warehouse and sold on statistical depth. Then came the largest run of deals in the market's history:
| Date | Deal | Value | What the buyer wanted |
|---|---|---|---|
| Jun 2024 | Harness acquires Split | Undisclosed | Feature flags inside a software delivery platform |
| Sep 2024 | Optimizely acquires NetSpring | Undisclosed | Warehouse-native analytics |
| Jan 2025 | Everstone takes majority of Wingify (VWO) | $200M | A profitable, bootstrapped platform to consolidate around |
| May 2025 | Datadog acquires Eppo | ~$220M* | Experimentation next to observability |
| May 2025 | Statsig Series C (ICONIQ) | $100M at $1.1B | Unicorn status four years after founding |
| Sep 2025 | OpenAI acquires Statsig | $1.1B (stock) | Experimentation and evaluation for AI products; Statsig's CEO became OpenAI's CTO of Applications |
| Jan 2026 | VWO and AB Tasty merge under Wingify | Undisclosed | A $100M+ revenue group with 4,000+ customers |
| May 2026 | Amplitude takes over Statsig brand and customers | Undisclosed | Experimentation joined to product analytics |
The buyers have changed. In 2007–2009 marketing-suite vendors bought testing. In 2024–2026 the buyers were an AI lab, an observability company, a software delivery platform, a product analytics company and a private equity firm. Experimentation is now valued as infrastructure for shipping software and AI safely, as much as a conversion tool.
Why it happened. Three forces arrived together. Companies centralised their data in cloud warehouses, so a testing tool that kept its own copy of the data created a second, conflicting set of numbers. Generative AI products need constant testing of prompts and models, which made experimentation a core engineering capability at AI companies. And private equity saw a fragmented market of profitable, mid-sized vendors, a classic setup for consolidation.
For marketers. If you never replaced Google Optimize, look beyond the three tools Google names: open-source and warehouse-native options exist, and your analytics platform may include testing. Make sure your test history can be exported.
For investors. Buyers moved from marketing suites to data, cloud and AI platforms, and paid most for experimentation next to data or AI development. An asset positioned as software infrastructure has more potential buyers than marketing software.
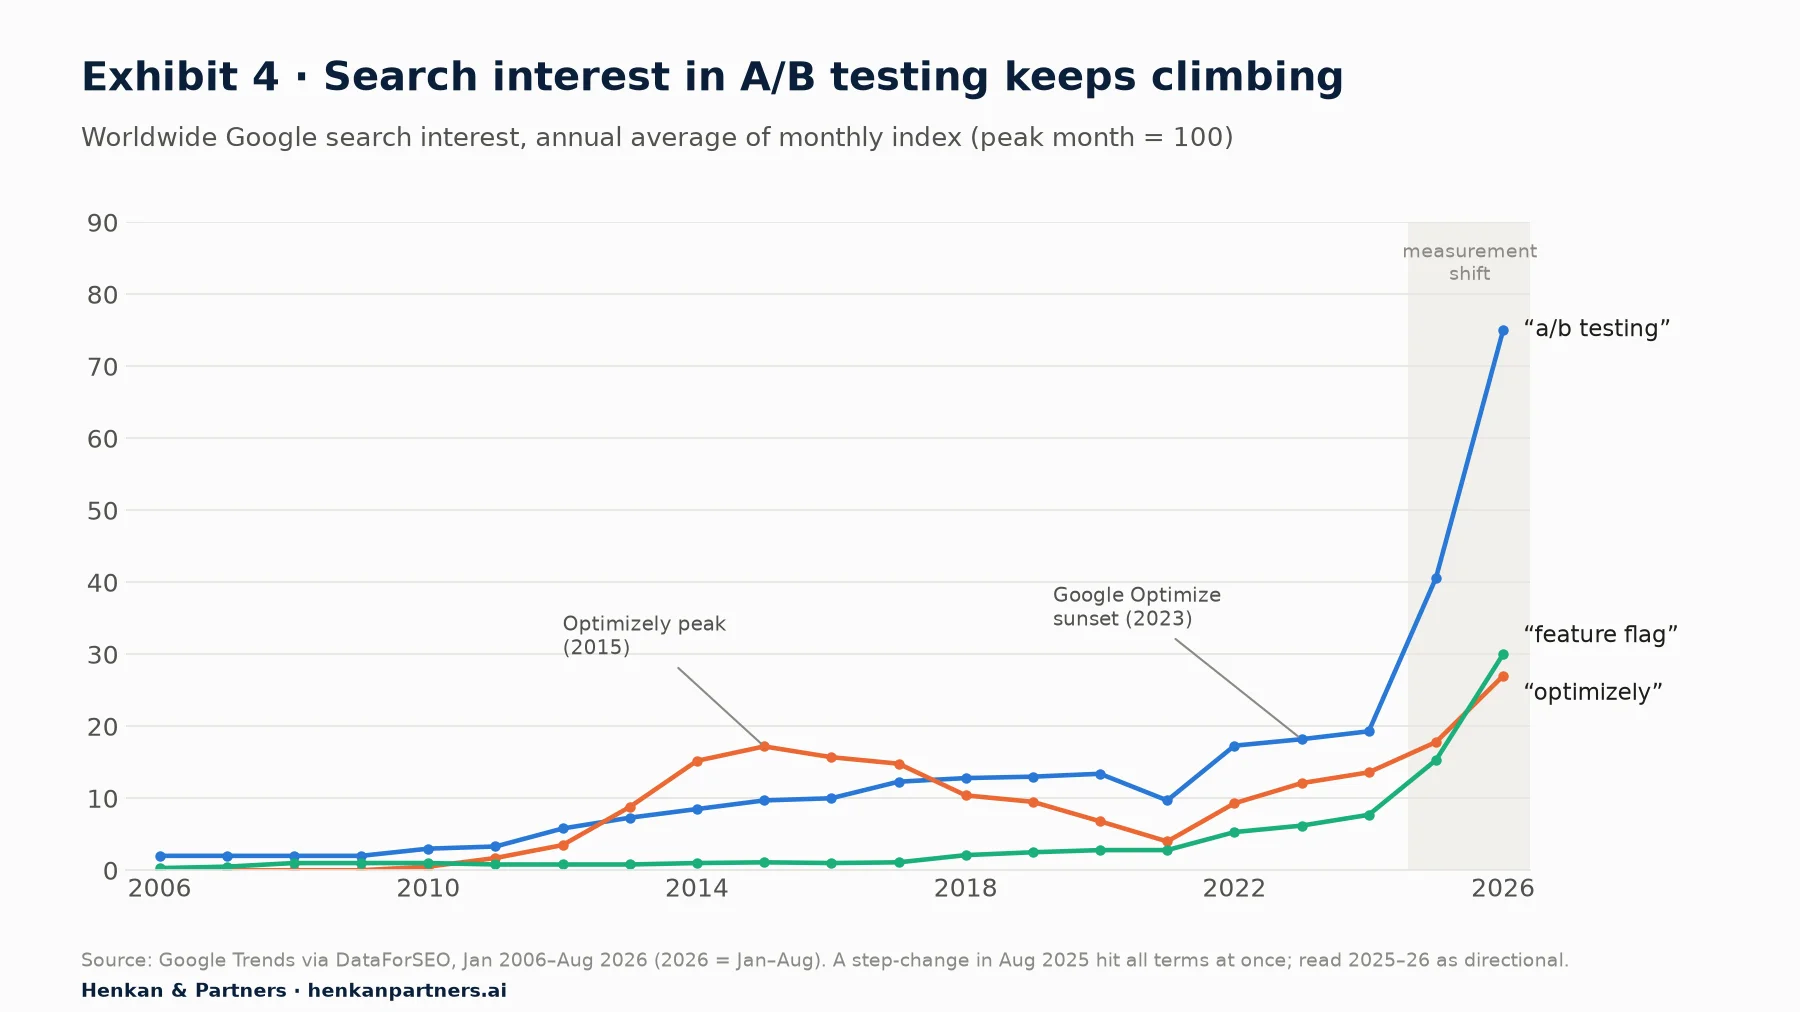
What this shows. Interest in the generic practice ("a/b testing") has grown for twenty years, while interest in the leading brand ("optimizely") peaked in 2015 and fell as it moved upmarket. The steady rise of "feature flag" since 2018 reflects testing moving into engineering teams. The practice is winning; no single tool owns it.
Section 7 · The 2026 landscape
Today's A/B testing tools fall into four groups, and most of them now belong to larger companies
For buyers comparing A/B testing tools or looking for Optimizely alternatives, the useful question is less "which tool is best" than "which group fits how we work". The table lists the main vendors in September 2026 by type and owner. It describes what each is known for; it is not a ranking.
| Group | Vendor | Known for | Owner |
|---|---|---|---|
| [object Object] | Optimizely | Web and feature experimentation inside a content, commerce and analytics suite; Opal AI agents | Insight Partners |
| Adobe Target | Testing and personalization for Adobe Experience Cloud customers | Adobe | |
| Dynamic Yield | Personalization and recommendations, with testing built in | Mastercard | |
| [object Object] | VWO | All-in-one testing with heatmaps and session recordings, strong in the mid-market | Wingify / Everstone |
| AB Tasty | Testing and personalization for marketing teams, strong in Europe | Wingify / Everstone | |
| Kameleoon | Hybrid client- and server-side testing; prompt-based experimentation | Independent | |
| Convert | Client-side testing for smaller teams and agencies, marketed on privacy | Independent | |
| [object Object] | LaunchDarkly | Feature flags and release control, with experimentation on top | Independent |
| Harness FME (Split) | Feature flags and experiments inside a software delivery platform | Harness | |
| GrowthBook | Open-source flags and warehouse-native experiments | Independent | |
| [object Object] | Eppo | Warehouse-native experimentation and statistics | Datadog |
| Statsig | Product experimentation at scale, cloud or warehouse-native | Amplitude (platform) | |
| Amplitude, PostHog, Mixpanel | Product analytics with experimentation built in | Independent (Amplitude is publicly listed) |
The groups overlap more each year. Suites add feature flags, feature-flag vendors add statistics, and analytics platforms add assignment. In practice the choice usually comes down to who owns testing in your company: a marketing or CRO team tends to fit the first two groups, a product and engineering team the last two.
For marketers. Check what you already pay for. Amplitude, PostHog and Mixpanel now include experimentation, so one contract may cover two needs. Our analysis of the digital analytics market maps how analytics and testing tools overlap.
For investors. Overlap is a pricing risk. When a customer's analytics or feature-flag vendor adds testing at little extra cost, a standalone vendor's renewal gets harder, even with a better product.
Section 8 · Investors
A small group of top-tier investors funded the category, and private equity now owns most of it
| Company | Founded | Key investors | Owner, Sept 2026 |
|---|---|---|---|
| Optimizely | 2010 | Y Combinator, Benchmark, a16z, Index, Goldman Sachs, Bain Capital Ventures | Insight Partners (via Episerver) |
| VWO (Wingify) | 2009 | None (bootstrapped) | Everstone Capital |
| AB Tasty | c. 2010 | Partech, Korelya, XAnge, Omnes, Crédit Mutuel Innovation | Wingify / Everstone (merged 2026) |
| Kameleoon | 2012 | Odyssée Venture, SGPA (€5M, 2019) | Independent |
| Statsig | 2021 | Sequoia, Madrona, ICONIQ Growth | OpenAI (team); Amplitude (platform) |
| Eppo | 2022* | Menlo, Innovation Endeavors, Icon, Amplify | Datadog |
| LaunchDarkly | 2014 | Lead Edge, Insight Partners, Top Tier | Independent |
| Qubit | 2010 | Goldman Sachs, Accel, Sapphire, Salesforce Ventures | Coveo |
| Monetate | 2008 | OpenView, First Round | Kibo |
| Dynamic Yield | 2011 | Raised ~$83M before exit | Mastercard |
Three patterns stand out. First, a handful of firms (Goldman Sachs, Insight Partners, Salesforce Ventures) appear repeatedly across competitors. Second, the European challengers were funded mainly by French venture and bank-affiliated funds, with smaller rounds than their US peers. Third, one of the largest outcomes of the period, Everstone's $200M deal for VWO, went to a company that never raised venture money.
Section 9 · Product direction
The product frontier moved from the browser to the warehouse, and now to AI agents
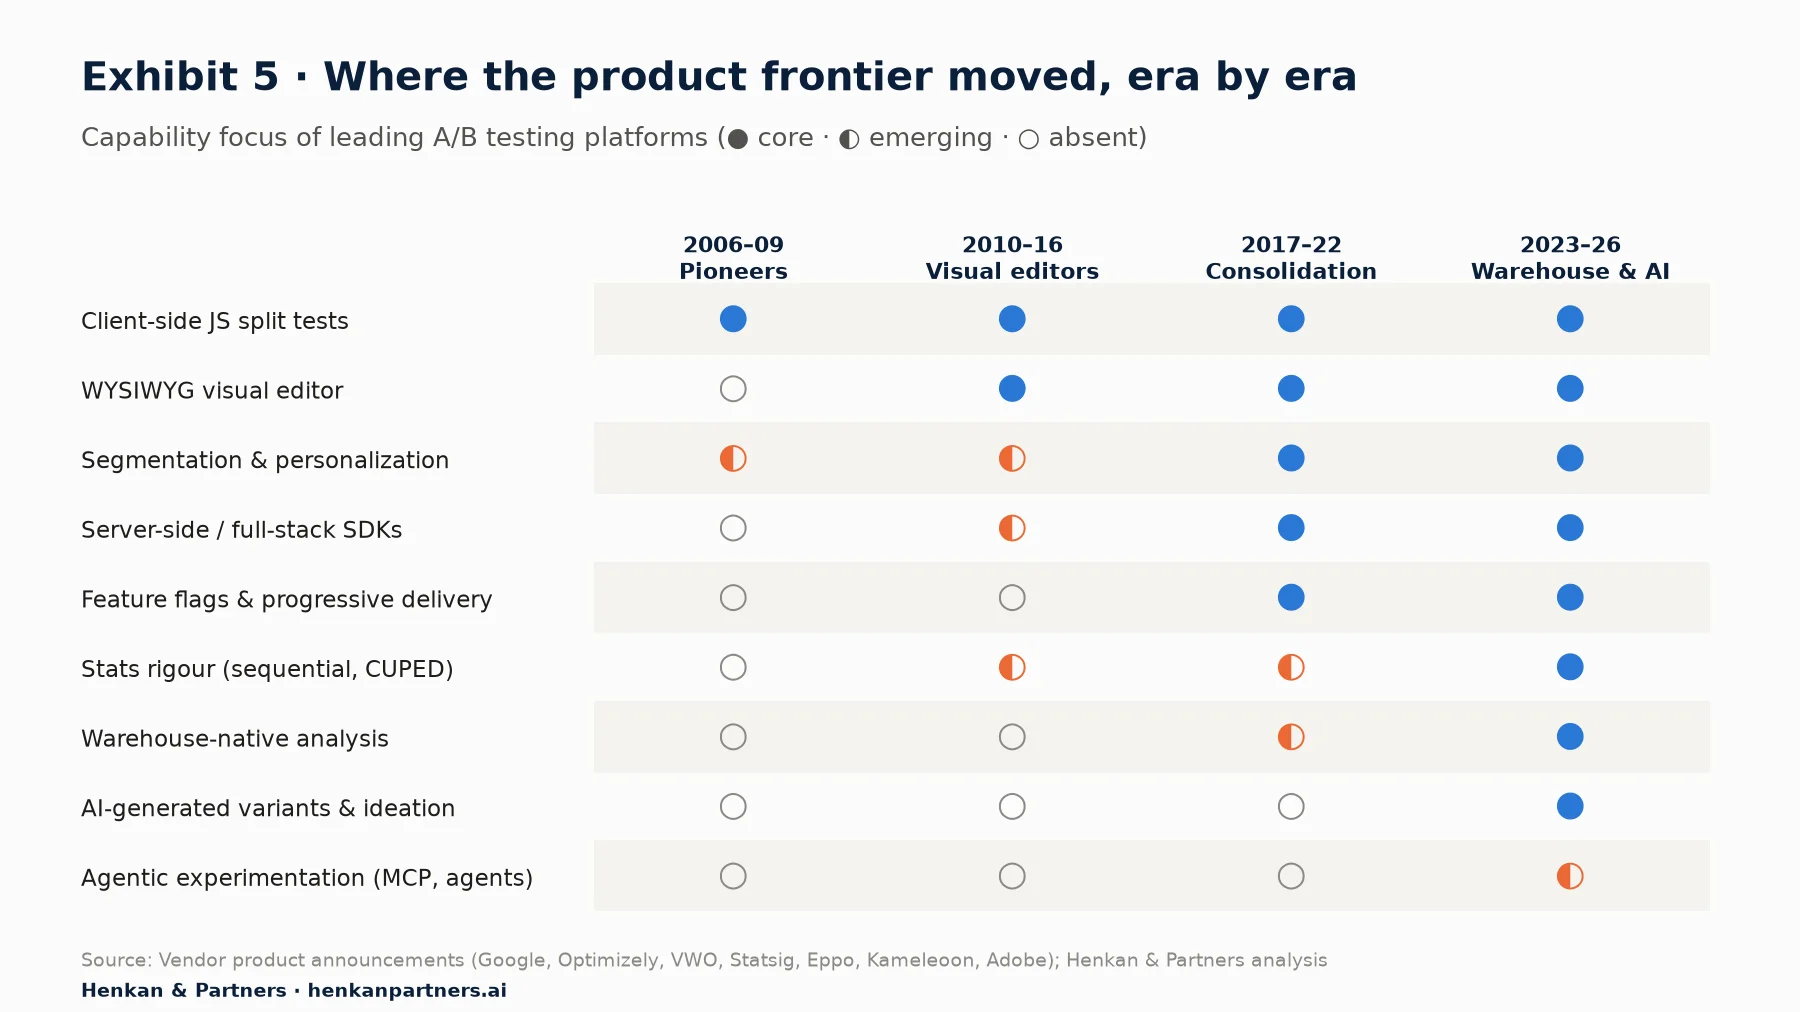
What this shows. Capabilities accumulate; almost nothing drops off. A 2026 platform is expected to offer the visual editor from 2010, the SDKs from 2017 and the warehouse connection from 2023, plus AI. That raises the cost of competing and is one reason smaller vendors are merging.
Warehouse-native analysis
Statsig launched Warehouse Native in June 2023, Eppo was built on the model, and Optimizely bought NetSpring in 2024 to add it. Results are computed on Snowflake, BigQuery or Databricks, so experiment metrics match the finance team's numbers and no event data is copied to the vendor.
Statistical rigour as a feature
Sequential testing (valid early stopping), CUPED-style variance reduction, guardrail metrics and sample-ratio-mismatch alerts moved from in-house platforms at Microsoft, Booking.com and Netflix into commercial products. Buyers now compare statistics engines, not only editors.
In plain terms: sequential testing lets a team check results every day without inflating the chance of a false winner, which classic tests forbid. Variance reduction (CUPED) uses each user's behaviour before the test to filter out noise, so tests reach a reliable answer with less traffic and in less time. Guardrail metrics stop a test that lifts conversion while quietly hurting revenue or page speed. Sample-ratio-mismatch alerts flag when the traffic split itself is broken, which invalidates the result however good it looks.
AI-generated tests and agents
Kameleoon launched Prompt-Based Experimentation in June 2025, letting teams describe a variant in plain language. Optimizely rebuilt its Opal AI around marketing agents in May 2025, added agent orchestration in September 2025 and "virtual teammates" in September 2026. Adobe introduced an Experimentation Agent in Journey Optimizer in September 2025. The direction is clear: AI generates the hypotheses and variants, and increasingly launches and reads the tests.
This changes the economics of a testing programme. For fifteen years the constraint was production: designing and coding a variant took days, so teams ran a handful of tests a month. When a variant costs almost nothing, the constraint moves to traffic (each test still needs enough visitors to reach a reliable answer), to prioritisation (choosing the tests most likely to matter) and to memory (knowing what has already been tried, so AI does not rerun last year's losers). Programmes that manage those three constraints will get more from AI than programmes that simply generate more variants.
Experimentation for AI products
OpenAI's purchase of Statsig shows a new use: testing prompts, models and AI features in production. The experimentation platform becomes part of how AI is evaluated and released safely.
For marketers. Ask vendors which statistical method they use, whether variance reduction is included and how sample-ratio mismatch is flagged. These decide how many reliable answers your traffic can produce.
For investors. As AI makes variants cheap, value moves to a credible statistics engine, access to customer data and a record of past results. Vendors built around the visual editor face the most pressure.
Section 10 · Implications
Buyers should choose on data architecture and statistical trust, not on the visual editor
Twenty years of market history point to five practical lessons for anyone selecting, renewing or replacing an A/B testing tool in 2026. They apply to marketing, CRO, product and data teams of any size, from a few tests a year to a full programme, and double as a checklist for investors assessing how a company tests.
1. Check who owns your vendor
Most platforms changed hands between 2024 and 2026, and new owners commonly revisit pricing, bundles and roadmap priorities. Before renewing, ask for written commitments on price increases, the product roadmap for your use case and the export of your experiment history.
2. Decide where results are computed
If your company reports revenue and conversion from a data warehouse, a tool that computes results in its own database will eventually disagree with finance. A warehouse-native tool, or one that can read from the warehouse, avoids arguments about whose number is right.
3. Audit the statistics engine
Ask each vendor which method it uses (frequentist, Bayesian or sequential), whether it supports variance reduction, and how it detects sample-ratio mismatch. A vendor that cannot answer clearly is asking you to trust results you cannot check.
4. Treat AI variant generation as a volume multiplier
AI features are worth paying for only if you can run more tests. Estimate how many tests your traffic supports each month at your usual effect size. If the answer is five, a tool that generates fifty variants does not help; better prioritisation does.
5. Keep a system of record for what you learn
Most of the leading tools in this market have changed owner or name at least once. Test results stored only inside a vendor's interface are lost at migration. Keep hypotheses, results and decisions in a repository your company owns, so the knowledge survives the next change of tool.
Section 11 · Outlook
Private equity's next moves: consolidate the specialists, add data and AI, then sell to a platform buyer
Private equity already controls a large share of the market. Insight Partners bought Episerver for $1.16B in 2018 and has owned Optimizely through it since 2020. Everstone built the VWO and AB Tasty group in 2025–26. Kibo, which bought Monetate, is itself investor-owned. The category suits buyout investors: revenue is recurring, tools are embedded in customers' websites and apps so switching is slow, the mid-market is fragmented, and several vendors grew profitably without venture money. Growth of around 11% a year is solid rather than spectacular, so returns depend more on consolidation and repositioning than on the market lifting everyone.
Based on the deals so far, we see five strategies open to financial investors over the next three to five years. They are our reading of the market, not reported plans of any firm.
| Strategy | Investment logic | Precedent | Main risk |
|---|---|---|---|
| 1. Roll up the CRO specialists | Merge mid-sized testing vendors to cut duplicate costs, cross-sell across regions and reach the scale strategic buyers look for | Everstone: Wingify (2025) + AB Tasty (2026) | Customers churn during platform migrations |
| 2. Bolt on adjacent tools | Add analytics, session replay, personalization, search or customer data so the platform sells "optimization" rather than "testing" | Optimizely: Zaius, Welcome, NetSpring; AB Tasty: Epoq | A broad suite that is second-best at everything |
| 3. Reposition around warehouse and AI | Rebuild on the customer's data warehouse and add agents that design, launch and read tests, moving pricing from seats to usage or outcomes | Optimizely Opal agents; Kameleoon PBX; Statsig Warehouse Native | Heavy engineering spend during the holding period |
| 4. Combine software with expert services | Buy or partner with specialist agencies to run programmes for clients, raising retention and revenue per account | Services were central in the 2006–2010 era; no major recent deal | Lower margins and valuation multiples on services revenue |
| 5. Carve-outs and take-privates | Buy experimentation products that larger owners no longer prioritise, or listed analytics companies trading at low valuations | Statsig's platform moving from OpenAI to Amplitude (2026) shows such assets change hands | Underinvested products with ageing technology |
How each strategy creates value
Private equity returns come from three sources: revenue growth, better margins and selling at a higher multiple than the purchase price. Each strategy relies on a different mix.
- Rolling up specialists: cost savings and multiple expansion. Merged vendors share engineering and sales, and a larger group sells at a higher multiple.
- Bolting on adjacent tools: cross-selling. Selling replay, personalization or feedback to testing customers raises revenue per account and switching costs.
- Repositioning around warehouse and AI: multiple expansion. Usage-priced infrastructure for data teams appeals to the platforms that paid the highest recent prices.
- Software plus services: retention. Clients whose programme is run by experts test more and stay longer, though services revenue is valued lower.
- Carve-outs and take-privates: buying cheaply and improving operations. Neglected products often keep loyal customers.
What to check in due diligence
Our checklist for risks specific to experimentation vendors:
- Net revenue retention. Well above 100% signals customers expanding their programmes; below 100% often means they test less or have switched to a cheaper tool.
- Revenue at risk from free or bundled tools. Estimate the share of customers using only basic client-side testing, which open-source tools and analytics platforms now offer at little or no extra cost.
- Pricing model. Pricing on monthly tracked users (MTU) or traffic grows with customers but falls if their traffic drops; seat pricing is exposed if AI agents replace the people who build tests.
- Statistics engine credibility. Check the methods, their documentation and whether customers' data teams trust the results.
- Warehouse integration. Without it, the vendor is exposed to warehouse-native rivals and to buyers who want one set of numbers.
- Customer concentration. A few enterprise accounts can dominate revenue; one churned account can change the growth story.
- Client-side scripts and site speed. Tags that hide the page until changes apply can delay loading: in one measured case the main content appeared at 6.0 seconds instead of 2.7. Check revenue from client-side testing and server-side alternatives.
Likely exit routes
Recent history points to three exits. The first, and so far most valuable, is a sale to a data, cloud or AI platform that wants experimentation next to its core product, as Datadog and OpenAI did in 2025. The second is a secondary buyout to a larger private equity fund once a roll-up reaches scale. An IPO is the least likely route for a pure testing company: even the merged VWO and AB Tasty group, at around $100M in revenue, is small by the standards of recent software listings. Holding periods matter here. Insight Partners has held Episerver-Optimizely since 2018, longer than a typical buyout, which makes Optimizely the most obvious candidate for a sale or recapitalisation in the coming years, although no process has been reported.
Risks investors will price in
- Bundling. Analytics, customer data and cloud platforms increasingly include experimentation at little or no extra cost, which caps what standalone tools can charge.
- AI commoditisation. If AI can generate variants and read results inside any analytics tool, the testing layer itself may be worth less than the data and traffic around it.
- Client-side headwinds. Privacy rules, browser restrictions and page-speed pressure weigh on the JavaScript-tag model that most CRO specialists still rely on.
- Integration risk. Roll-ups create value only if customers move to a shared platform without leaving; a merger that keeps every product running separately saves little.
Signals to watch in 2027
Four developments would show which strategies are working: whether the Wingify group moves AB Tasty and VWO customers onto one platform; whether Optimizely's owner starts a sale process; whether the remaining independents, such as Kameleoon, Convert and GrowthBook, raise growth capital or become acquisition targets; and whether a data or AI platform makes another purchase on the scale of Eppo or Statsig. For companies that buy these tools, the practical implication is the same as in Section 10: expect further changes of ownership, and keep your experiment data and learnings portable.
FAQ
Frequently asked questions about the A/B testing tool market
Frequently asked questions
How big is the A/B testing software market in 2026?
Published estimates for 2023–2026 range from $0.58B to $8.13B. The three most consistent reports cluster at $1.3–1.7B with about 11% annual growth, which matches a bottom-up view of vendor revenues. We place the core A/B testing software market at $1–2B.
What replaced Google Optimize?
Google shut down Optimize and Optimize 360 on 30 September 2023 and did not launch a successor. It now points GA4 users to third-party integrations, naming AB Tasty, Optimizely and VWO.
Who bought Statsig?
OpenAI acquired Statsig in September 2025 in an all-stock deal valued at $1.1B. In May 2026 Amplitude took over the Statsig brand, platform and customers through a strategic partnership, while the Statsig team stayed at OpenAI.
Did VWO and AB Tasty merge?
Yes. In January 2026 Everstone Capital combined VWO and AB Tasty under Wingify, creating a group with more than $100M in annual revenue and more than 4,000 customers. Everstone had taken a majority stake in Wingify for $200M in January 2025.
What is warehouse-native experimentation?
It computes test results directly on the company's own data warehouse (Snowflake, BigQuery, Databricks) instead of copying events into the vendor's database. Eppo, Statsig Warehouse Native, GrowthBook and Optimizely (via NetSpring) offer it.
Why is private equity investing in A/B testing tools?
A/B testing software has recurring revenue, high switching costs and a fragmented mid-market with several profitable vendors, which suits buy-and-build strategies. Insight Partners owns Optimizely through Episerver, and Everstone Capital merged VWO and AB Tasty in 2026. Likely next steps are further consolidation, adding data and AI capabilities, and exits through sales to data or AI platforms.
Which A/B testing tools are independent in 2026?
Most leaders now sit inside larger groups: Optimizely (Insight Partners), VWO and AB Tasty (Wingify/Everstone), Adobe Target (Adobe), Eppo (Datadog), Split (Harness) and Dynamic Yield (Mastercard). Kameleoon, Convert, GrowthBook, PostHog and LaunchDarkly remain independent.
Choosing or replacing an experimentation platform?
Henkan & Partners runs vendor-neutral platform selections, migrations and experimentation programmes for e-commerce and travel brands in Europe and North Africa.
Talk to our experimentation team →
Key terms
- A/B test
- Showing two or more versions of a page or feature to randomly assigned groups at the same time and comparing an outcome such as conversion. Also called a split test or experiment.
- Control and variant
- The control is the current version; a variant is the changed one. A tool must keep each user in the same group for the whole test, or the result is unreliable.
- Statistical significance
- How unlikely the observed difference would be if the change had no effect. At 95%, a false winner appears by chance less than 5% of the time. The engine computing it is what buyers really trust.
- Minimum detectable effect (MDE)
- The smallest lift a test is designed to detect reliably. Smaller effects need far more visitors, so the MDE limits how many tests a site can run.
- Sequential testing
- A method that lets teams check results as data arrives and stop early without inflating false winners. Classic tests forbid this "peeking"; serious platforms now offer it.
- CUPED (variance reduction)
- A technique published by Microsoft researchers in 2013 that uses each user's pre-test behaviour to remove noise. Tests need less traffic, so it is a key point of comparison between statistics engines.
- Client-side vs server-side
- Client-side tools change the page in the browser with a JavaScript tag; server-side tools choose the version before it is sent. Client-side is easy for marketers but can slow pages; server-side needs developers but reaches pricing, search and apps.
- Visual editor
- A point-and-click editor for changing a headline or button without code. It created the self-serve market in 2010 and no longer sets vendors apart.
- Feature flag
- A switch in the code that turns a feature on or off for chosen users without a release. Flags became the delivery vehicle for server-side tests, bringing LaunchDarkly and Split into this market.
- Warehouse-native
- Computing results on the company's own data warehouse (Snowflake, BigQuery, Databricks) instead of the vendor's database. It keeps one version of the truth and underpins the Eppo and Statsig deals.
- ARR
- Annual recurring revenue: the yearly value of subscriptions in force. It is the main size measure for software companies and the basis of most valuations.
- Revenue multiple
- Value divided by revenue or ARR. Statsig's $1.1B valuation on about $40M of ARR in 2025 was over 25x. Growth and retention justify higher multiples.
- Net revenue retention (NRR)
- This year's revenue from last year's customers divided by what they paid last year. Above 100%, customers spend more; below, they are cutting back or switching to cheaper or bundled tools.
- Take-private
- An investor buys all the shares of a listed company and delists it. It suits companies trading below what a private owner could make of them.
- Carve-out
- Buying a division from an owner that no longer sees it as core. Dynamic Yield's sale by McDonald's to Mastercard and Statsig's platform moving to Amplitude show testing assets change hands this way.
- Roll-up, platform and bolt-on
- A roll-up builds a larger company from several smaller ones: the first is the platform, each addition a bolt-on. Everstone's combination of VWO and AB Tasty is this market's clearest example.
- Secondary buyout
- One private equity fund sells a company to another, as Accel-KKR sold Episerver (later Optimizely's owner) to Insight Partners in 2018.
Methodology & sources
Deal values are those disclosed by the parties or reported by named outlets; reported figures are marked. Market-size estimates are publisher summary figures and were not independently audited. The $1–2B range is Henkan & Partners' triangulation, not a measured figure. The private equity strategies in Section 11 are our analysis of possible scenarios, not reported plans of any firm, and not investment advice. The worked example in Section 1 uses illustrative figures, not client data. The due-diligence checklist is Henkan & Partners' view. Research completed 25 September 2026; explanatory sections added 26 September 2026.
- Google Website Optimizer launch, Oct 2006
- VentureBeat: Omniture buys Offermatica for $65M
- TechCrunch: Interwoven acquires Optimost for $52M
- BusinessWire: Adobe to acquire Omniture
- TechCrunch: Optimizely Series A · Series B · Series C · Series D
- Forrester: online testing Wave, 2013
- BuiltWith: what's happening in the A/B testing market, 2013
- Oracle buys Maxymiser
- Google: Optimize now free for everyone, 2017
- Google: Optimize sunset and GA4 A/B testing integrations
- Globes: McDonald's buys Dynamic Yield
- CMSWire: Episerver acquires Optimizely
- LaunchDarkly Series D at $3B
- TechCrunch: AB Tasty raises $40M
- Harness completes acquisition of Split
- Optimizely to acquire NetSpring
- TechCrunch: Everstone acquires Wingify for $200M
- TechCrunch: Datadog acquires Eppo
- GeekWire: Statsig raises $100M at $1.1B
- CNBC: OpenAI buys Statsig for $1.1B
- TechCrunch: Everstone combines Wingify and AB Tasty
- Amplitude and Statsig partnership, May 2026
- Kameleoon: Prompt-Based Experimentation
- Optimizely Opal agentic AI, May 2025
- Adobe Journey Optimizer Experimentation Accelerator
- Optimizely reaches $400M ARR
- Research and Markets: A/B testing software · Future Market Insights · Verified Market Reports · Market Research Future · DataHorizzon
- Convert: A/B testing adoption statistics (BuiltWith data)
- Accel-KKR: Insight Venture Partners invests in Episerver ($1.16B, 2018)
- Deng, Xu, Kohavi and Walker: Improving the sensitivity of online controlled experiments by utilizing pre-experiment data (CUPED, 2013)
- Kohavi et al.: Online Experimentation at Microsoft (about one-third of ideas improve the target metric)
- Wingify (VWO): visitor counting and monthly tracked users · Optimizely: impression and MAU usage
- DebugBear: anti-flicker snippets from A/B testing tools and page speed
- Adobe Q3 fiscal 2025 results: segment reporting