Market Report
The Digital Analytics Market, 1995–2026: Web, Product and Experience Analytics, and Where Value Goes Next
Alexandre Suon · 2026-09-26
Google made the base layer free in 2005. Since then, product analytics, experience analytics and data collection have grown on top, converged, and attracted billions in deals. This is how the five categories fit together, where each one stops, and where value is heading.
Executive summary
- Digital analytics is five overlapping categories, not one market: web analytics, mobile app analytics, product analytics, digital experience analytics (DXA) and the data collection layer beneath them. Each answers a different question, and since 2020 their leading vendors have been moving into each other's territory.
- Google turned the base layer into a free utility in 2005, and it still is. Google Analytics runs on 47% of all websites. Microsoft Clarity, also free, is now on more sites than Hotjar. Paid vendors earn their money above that free floor: in enterprise suites, product analytics, experience analytics and first-party data.
- The largest deals bought data infrastructure and suites, not dashboards. Twilio paid $3.2B for Segment (2020) and Adobe $1.8B for Omniture (2009). Contentsquare raised $1.4B and bought eight companies, including Hotjar and Heap, to build the category's only large roll-up.
- Valuations reset after 2021. Amplitude listed at about $7.1B and is worth about $1.7B today, roughly four times its $410M of annual recurring revenue. Glassbox went public at about $500M and was taken private for $150M. Flurry was shut down, and Cisco is retiring Smartlook.
- Private equity already shapes the category and has five clear plays: consolidating experience analytics, taking listed vendors private, carving out neglected assets, combining analytics with experimentation and feedback, and backing European, privacy-first vendors.
- Value is moving from dashboards to owned data and AI answers. We expect the most value to build up in first-party data collection, warehouse-native metrics and behavioural data that feeds AI products. Standalone dashboards, heatmaps and mobile SDK analytics will keep losing pricing power.
Section 1 · The basics
Five categories of analytics tools answer five different questions
"Analytics tool" covers software that does very different jobs. A marketing director asking where traffic came from, a product manager asking why users stop using a feature, and a UX designer asking why a checkout button is ignored all need different data, collected and modelled in different ways. The market has grown as five categories, each with its own leaders, buyers and economics.
| Category | Question it answers | Unit of analysis | Typical buyer | Leaders in 2026 |
|---|---|---|---|---|
| Web analytics | Where do visitors come from, and which channels and pages convert? | Sessions and pageviews | Marketing, e-commerce | Google Analytics 4, Adobe Analytics, Piano Analytics, Matomo |
| Mobile app analytics | How is the app installed, used and does it crash? | App events and devices | Mobile and engineering teams | Firebase / GA4, platform tools; Flurry has closed |
| Product analytics | Which behaviours drive activation, retention and revenue? | Identified users and events | Product and growth teams | Amplitude, Mixpanel, PostHog, Pendo, Heap |
| Digital experience analytics (DXA) | Why do users struggle on a page or screen? | Clicks, scrolls, sessions replayed | UX, CRO and digital teams | Contentsquare (with Hotjar), FullStory, Quantum Metric, Glassbox, Microsoft Clarity |
| Data collection | How is behavioural data captured, governed and delivered? | Raw events and identities | Data and engineering teams | Segment (Twilio), Snowplow, Tealium, RudderStack, Google Tag Manager, Commanders Act |
The categories are layers as much as competitors. Data collection sits underneath. Web and mobile analytics report on the traffic. Product analytics models what users do over time. Experience analytics shows what happened on the screen. Most large companies use three or four of these at once, which is exactly the overlap vendors are now trying to capture.
A worked example: one customer seen by five tools
Take a shopper who clicks a social media ad for running shoes, browses on her phone, hesitates, buys later on the retailer's app and comes back three months later. Each category sees a different part of that story:
- Data collection records each action as an event (ad click, product viewed, size selected, added to cart), notes whether she accepted cookies, and forwards the events to the other tools.
- Web analytics credits the visit to the paid social campaign and counts it as a session that did not convert. It answers the marketing question: is this campaign bringing buyers or only visitors?
- Experience analytics shows that on the product page she opened the size guide three times and scrolled back up before leaving. It answers the design question: what on the page stopped her?
- Mobile app analytics records that she installed the app, which version she used and whether it crashed at checkout.
- Product analytics follows her as an identified customer after she logs in: she bought, used order tracking and returned to buy again. Across thousands of customers, it answers the retention question: which behaviours predict a second purchase?
The same person therefore appears in five tools, often under five different identifiers and with five definitions of a "conversion". This fragmentation is the root of most analytics problems in large companies, and the reason vendors are now moving into each other's categories (Section 7).
Section 2 · Market size
Published market sizes overlap and cannot be added; real vendor revenues are far smaller
Research firms size each category separately, and their definitions overlap heavily. Recent estimates put web analytics at $6.3–9.2B (2025–26), product analytics at $10.6–25.9B (2025), mobile analytics at $9–14B, session replay at $1.2B (2024) and customer data platforms at $4.1–10.5B (2026). Product analytics comes out larger than web analytics, which shows how much each report folds in suites, services and neighbouring software.
Vendor revenues give a harder reality check. Amplitude, the largest listed pure play, expects about $410M of revenue in 2026. Contentsquare described its revenue as "several hundred million" dollars of ARR in 2022. Segment was about 7% of Twilio's 2023 revenue. Piano expected about $100M of revenue in 2025 across all its products. PostHog's ARR is estimated at under $60M. The CDP Institute counts about $2.9B of actual revenue across all customer data platform vendors, against forecasts of up to $10.5B.
Our reading. Google and Adobe do not disclose analytics revenue, and most websites use a free tool. Outside those two suites, paid analytics software is a pool of a few billion dollars a year, not the tens of billions in market reports. It is growing at low to mid double digits.
Why published market sizes differ so much
Three reasons explain the gap between reports and reality. First, scope: some reports include consulting services, business intelligence software or marketing clouds in "analytics". Second, method: most estimates are built top-down from surveys of spending intentions, not bottom-up from the revenues of named vendors. Third, free tools: the most used products earn no licence revenue at all, so usage and market value move apart.
For investors, the practical rule is to size a target's market from the revenues of its named competitors, and to treat report totals as an upper bound. For marketers, the useful comparison is not the market total but your own analytics spend relative to the revenue your website and app generate.
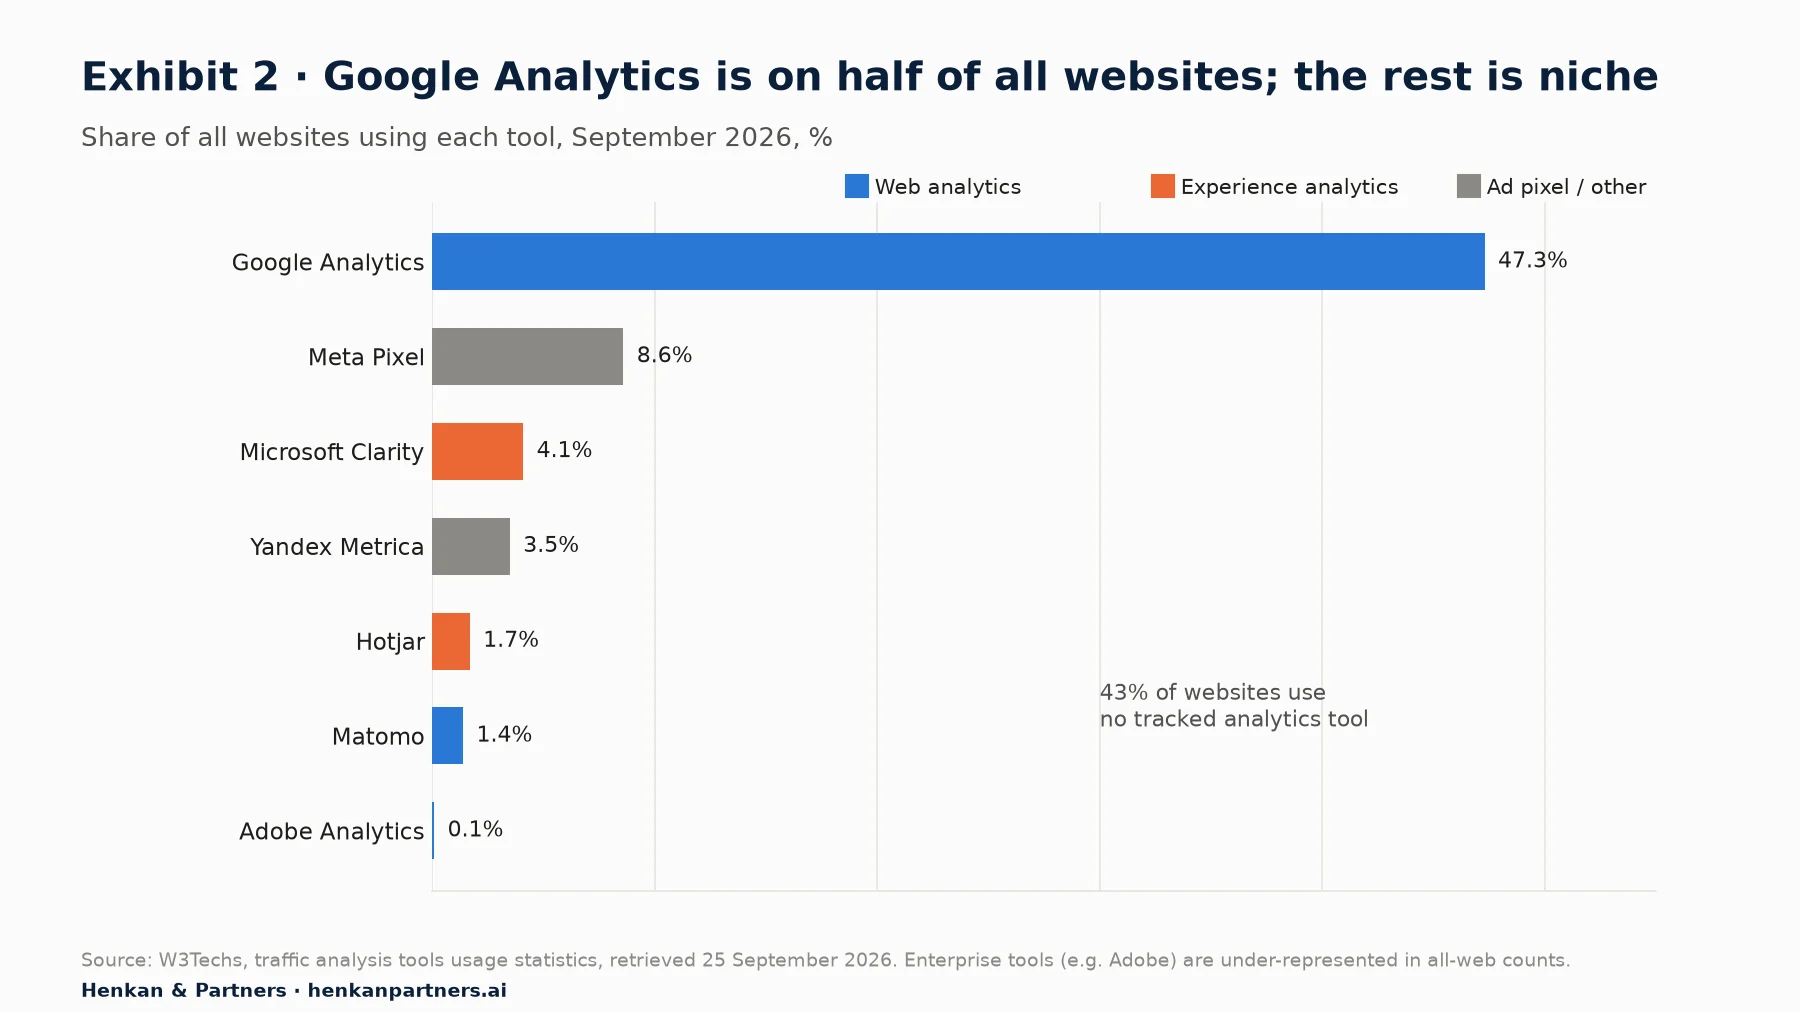
What this shows. Adoption and revenue point in opposite directions. Free tools dominate usage: Google Analytics runs on 47% of sites and 87% of sites in the top million that use any tracked tool. Microsoft Clarity is on more sites than Hotjar. Paid vendors win on the few thousand large companies that need depth, governance and support. Adobe's 0.1% of all sites understates a large enterprise business.
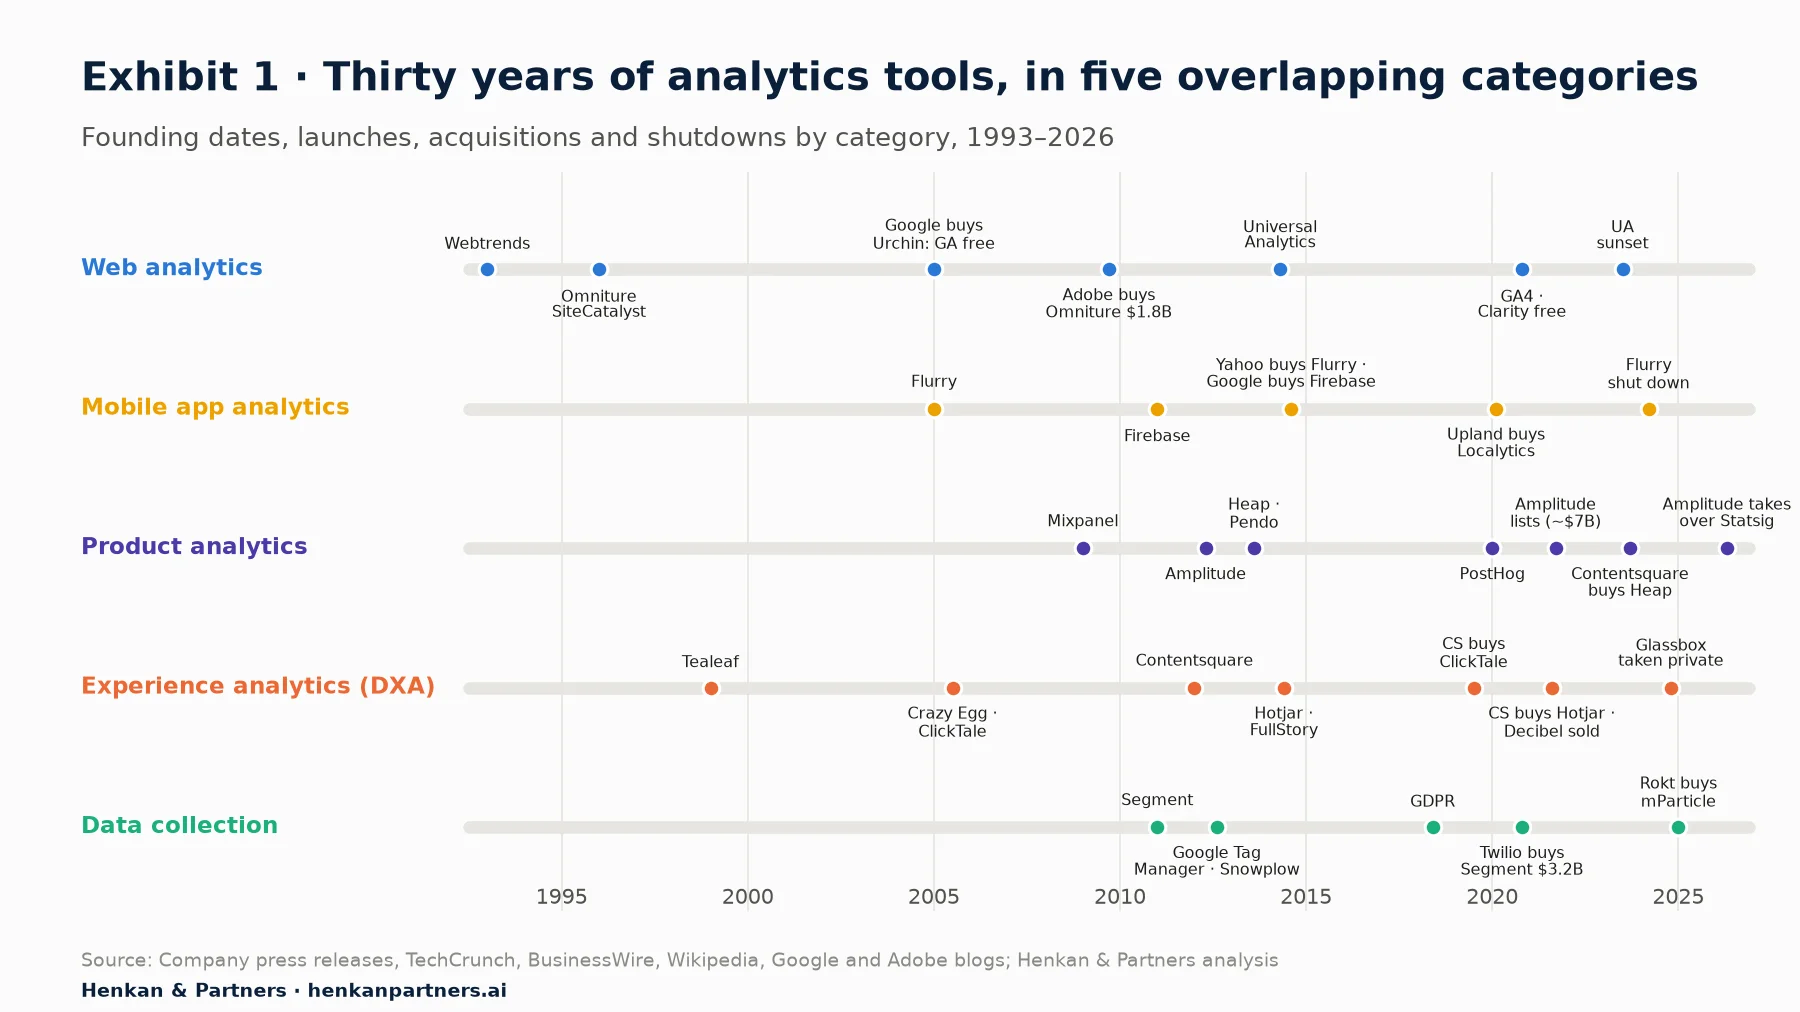
What this shows. Each category started when a new kind of question appeared: traffic in the 1990s, apps from 2005, product usage from 2009, on-screen behaviour from 2012 and data ownership from 2011. From 2019 the lanes converge, with acquisitions crossing category lines and free tools compressing the older layers.
Section 3 · 1993–2005
Log files and page tags created a paid enterprise market
The first tools read web-server log files. Webtrends (Portland, 1993) went public in February 1999 and was bought by NetIQ for about $1B in stock in 2001. JavaScript page tags then replaced logs. Omniture (Utah, 1996) built SiteCatalyst on them and listed on Nasdaq in 2006. Coremetrics (1999) raised more than $111M. AT Internet (Bordeaux, mid-1990s) became the French reference. Tealeaf (1999) pioneered recording user sessions for large banks and retailers, the first version of what is now experience analytics.
Why it happened. Companies moving sales online needed to know which pages and campaigns worked. Analytics was sold as enterprise software with implementation services, and priced on traffic volume.
Section 4 · 2005–2012
Google made web analytics free, and the suites bought the survivors
Google bought Urchin in March 2005 and launched Google Analytics for free in November 2005. The mid-market price of web analytics fell to zero almost overnight. In the same month that Google bought Urchin, Webtrends was sold to Francisco Partners for about $94M, less than a tenth of its 2001 value.
The paid vendors moved upmarket and consolidated into marketing suites:
- Omniture bought Visual Sciences (formerly WebSideStory) for $394M in 2008.
- Adobe bought Omniture for about $1.8B in 2009. SiteCatalyst became Adobe Analytics.
- IBM bought Coremetrics in 2010 and Tealeaf in 2012. Both went to Centerbridge Partners in 2019 as part of Acoustic.
Why it happened. Once basic reporting was free, paid tools had to sell what Google did not offer: unsampled data, custom data models, integration with advertising and content systems, and enterprise support. Only suites could fund that.
Why Google could give it away. Google does not need to make money from analytics. A free tool that shows advertisers which campaigns lead to sales encourages them to spend more on Google's advertising, which is where Google earns its revenue. For investors, this is the most important structural fact of the market: the largest competitor prices the entry-level product at zero because it profits elsewhere. Every paid vendor since 2005 has had to justify its price by doing something Google Analytics does not.
Section 5 · 2009–2019
Apps, SaaS products and user experience created three new categories
Smartphones and subscription software raised questions that pageview reports could not answer.
- Mobile app analytics: Flurry (2005) led the category and was bought by Yahoo in 2014 for a reported $200M or more. Google bought Firebase in 2014, launched Firebase Analytics free in 2016 and folded it into GA4.
- Product analytics: Mixpanel (2009), Amplitude (2012), Heap and Pendo (2013) tracked what identified users did over time: funnels, retention and cohorts. Mixpanel was valued at $865M in 2014; Amplitude at $4B in 2021.
- Experience analytics: ClickTale (2006), Contentsquare (2012), Hotjar and FullStory (2014) showed heatmaps, scroll depth and session replays. Hotjar grew to about $40M ARR without venture money.
- Data collection: Segment (2011), Snowplow (2012) and Google Tag Manager (2012) separated capturing data from analysing it, so one event stream could feed many tools.
Why it happened. Revenue moved from one-off visits to repeat use of apps and subscriptions, so companies needed user-level behaviour, not session counts. At the same time, conversion teams needed to see why users struggled, which numbers alone could not show.
Section 6 · 2019–2026
Privacy, consolidation and AI reshaped the market in six years
Four forces changed the market after 2019:
- Privacy. GDPR (2018), Apple's tracking prevention (from 2017), the French CNIL's February 2022 ruling that using Google Analytics breached GDPR, and consent requirements cut the data tools could collect. They pushed companies towards first-party, server-side collection.
- Google's reset. GA4 launched in October 2020 and Universal Analytics stopped processing data in July 2023. Every Google Analytics user had to migrate, and many large companies used the moment to re-evaluate their stack.
- Consolidation. Twilio bought Segment for $3.2B (2020). Contentsquare bought ClickTale (2019), Hotjar (2021) and Heap (2023). Medallia bought Decibel for about $160M (2021). Rokt bought mParticle for $300M (2025).
- The reset. Amplitude listed at about $7.1B in 2021 and is worth about $1.7B. Flurry was shut down in March 2024. Glassbox was taken private at a 70% discount to its IPO value. Cisco announced the end of Smartlook in March 2026.
AI arrived on top. Contentsquare launched its Sense AI agent in May 2025. Adobe released analytics agents in September 2025. Google added a Gemini-based Analytics Advisor to GA4 in December 2025. Mixpanel launched Mixpanel Headless for AI agents in May 2026, and Tealium released a managed MCP server in June 2026. Analytics is becoming something AI assistants query directly, not only something analysts read.
What this meant in practice. For a marketing team, the privacy changes meant that reports no longer covered all visitors. Visitors who decline cookies are missing or estimated, and Apple's Safari limits how long many cookies last (seven days for cookies set by page scripts), so returning visitors can be counted as new ones. GA4 also changed the basic unit of measurement from sessions to events, which is why many reports stopped matching year-on-year after the migration. For investors, these changes moved value towards whoever controls consent and first-party collection, and away from tools that relied on third-party cookies.
Section 7 · Crossovers
Every category is moving into its neighbours, and the boundaries are blurring
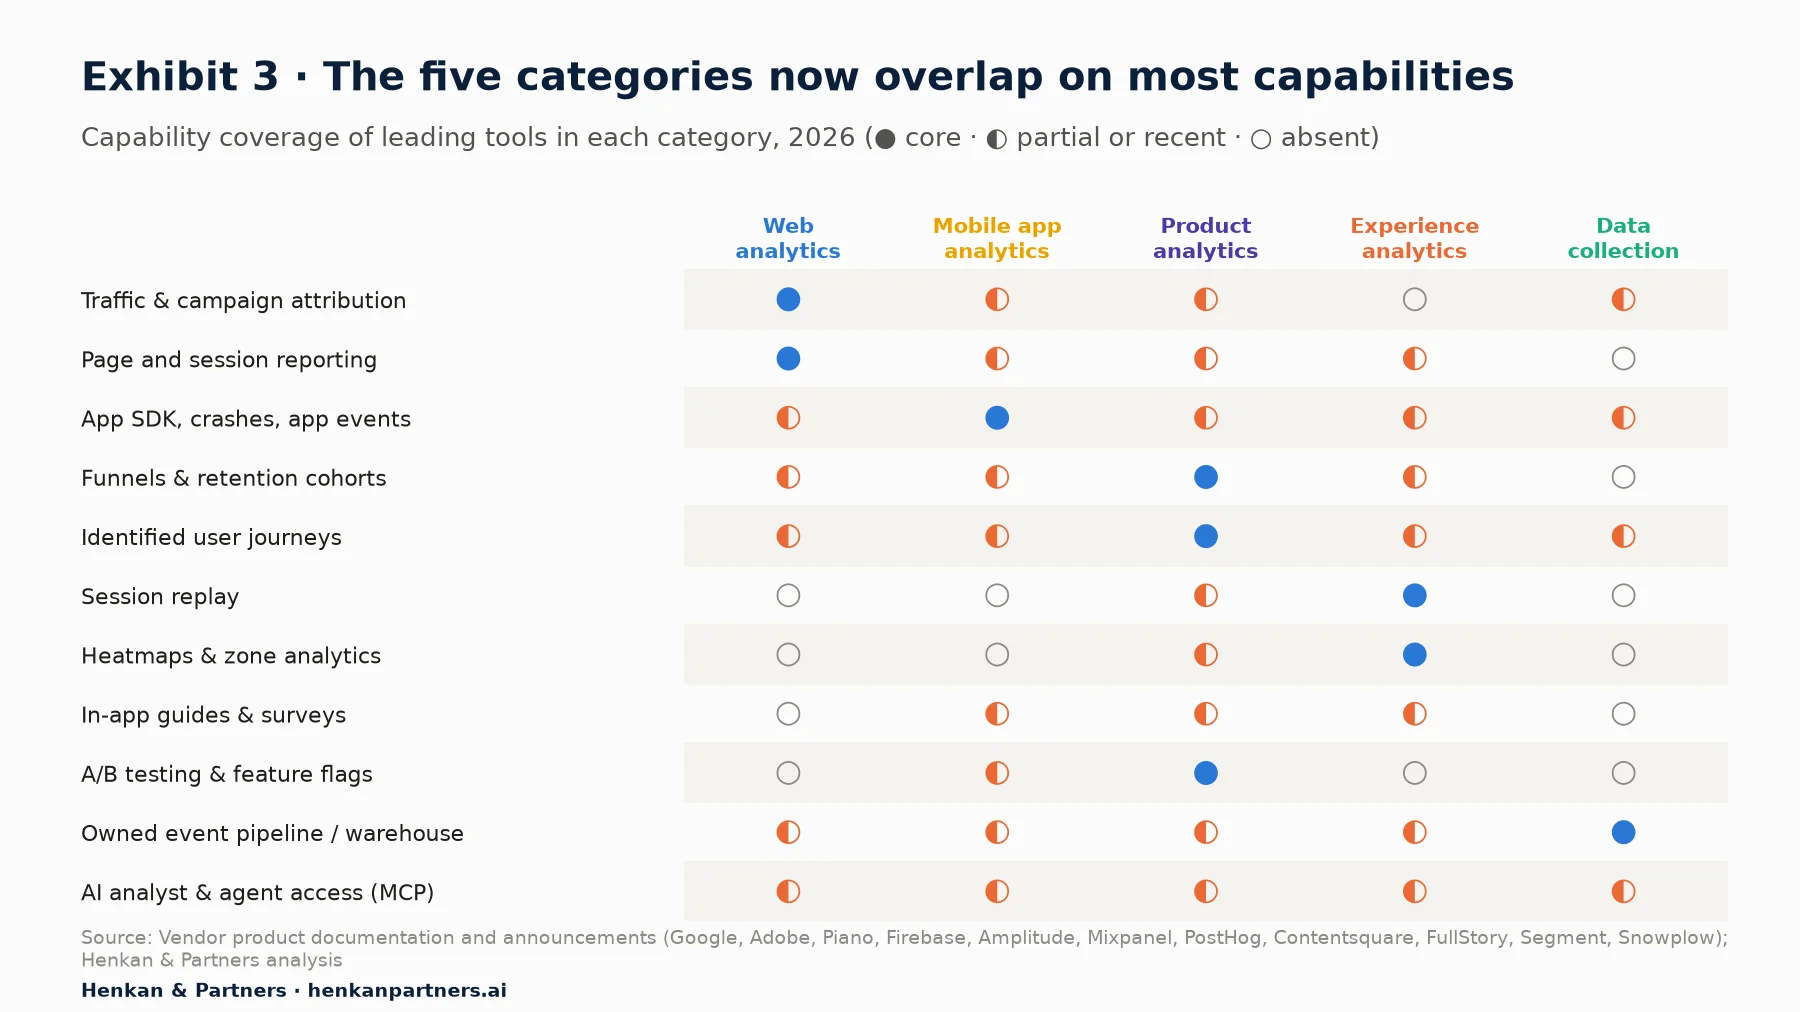
What this shows. Only a few cells are still exclusive. Session replay has spread from experience analytics into product analytics. Experimentation now sits inside product analytics. Every category now claims some AI analyst capability. The categories remain distinct in their core, but buyers increasingly get overlapping features from tools they already pay for.
The main crossover moves since 2020:
| From | Into | How |
|---|---|---|
| Web analytics | Mobile app analytics | GA4 merged web and app data on the Firebase model (2019–2020) |
| Experience analytics | Product analytics, feedback | Contentsquare bought Heap (2023) and Loris AI (2025) |
| Product analytics | Experience analytics | Mixpanel Session Replay generally available (2025); Amplitude and PostHog added replay and heatmaps |
| Product analytics | Experimentation, feedback | Amplitude took over Statsig's platform (2026) and bought Kraftful (2025); Mixpanel launched feature flags and experiments (2026) |
| Product analytics | In-app guidance | Pendo guides; Amplitude bought Command AI (2024) |
| Observability | Experience analytics | Dynatrace (2019) and Datadog (2021) added session replay |
| Free platforms | Experience analytics | Microsoft Clarity offered free heatmaps and replay from 2020 |
| Data collection | Analytics and AI | mParticle bought Indicative (2022); Snowplow launched Signals for AI applications (2025) |
Two patterns explain the moves. Vendors expand because a buyer's budget for one category is easier to grow than a new buyer is to win. And the most valuable question, why a customer converts or leaves, needs traffic, product and on-screen data together, which no single category holds.
What this means for marketers. Before buying a new tool, check what your current contracts already include. Many product analytics plans now include session replay, and many include experimentation. One budget line can often cover two needs. The reverse risk is paying twice for the same feature from two vendors.
What this means for investors. When a neighbouring vendor bundles a feature for free or at a low extra price, the standalone vendor's market shrinks, even if its product is better. In due diligence, check how many of a target's customers also use a tool that now offers the same feature, and whether the target owns something bundlers cannot easily copy: customer identity, a proprietary dataset or deep enterprise integrations.
Section 8 · Limits
Each category starts and stops at a different point in the customer journey, and each has a structural blind spot
| Category | Where it starts | Where it stops | Structural limitations | Pressure in 2026 |
|---|---|---|---|---|
| Web analytics | The first visit and the campaign that drove it | At the anonymous session. It rarely follows a known customer over months or explains why they behaved as they did. | Consent loss and cookie limits remove a large share of visits; sampling and modelled data in GA4; standard data models | Free Google tools cap prices; privacy rules and AI summaries reduce time spent in reports |
| Mobile app analytics | App install and SDK events | At the edge of the app. Web journeys and offline sales sit elsewhere. | Depends on app-store and OS privacy rules (Apple's App Tracking Transparency); SDK weight | Largely absorbed into GA4 and Firebase; Flurry shut down in 2024 |
| Product analytics | A known user's first meaningful action | At acquisition and at the "why". It is weaker on marketing channels and cannot show what the user saw. | Needs a tracking plan and disciplined event naming; value decays when tracking breaks | Seat-based pricing challenged by AI agents; warehouse-native rivals |
| Experience analytics | The click, scroll and hesitation on a page or screen | At the page. It is weaker on long-term retention, revenue and cross-channel journeys. | Storing sessions is costly; privacy masking of personal data; hard to turn many recordings into decisions | Free Clarity and product analytics replay take the entry level; AI summaries of sessions become standard |
| Data collection | The raw event at the source | Before insight. It moves and governs data but does not analyse it. | Requires engineering; value only visible through the tools it feeds | Cloud warehouses and tag managers offer basic pipelines; consent and server-side tracking raise its importance |
The gaps matter more than the features. A retailer that sees a conversion drop in Google Analytics must switch to product analytics to see which customers changed behaviour, then to experience analytics to see what they struggled with. Each switch loses identity, definitions and time. That friction is the market's main opportunity. Whoever joins the layers, with consistent customer identity and metric definitions, captures the value.
Which tool answers which question
For teams choosing where to look first, a simple rule is to start from the question, not the tool:
- "Where do our visitors come from, and which campaigns pay off?" Web analytics.
- "Why do visitors leave this page or fail at checkout?" Experience analytics: heatmaps, replays and error tracking.
- "Which customers come back, and what do they do differently?" Product analytics: cohorts, retention and user journeys.
- "Is our app stable and are people installing it?" Mobile app analytics.
- "Can we trust the numbers, and are we allowed to collect them?" The data collection layer: tag management, consent and a customer data platform.
Most real questions need two of these together. A drop in conversion is spotted in web analytics, explained with experience analytics and sized with product analytics.
Section 9 · Deals and investors
Investors paid most for data infrastructure and the one successful roll-up
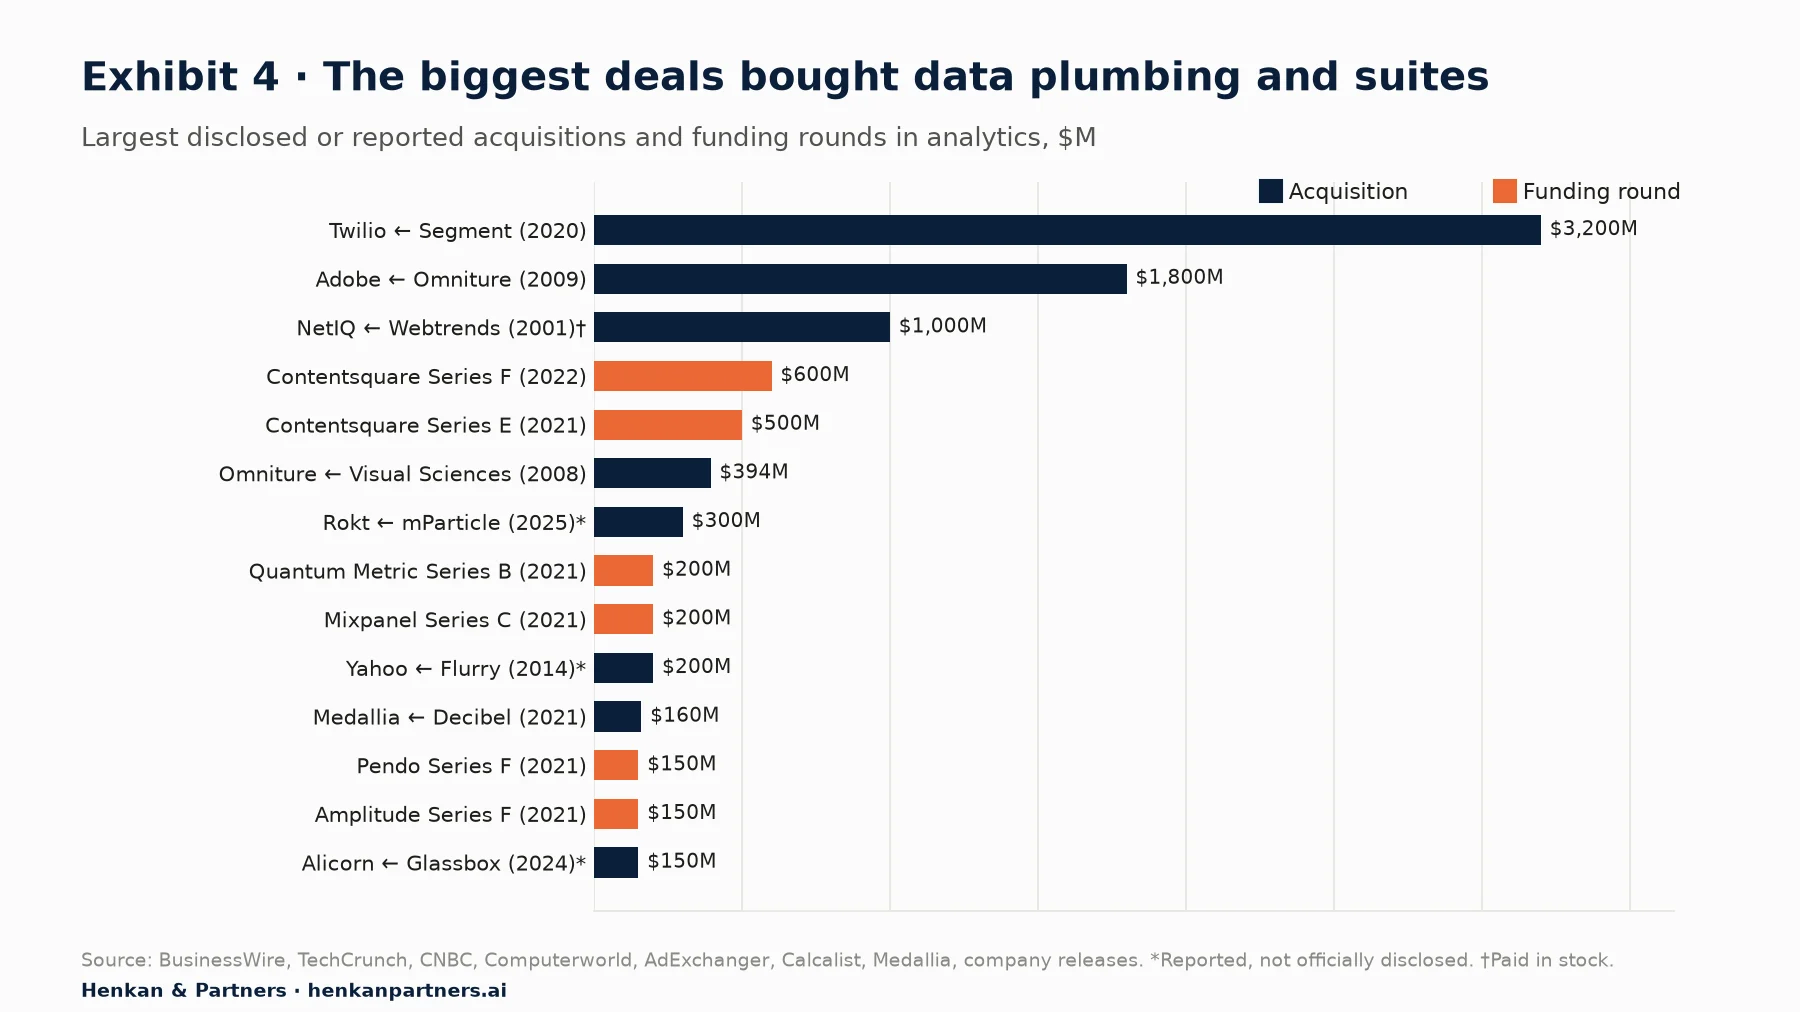
What this shows. The two largest transactions bought a data pipeline (Segment) and a suite (Omniture). Contentsquare's two rounds of $500M and $600M financed the only large consolidation of experience analytics. Most other deals sit below $400M.
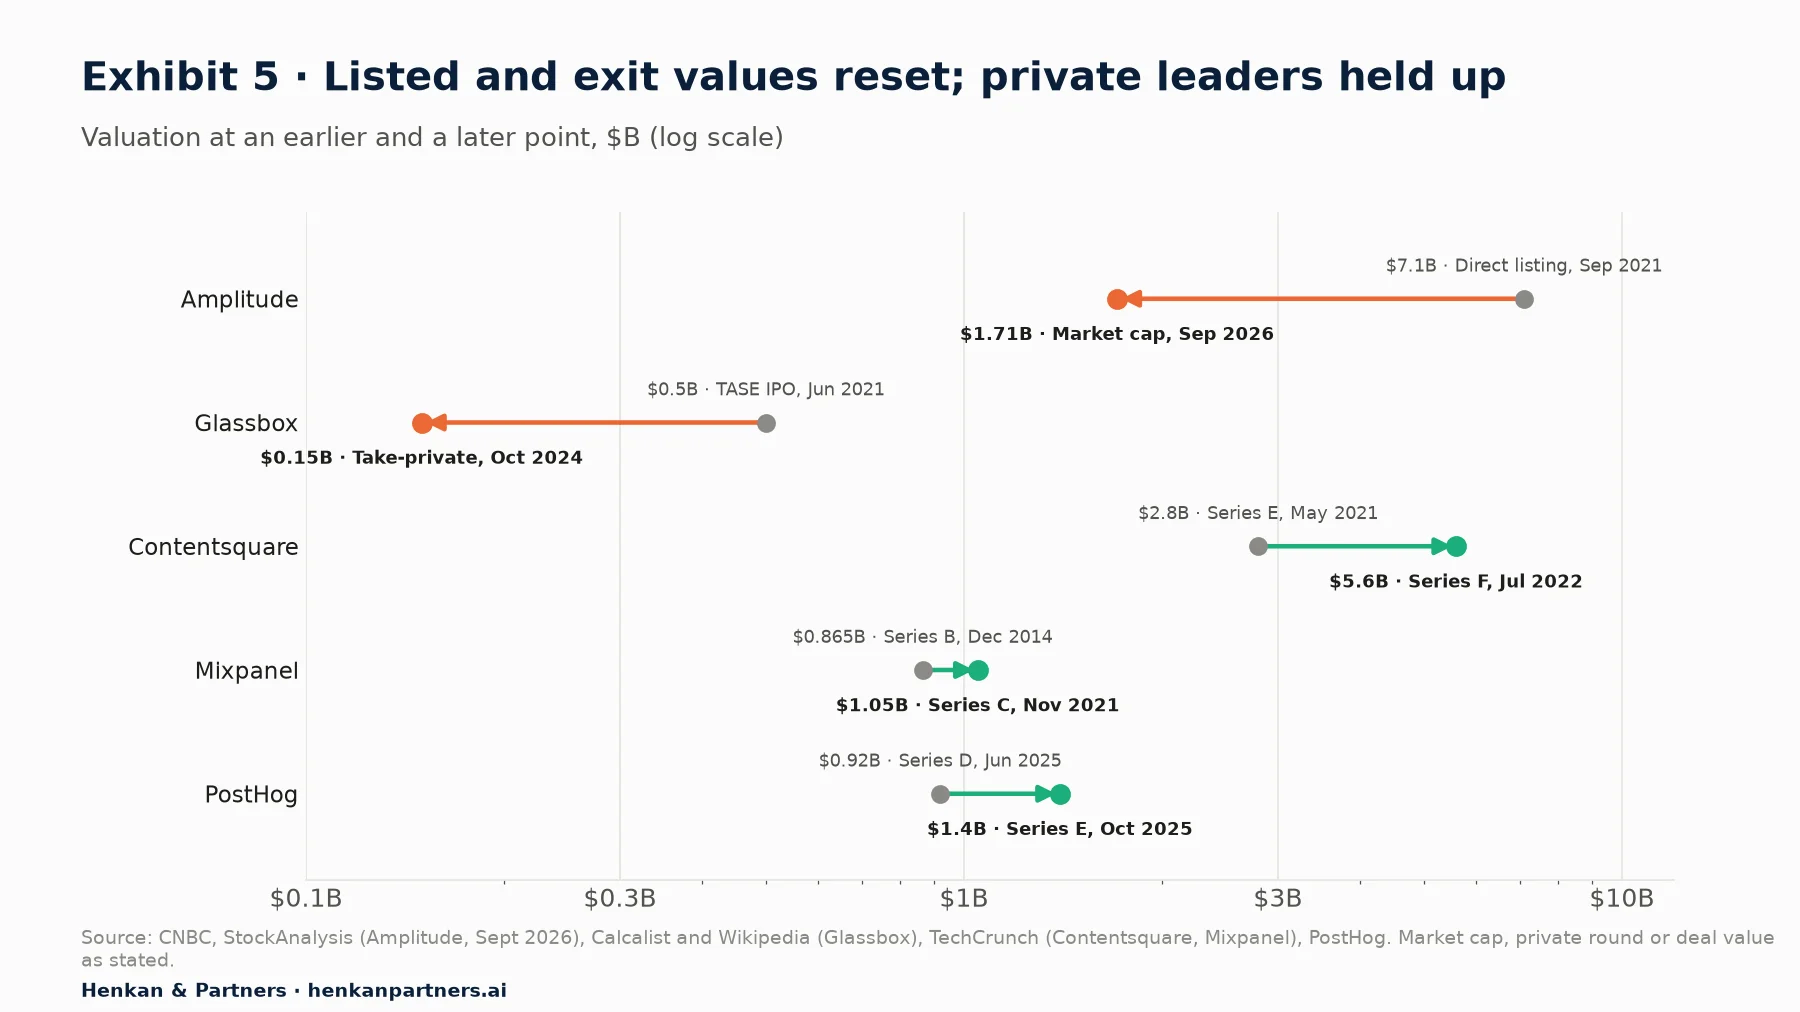
What this shows. The two companies that tested public markets, Amplitude and Glassbox, lost 70–76% of their listing value. Private leaders last priced in 2021–2022 still carry those valuations, which have not been tested since. PostHog, the fastest-growing newcomer, raised at a higher value in 2025. The gap between listed and private marks is where future deals will be negotiated.
Why valuations fell after 2021
In 2021, with interest rates close to zero, investors paid high multiples for software companies that were growing fast, even if they were not yet profitable. When rates rose from 2022, future profits became worth less in today's money, and investors began to value current profitability more. Software multiples fell across the board. Analytics vendors were hit a second time, because slower growth followed as companies cut tool budgets and free tools improved.
A private company's valuation only changes when it raises money or is sold. That is why Contentsquare, FullStory or Quantum Metric can still carry their 2021–2022 valuations on paper while Amplitude, which is priced every day on the stock market, reflects today's conditions. When those private companies next raise or sell, the gap will have to close, either through growth or through a lower price (a "down round").
| Company | Category | Key investors | Owner, Sept 2026 |
|---|---|---|---|
| Contentsquare | Experience analytics | Eurazeo, BlackRock, KKR, SoftBank Vision Fund 2, Sixth Street | Independent (private) |
| Amplitude | Product analytics | Sequoia, GIC, Battery, IVP | Listed on Nasdaq |
| Mixpanel | Product analytics | Andreessen Horowitz, Bain Capital Tech Opportunities | Independent |
| Pendo | Product analytics | B Capital, Silver Lake Waterman | Independent |
| PostHog | Product analytics | Y Combinator, GV, Stripe, Peak XV | Independent |
| FullStory | Experience analytics | Kleiner Perkins, GV, Permira | Independent |
| Quantum Metric | Experience analytics | Insight Partners | Independent |
| Glassbox | Experience analytics | TASE listing (2021) | Alicorn (taken private, 2024) |
| Decibel | Experience analytics | — | Medallia, owned by Thoma Bravo |
| Piano (AT Internet) | Web analytics | Updata (majority since 2019), Sixth Street, LinkedIn | Updata-backed |
| Segment | Data collection | Venture-backed ($175M Series D, 2019) | Twilio |
| Tealeaf, Coremetrics | Experience / web analytics | — | Acoustic, owned by Centerbridge |
Section 10 · Private equity outlook
Private equity has five ways to create value, and the best ones sit between the categories
Financial investors are already active. Francisco Partners bought Webtrends in 2005, Updata has controlled Piano since 2019, Centerbridge formed Acoustic in 2019, Thoma Bravo took Medallia private for $6.4B in 2021 (after Medallia bought Decibel), and Alicorn took Glassbox private in 2024. Growth investors such as Sixth Street, Permira, Insight Partners and Bain Capital Tech Opportunities hold positions in Contentsquare, Heap, FullStory, Quantum Metric and Mixpanel. The category suits them: revenue is recurring, tools are embedded in websites and apps, and many vendors are mid-sized and profitable. The limit is growth. With free tools capping the entry level, returns depend on consolidation and repositioning.
Based on the evidence in this article, we see five strategies open to financial investors over the next three to five years. They are our reading of the market, not reported plans of any firm.
| Strategy | Investment logic | Precedent or candidates by profile | Main risk |
|---|---|---|---|
| 1. Consolidate experience analytics | Merge mid-sized DXA vendors to share storage and AI costs and sell to more enterprise accounts | Contentsquare's roll-up is the template. The independent mid-market (FullStory, Quantum Metric, LogRocket, Mouseflow) was last valued in 2021–2022. | Free replay from Clarity and product analytics vendors erodes the entry level |
| 2. Take listed vendors private | Buy public analytics companies trading at low revenue multiples and run them for cash and bolt-ons | Glassbox (2024). A listed vendor at about 4x ARR fits this profile. | Growth reinvestment competes with margin targets |
| 3. Carve out neglected assets | Buy analytics products that corporate owners no longer prioritise | Flurry (shut 2024) and Smartlook (end of life 2026) show corporate owners exit; activists pushed Twilio to sell Segment in 2023–24 | Underinvested technology and customer churn |
| 4. Combine analytics, experimentation and feedback | Build one "measure, test, listen" platform so customers buy the loop, not three tools | Amplitude–Statsig–Kraftful, Contentsquare–Loris, Mixpanel experiments | Integration is slow; buyers keep best-of-breed tools |
| 5. Back European, privacy-first analytics | Serve companies that need EU data residency and consent-proof measurement | Piano's CEO said in 2025 it could seek a new sponsor; Matomo, Commanders Act and Eulerian are small and focused | Smaller addressable market; Google improves its EU compliance |
How each strategy creates value
Private equity returns come from three sources: growing revenue, improving margins, and selling at a higher multiple than the purchase price. Each strategy relies on a different mix.
- Consolidating experience analytics relies mainly on cost savings and multiple expansion. Several mid-sized vendors each pay for their own data storage, AI development and sales teams. Combined, they share those costs, and the larger company sells for a higher multiple than its parts because buyers pay more for scale, a broader product and a more diversified customer base.
- Taking listed vendors private relies on buying at a low multiple. A company trading at about 4x revenue can be run for profit away from quarterly market pressure, then grown with bolt-on acquisitions and sold when conditions improve.
- Carve-outs rely on operational improvement. A product neglected by a large owner often has loyal customers but outdated technology and no dedicated sales team. A focused owner can invest, reprice and restart growth.
- Combining analytics, experimentation and feedback relies on cross-selling. A customer who already sends its data to an analytics tool can add testing or surveys at little extra cost, which raises revenue per customer and makes the platform harder to replace.
- Backing European, privacy-first vendors relies on regulation-driven demand. Public-sector bodies, banks, insurers and healthcare companies in Europe increasingly need data to stay in the EU, and will pay a premium for tools that guarantee it.
What to check in due diligence
Analytics companies share a few specific risks that general software diligence can miss:
- Net revenue retention. Above 110% signals a product customers expand into; below 100% often means customers are downgrading to free or bundled alternatives.
- Gross margin after data costs. Session recordings and event storage are expensive. Check how margin moves as customers' traffic grows, and whether pricing follows volume.
- Revenue exposed to free tools. Estimate the share of customers who use only features that Google Analytics, Microsoft Clarity or a bundled product analytics tool now offer for free.
- Pricing model. Seat-based pricing is at risk if AI assistants replace analysts; pricing on data volume or usage is more resilient.
- Privacy and consent exposure. Check dependence on third-party cookies, data transfers outside the EU and past regulatory rulings.
- Depth of installation. Tracking code across many sites, apps and data pipelines is a real switching cost; a tool that can be replaced by changing one tag is not.
- Customer concentration and segment. Enterprise customers pay more and stay longer, but a few large accounts can dominate revenue.
Exit routes
The most valuable exits have been sales to platforms that want analytics next to their core product: Adobe for its marketing suite, Twilio for customer engagement and Rokt for commerce media. The next buyers are likely to include cloud data platforms, observability companies and AI companies, following Datadog's and OpenAI's purchases in experimentation in 2025. Secondary buyouts suit roll-ups once they reach scale. Public listings have been the weakest route: Amplitude is the only product analytics company to list, and Glassbox's listing ended in a take-private.
Risks investors will price in
- Free floors. Google Analytics and Microsoft Clarity keep the entry level at zero, and platforms can add features for free.
- AI and seats. If AI agents answer questions directly, seat-based pricing for analysts shrinks, and value moves to data access and usage.
- Privacy rules. Consent requirements and data transfer rulings can remove data or products at short notice.
- Data costs. Session recordings and event volumes grow faster than prices, squeezing margins unless storage moves to the customer's warehouse.
Section 11 · Where value goes next
We expect the most value in owned data, warehouse-native metrics and behavioural data for AI
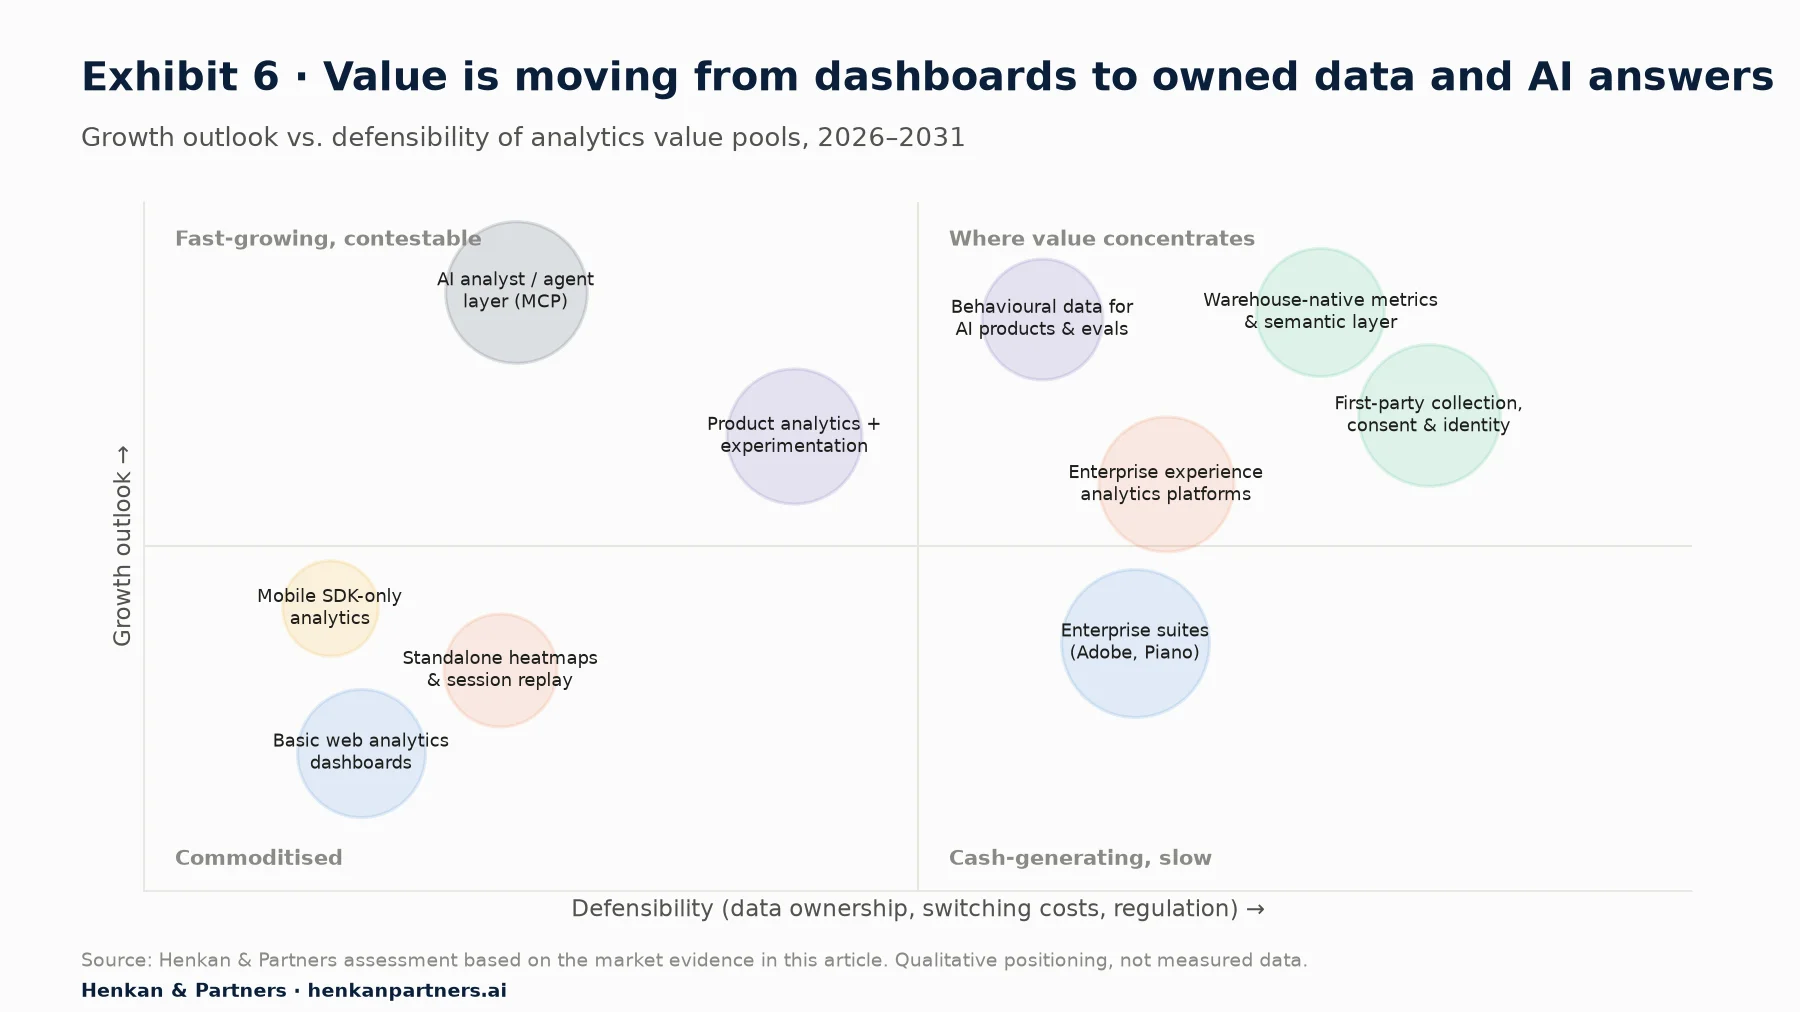
Where value concentrates
- First-party collection, consent and identity. As cookies and third-party tracking weaken, the company that captures clean, consented, server-side data owns the input to everything else. This layer is hard to replace once installed.
- Warehouse-native metrics and a shared semantic layer. Companies want one definition of conversion, revenue and churn across all tools. Analytics that runs on the customer's own warehouse avoids duplicated data and conflicting numbers.
- Behavioural data for AI products. AI assistants, recommendations and agents need real-time behavioural signals and evaluation data. Snowplow's Signals and OpenAI's purchase of Statsig show this demand is real.
- Enterprise experience analytics platforms that combine replay, product data and feedback with AI summaries, sold to large digital businesses where each percentage point of conversion is worth millions.
Where value erodes
- Standard web dashboards, already free and increasingly replaced by AI summaries.
- Standalone heatmaps and session replay, now bundled free in Clarity and in product analytics tools.
- SDK-only mobile analytics, absorbed by Firebase and GA4.
The contested middle
The AI analyst layer grows fastest but is the least defensible. Every vendor, Google, Adobe and the AI model companies can offer a conversational analyst on top of the same data. Its value will flow to whoever owns trusted data and definitions underneath, not to the interface itself. In short: value shifts from showing data to owning, defining and acting on it.
What this means for investors. Favour companies that own the data input (collection, consent and identity) or the shared definitions of metrics, since AI interfaces and dashboards are built on top of them. Be cautious with vendors whose main product is a report or a heatmap: their features are the easiest to copy, bundle or give away.
What this means for marketers. The skills that gain value are the ones beneath the dashboard: a clean tracking plan, a consent set-up that keeps as much measurable traffic as the law allows, and agreed definitions of each key metric. These make every tool, including future AI assistants, more accurate.
Section 12 · Implications
Buyers should design the stack around data ownership, not around tools
These five recommendations are written for marketing, e-commerce and product teams that choose or renew analytics tools. They also serve as a checklist for investors assessing how a portfolio company's own analytics are set up.
1. Own the collection layer
Capture events once, server-side and with consent, and send them to the tools you use. Changing an analytics tool is then a configuration change, not a new implementation.
2. Define metrics once
Agree definitions for conversion, revenue and retention in your warehouse or semantic layer, and make every tool use them.
3. Use free tools where they are enough
For standard traffic reporting and basic heatmaps, Google Analytics and Microsoft Clarity are sufficient for most sites. Pay for depth where it creates value: product behaviour, enterprise experience analysis and governance.
4. Check who owns your vendor
Several tools in this market were shut down, merged or sold in the last three years. Ask about roadmap commitments, data export and pricing protection before signing multi-year contracts.
5. Prepare for AI analysts
AI assistants will query analytics directly. The companies that benefit will be those with clean, well-named events and documented metrics, not those with the most dashboards.
FAQ
Frequently asked questions about the analytics tool market
Frequently asked questions
What is the difference between web analytics and product analytics?
Web analytics measures traffic: where visitors come from, which pages they view and which campaigns convert, usually at the level of anonymous sessions. Product analytics follows identified users over time to show which behaviours drive activation, retention and revenue. Google Analytics is the reference in web analytics; Amplitude, Mixpanel and PostHog lead product analytics.
What is digital experience analytics (DXA)?
Digital experience analytics shows how users interact with a page or screen through heatmaps, scroll maps, zone analytics and session replays, to explain why they struggle or leave. Contentsquare (which owns Hotjar), FullStory, Quantum Metric and Glassbox are the main vendors, and Microsoft Clarity offers a free version.
How big is the digital analytics market?
Published estimates for 2025–2026 put web analytics at $6.3–9.2B, product analytics at $10.6–25.9B and customer data platforms at $4.1–10.5B, but the definitions overlap and cannot be added. Actual vendor revenues are much smaller: Amplitude, the largest listed pure play, expects about $410M in 2026. We estimate paid analytics software outside Google and Adobe at a few billion dollars a year.
Who owns Hotjar and Heap?
Contentsquare owns both. It bought Hotjar in 2021 and Heap in 2023, as part of eight acquisitions since 2019 that also include ClickTale and Loris AI.
Why is private equity interested in analytics software?
Analytics tools have recurring revenue, are embedded in websites and apps, and many vendors are mid-sized and profitable. Investors such as Thoma Bravo, Centerbridge, Updata and Alicorn already own analytics assets. The main strategies are consolidating experience analytics, taking listed vendors private, carving out neglected products, combining analytics with experimentation, and backing privacy-first European vendors.
Where will value be in analytics over the next five years?
We expect value to concentrate in first-party data collection and consent, warehouse-native metrics shared across tools, and behavioural data that feeds AI products. Standard dashboards, standalone heatmaps and SDK-only mobile analytics will keep losing pricing power to free tools and AI summaries.
Rethinking your analytics stack?
Henkan & Partners runs vendor-neutral analytics audits, tool selections and migrations, from data collection to product and experience analytics.
Key terms
| Term | What it means | Why it matters here |
|---|---|---|
| Event | One recorded action by a user: a page view, a click, an add-to-cart, a purchase, with details such as product and price. | Every modern analytics tool is built on events. Poorly named or missing events make the data unusable, whatever the tool. |
| Session | A group of events from one visit, usually closed after 30 minutes of inactivity. | Web analytics mostly counts sessions; product analytics counts people. That difference defines the two categories. |
| Tag / SDK | A small piece of code on a website (a JavaScript tag) or inside an app (a software development kit) that sends events to a tool. | Every tool needs its own code installed. Once installed across a site, it is costly to remove, which creates switching costs. |
| Tag manager | A tool that lets marketers add, change and remove tags without a new release of the site (Google Tag Manager, Tealium, Commanders Act). | It controls which tools receive data, so it sits at a strategic point in the stack. |
| First-party data | Data a company collects directly from its own visitors and customers, on its own site or app. | It survives cookie restrictions better than data gathered by third parties, and it is becoming the main asset in analytics. |
| Server-side tracking | Sending events from the company's own server rather than from the visitor's browser. | It is more reliable, less affected by ad blockers and browser limits, and lets the company control what each vendor receives. |
| Consent | The permission European rules (GDPR and the ePrivacy rules) require before most tracking. Visitors who refuse are not measured, or are only estimated. | Consent rates set how much of the traffic any tool can see. Tools that work well with partial consent gain an advantage. |
| Customer data platform (CDP) | Software that collects events from all channels, links them to one customer profile and sends them on to other tools (Segment, mParticle, Tealium). | It is the data collection layer in this report and the target of the largest deal ($3.2B for Segment). |
| Funnel | A sequence of steps, such as product page, cart, checkout and purchase, with the share of users who complete each step. | The most common analysis in both web and product analytics. |
| Cohort and retention | A cohort is a group of users who started in the same period. Retention is the share of them who come back later. | The core output of product analytics, and the metric subscription businesses are valued on. |
| Heatmap and session replay | A heatmap shows where visitors click and how far they scroll on a page. A session replay rebuilds one visit, like a video. | The core outputs of experience analytics, and now offered free by Microsoft Clarity. |
| Data warehouse, warehouse-native | A warehouse is a company's central database (for example Snowflake, BigQuery or Databricks). A warehouse-native tool analyses data where it already sits, instead of copying it. | It lowers cost and keeps one version of the truth. It threatens vendors whose value is storing data. |
| Semantic layer | A shared set of metric definitions, such as what counts as an active user or a conversion, used by every tool. | It ends "two tools, two numbers" debates, and AI assistants need it to answer correctly. |
| ARR | Annual recurring revenue: the yearly value of subscription contracts in force. | The main measure of size for software companies, and the basis of most valuations. |
| Revenue multiple | A company's value divided by its revenue or ARR. Amplitude at about $1.7B with about $410M of revenue trades at about 4x. | The simplest way to compare prices across deals. High growth and high retention justify higher multiples. |
| Net revenue retention (NRR) | This year's revenue from last year's customers, divided by what they paid last year. Above 100% means existing customers are spending more. | The most watched due-diligence metric for software: it shows whether the product becomes more or less essential over time. |
| Take-private | An investor buys all the shares of a listed company and removes it from the stock market. | Used when a listed company trades at a low value relative to what a private owner could make of it (Glassbox, 2024). |
| Carve-out | Buying a division or product line from a larger company that no longer sees it as core. | Large owners have shut or neglected analytics products (Flurry, Smartlook), which creates buying opportunities. |
| Roll-up, platform and bolt-on | A roll-up builds a larger company by buying several smaller ones. The first, larger company is the platform; each smaller purchase added to it is a bolt-on. | Contentsquare's eight acquisitions are the category's clearest roll-up. |
| Secondary buyout | One private equity fund sells a company to another. | A common exit for roll-ups that have grown too large for their first owner but are not ready to list. |
Methodology & sources
Deal values are those disclosed by the parties or reported by named outlets; reported figures are marked. Market-size estimates are publisher summary figures and were not independently audited. Adoption figures are from W3Techs and cover all websites. The value-pool map (Exhibit 6) and private equity strategies are Henkan & Partners analysis, not reported plans of any firm and not investment advice. Research completed 26 September 2026.
- Google Analytics history · GA4 launch, Oct 2020
- Google: Analytics Advisor, Dec 2025
- Omniture history and Adobe acquisition · Omniture buys Visual Sciences, $394M
- Adobe AI agents, Sept 2025
- Webtrends IPO, 1999 · NetIQ buys Webtrends · Francisco Partners buys Webtrends
- IBM buys Coremetrics · IBM buys Tealeaf · Acoustic formed
- Piano acquires AT Internet · Piano funding and recap signal
- Yahoo buys Flurry · Flurry shutdown · Google acquires Firebase · Upland buys Localytics
- Mixpanel Series B · Mixpanel Series C · Mixpanel Headless
- Amplitude direct listing · Amplitude Q2 2026 results · Amplitude and Statsig
- Heap Series D · Contentsquare completes Heap acquisition
- Pendo Series F · PostHog Series D
- Contentsquare Series D · Series E · Series F · Sense AI agent · Loris AI
- FullStory Series D · Quantum Metric Series B
- Glassbox taken private · Medallia to acquire Decibel · Thoma Bravo completes Medallia
- Cisco: Smartlook end of life · Microsoft Clarity generally available
- Twilio to acquire Segment · Twilio review of Segment · Rokt acquires mParticle · Snowplow Signals
- CNIL ruling on Google Analytics
- W3Techs traffic analysis tools
- Market estimates: Fortune BI web analytics · Mordor web analytics · Grand View product analytics · Fortune BI product analytics · Credence session replay · CDP industry statistics