Guide
The Essential Guide to E-commerce Acquisition and Retention Channels
Alexandre Suon · 2026-09-27
Every online shop grows through two engines: channels that bring new customers and channels that bring them back. This guide explains each acquisition and retention channel in e-commerce, what it costs, how to measure what it really adds, and how to build a channel mix that grows revenue and customer lifetime value, for teams of every size.
Executive summary
- Growth depends on two engines, and in Henkan & Partners' experience most shops overinvest in the first. Acquisition channels (search, social, marketplaces, affiliates, SEO, AI assistants) bring new customers; retention channels (email, SMS, loyalty, subscriptions, the experience itself) bring them back. Shopify reports that repeat customers make up 21% of customers but generate 44% of revenue.
- Paid acquisition is getting more expensive and more concentrated. US digital advertising reached $294.6 billion in 2025, and social media overtook search as the largest format. Meta's average price per ad rose 12% year on year in the second quarter of 2026. WPP Media estimates that Alphabet, Meta and Amazon control 57.6% of the advertising market outside China.
- Search is changing fast. When a Google AI summary appears, Pew Research found that users click a traditional result in 8% of visits, against 15% without one. AI assistants send only 0.2% of traffic today, but that traffic grew more than sevenfold in 2025, and Google now lets US shoppers check out with some retailers without leaving AI Mode.
- Retention channels are cheap to run but easy to misread. Automated emails such as welcome and abandoned-cart flows earn about 18 times more revenue per recipient than campaigns in Klaviyo's 2026 data. But open rates are unreliable since Apple's privacy changes, and attributed revenue includes sales that would have happened anyway.
- Attribution flatters every channel; experiments tell you what each one adds. In Facebook's own field experiments, standard measurement methods often overstated the effect of ads, in one case estimating a lift of 1,306% when the true lift was 2.4%. At eBay, brand search ads had "no measurable short-term benefits".
- The right mix depends on your margins, your repeat rate and your team. Start with the channels where your customers already are, measure contribution after marketing costs rather than platform ROAS, test incrementality on your biggest budgets, and invest in the customer experience that makes every channel work harder.
An e-commerce acquisition channel is any route through which a new customer first finds and buys from your shop, such as search ads, social media, marketplaces or SEO. A retention channel is any route that brings an existing customer back to buy again, such as email, SMS, loyalty programmes or subscriptions. Many channels do both.
Section 1 · The basics
Every e-commerce channel either brings new customers, brings them back, or both
Marketers usually group channels in two ways. The first is by who pays: paid channels (you pay per click, impression or sale), owned channels (you control them: website, email, SMS, app) and earned channels (others choose to send you visitors: search rankings, press, reviews, word of mouth, AI answers). The second is by job: acquisition channels win a first purchase, retention channels win the next ones.
The two views matter together. Paid channels are the fastest way to acquire, but you rent the audience and pay again for every visit. Owned channels are the cheapest way to retain, but they only work once someone has given you their email address, phone number or loyalty membership. Earned channels compound slowly and are hard to control, but they cost nothing per visit.
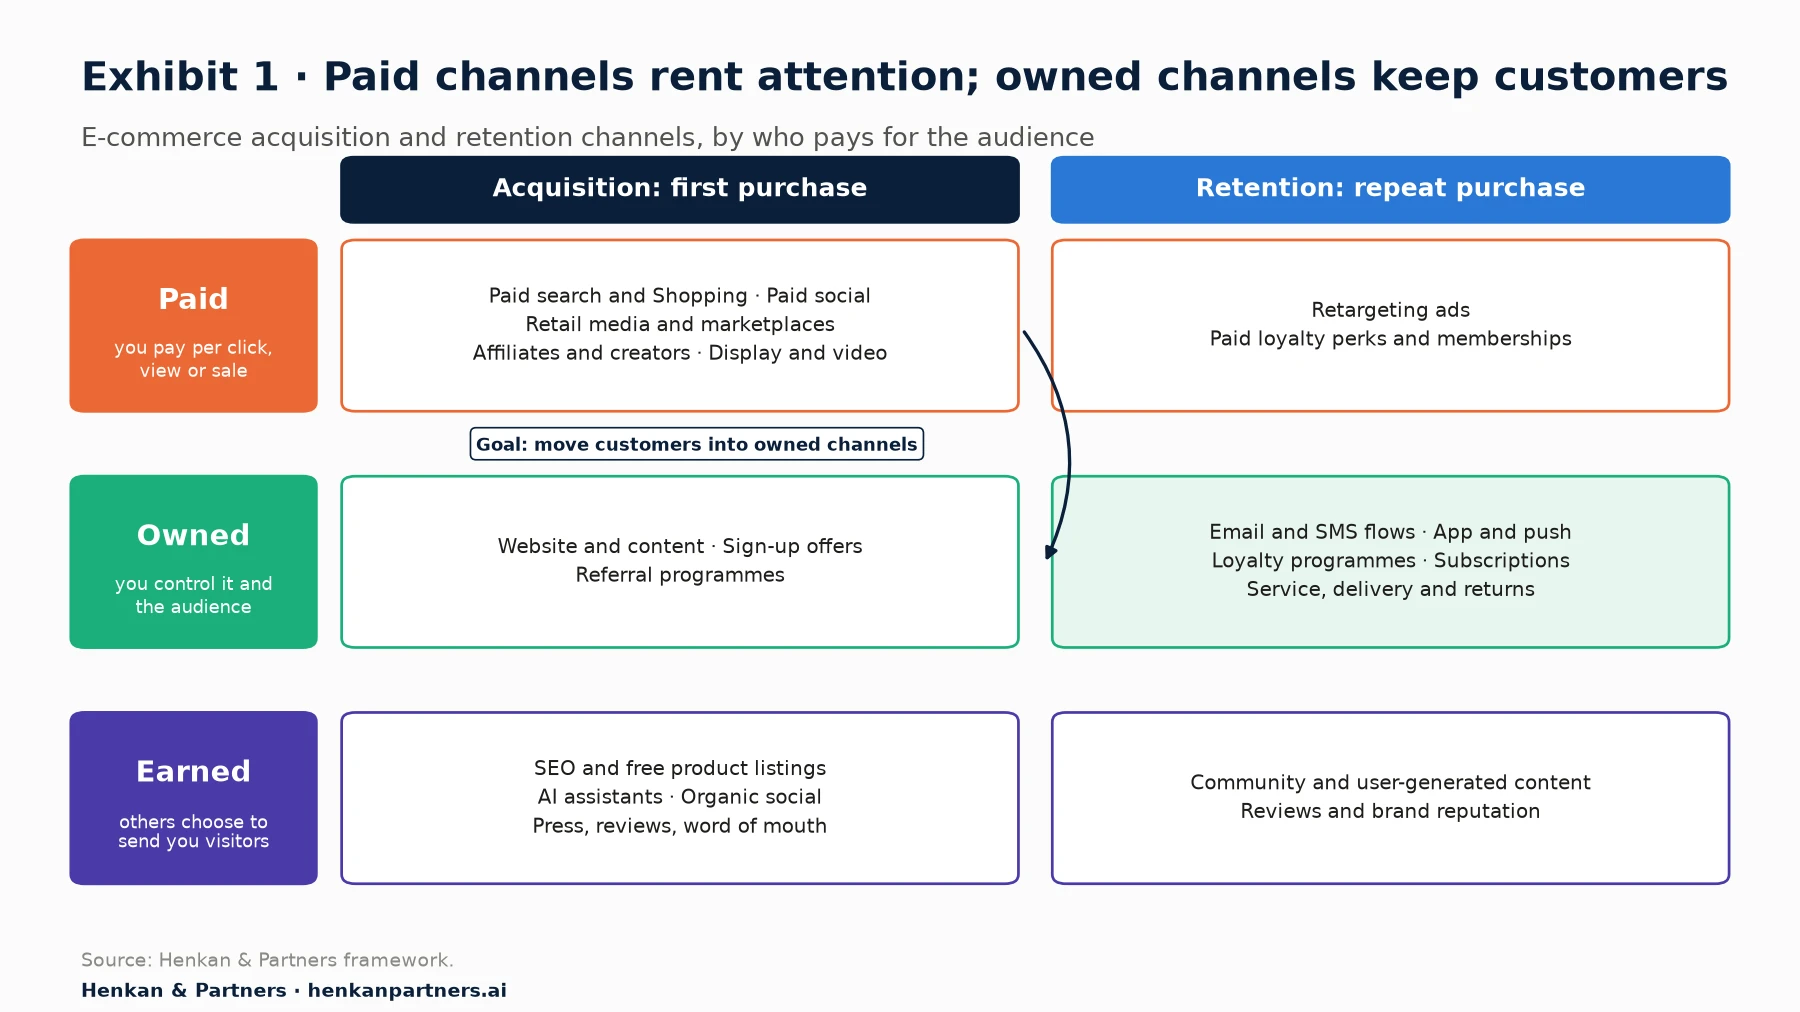
What this shows. The goal of most acquisition spend is to move a customer from the top left, where you pay for every visit, to owned retention in the middle right, where you can reach them for almost nothing. A channel strategy is really a plan for that journey, and the experience on your site and after the order decides how many customers make it.
| Channel group | Main job | Speed | Cost model | Who owns the audience |
|---|---|---|---|---|
| Paid search and Shopping | Capture existing demand | Immediate | Cost per click | The platform |
| Paid social | Create demand and reach new audiences | Immediate | Cost per impression | The platform |
| Marketplaces and retail media | Reach shoppers already on the marketplace | Immediate | Commission and ads | The marketplace |
| Affiliates and creators | Borrow trust from partners | Weeks | Commission or fee | The partner |
| SEO, free listings and AI answers | Be found for free when people search or ask | Months | Content and technical work | Shared |
| Email, SMS and app | Bring customers back and complete purchases | Immediate once the list exists | Tools and content | You |
| Loyalty, subscriptions, experience | Increase frequency and lifetime value | Months | Rewards, margin, operations | You |
Section 2 · Economics
Acquisition is getting more expensive, so retention increasingly decides profitability
Paid media is now the default route to new customers, and it is concentrated in a few hands. The IAB and PwC report that US digital advertising revenue reached $294.6 billion in 2025, up 13.9%. Social media grew 32.6% to $117.7 billion and overtook search ($114.2 billion, up 11%) as the largest format. Commerce media, the ads sold by retailers and marketplaces, grew 18% to $63.4 billion. Worldwide, WPP Media's June 2026 forecast estimates that Alphabet, Meta and Amazon control 57.6% of the advertising market outside China.
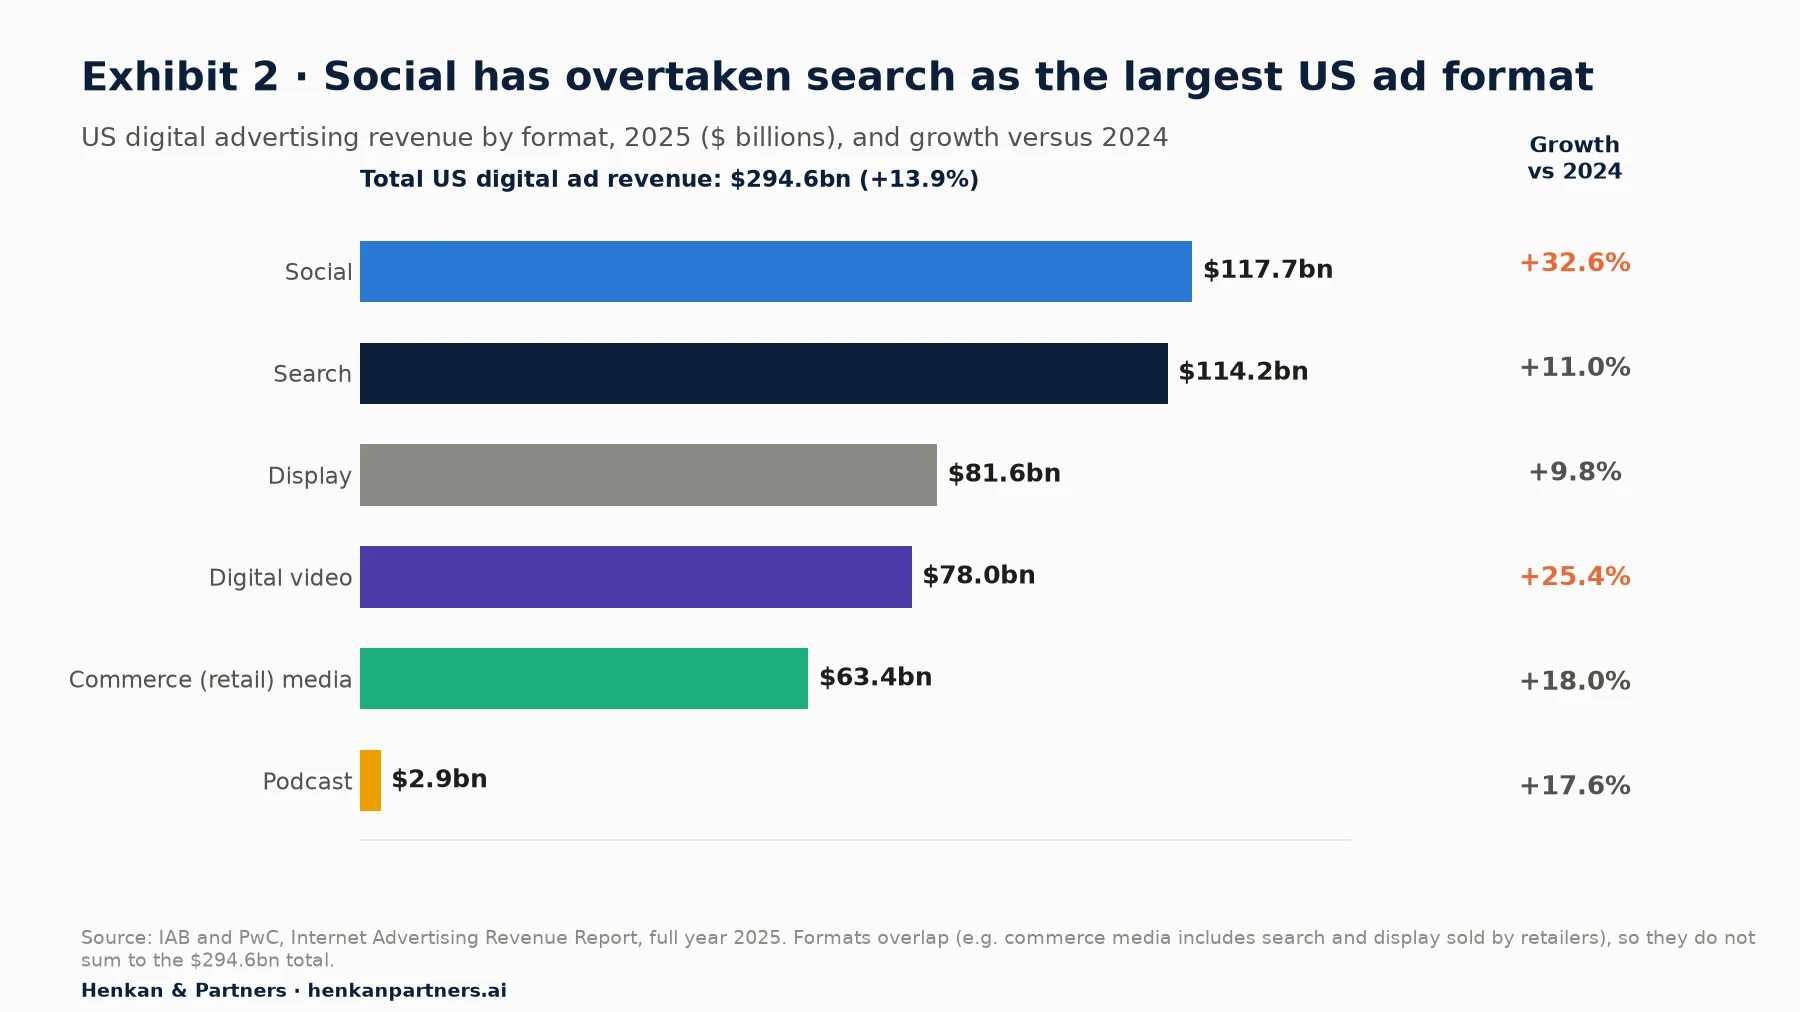
What this shows. Money is moving to social and video, where platforms create demand rather than capture it, and to retail media, where the shopper is already on a shopping site. Search is still enormous but growing more slowly, and AI answers are starting to change it (Section 5).
Prices are rising with demand. Meta reported that in the second quarter of 2026 ad impressions rose 14% and the average price per ad rose 12% year on year. Contentsquare's 2026 benchmark found that cost per visit rose 9% in a year and 30% over three years, while total site traffic fell 3.8%. A widely quoted vendor study by SimplicityDX found that merchants lost $29 on average for each new customer acquired in 2022, against $9 in 2013.
Why retention changes the equation
A customer who buys again costs little or nothing to reach. Shopify, citing Gorgias data, reports that repeat customers represent 21% of customers but 44% of revenue and 46% of orders. The most famous number on the subject, that a 5% increase in retention increases profits by 25% to 95%, comes from Frederick Reichheld's research at Bain in service industries such as credit cards and banking. It is a useful direction, not a law: the research studied service businesses in the late 1980s, not online retail, so treat the range as an illustration rather than a forecast for your shop.
Customer lifetime value (CLV) = average order margin × number of orders per customer over their lifetime
Maximum affordable CAC = CLV − the profit you want to keep per customer
Payback period = CAC ÷ margin per customer per month
For leaders. Ask for CAC and CLV by acquisition channel, calculated on margin after returns, not on revenue. Channels that look expensive on first-order ROAS often bring customers who come back, and cheap channels such as discount-heavy affiliates can bring customers who never buy again. The ratio that matters is lifetime margin per customer against what it cost to acquire them.
Section 3 · Paid search and Shopping
Paid search captures demand that already exists, so its real value is in the searches you would not win anyway
Search ads reach people at the moment they look for something. For e-commerce, the most important formats are Shopping ads, which show a product image, price and shop name from your product feed, and Performance Max, Google's campaign type that uses one budget across "YouTube, Display, Search, Discover, Gmail, and Maps". Google describes how it works: advertisers supply assets and goals, which are "combined with the power of Google AI to serve across all available inventory".
Paid search also converts well. Contentsquare's 2026 benchmark of 99 billion sessions found that "Out of the paid channels, search (2.8%) had the highest conversion rate, above social and ads", and paid search brought 25% of all traffic. WordStream and LocaliQ's 2026 benchmarks, based on 13,474 US search campaigns, put the median cost per click for shopping, collectibles and gifts at $4.14 with a 4.01% conversion rate, and apparel at $4.44 with 4.50%.
The brand search question
The hardest question in paid search is how much it adds. Many people who click an ad for your brand name would have clicked the organic result just below it. In a large field experiment at eBay, economists Thomas Blake, Chris Nosko and Steven Tadelis found that brand-keyword ads had "no measurable short-term benefits". Ads on other keywords worked for new and occasional customers, but most of the spend went to frequent buyers who would have purchased anyway, so average returns were negative. eBay is an unusually well-known brand; smaller shops facing competitors bidding on their name may see a different result. The lesson is to test, not to assume.
For marketers. Separate brand and non-brand campaigns, and separate Shopping by product margin, so you can see where money goes. Run a simple test on brand search: pause it in some regions or weeks and compare total sales, not ad-attributed sales, with the rest. Keep Performance Max on a short leash with clear conversion values and exclusions for existing customers if your goal is acquisition.
Section 4 · Paid social
Paid social creates demand at scale, but prices are rising and platform reporting is generous
Social platforms show ads to people who were not searching for you, which makes them the main engine for launching products and reaching new audiences. Meta dominates: in Triple Whale's data on e-commerce brands using its tools, 66.88% of ad budgets went to Meta. Its campaigns are now largely automated, with the algorithm choosing audiences and placements from the creative and the conversion signal you give it.
That signal became weaker after Apple introduced App Tracking Transparency on iPhones in 2021, which lets users refuse tracking across apps. Meta's finance chief said in February 2022 that the change would cost the company "on the order of $10 billion" that year. Advertisers responded by sending conversions server-to-server and by relying more on the platform's modelling.
| Platform | What it is good for | Watch out for |
|---|---|---|
| Meta (Facebook, Instagram) | Broad reach, strong automation, catalogue ads, retargeting | Rising prices (average price per ad +12% year on year, Q2 2026); reported results include modelled and view-through conversions |
| TikTok and TikTok Shop | Reaching younger audiences; creator-led video; buying inside the app | Creative wears out fast; sales inside the app are not on your site or list |
| Planning and inspiration categories such as home, fashion and weddings | Smaller scale; longer time to purchase | |
| YouTube and connected TV | Brand building and demonstration | Hard to measure with clicks; needs lift tests or modelling |
Social commerce inside the apps is growing quickly. Momentum Works estimates that TikTok Shop's gross merchandise value reached $64.3 billion worldwide in 2025, including $15.1 billion in the United States. Adobe found that social media's share of US online holiday revenue rose from 3.3% in 2024 to 4.6% in 2025.
For leaders. Platform dashboards grade their own homework. Triple Whale's cross-industry median Meta ROAS of 1.88 is attributed revenue, not profit, and not incremental. Before raising a social budget, ask for a lift test or a geographic test on your own account, and judge the result on contribution margin.
Section 5 · Search, SEO and AI assistants
Organic search still drives the most valuable free traffic, but AI answers now cut the clicks it sends
Search engine optimisation earns visibility without paying per click. For e-commerce it has three parts: category and product pages that answer what shoppers search for, a technically sound site, and structured product data. Google explains that with product structured data "users can see price, availability, review ratings, shipping information, and more right in search results", and that providing both structured data and a Merchant Center feed "maximizes your eligibility". Google Merchant Center also offers free product listings, which appear in the Shopping tab, Search, Images, Lens and YouTube at no cost per click.
The ground is moving under SEO. SparkToro and Datos found that in 2024, 58.5% of US and 59.7% of EU Google searches ended without a click. AI summaries push this further. Pew Research Center tracked the browsing of US adults and found that when a Google AI summary appeared, users clicked a traditional search result in 8% of visits, against 15% when there was none, and clicked a link inside the summary itself in just 1% of visits.
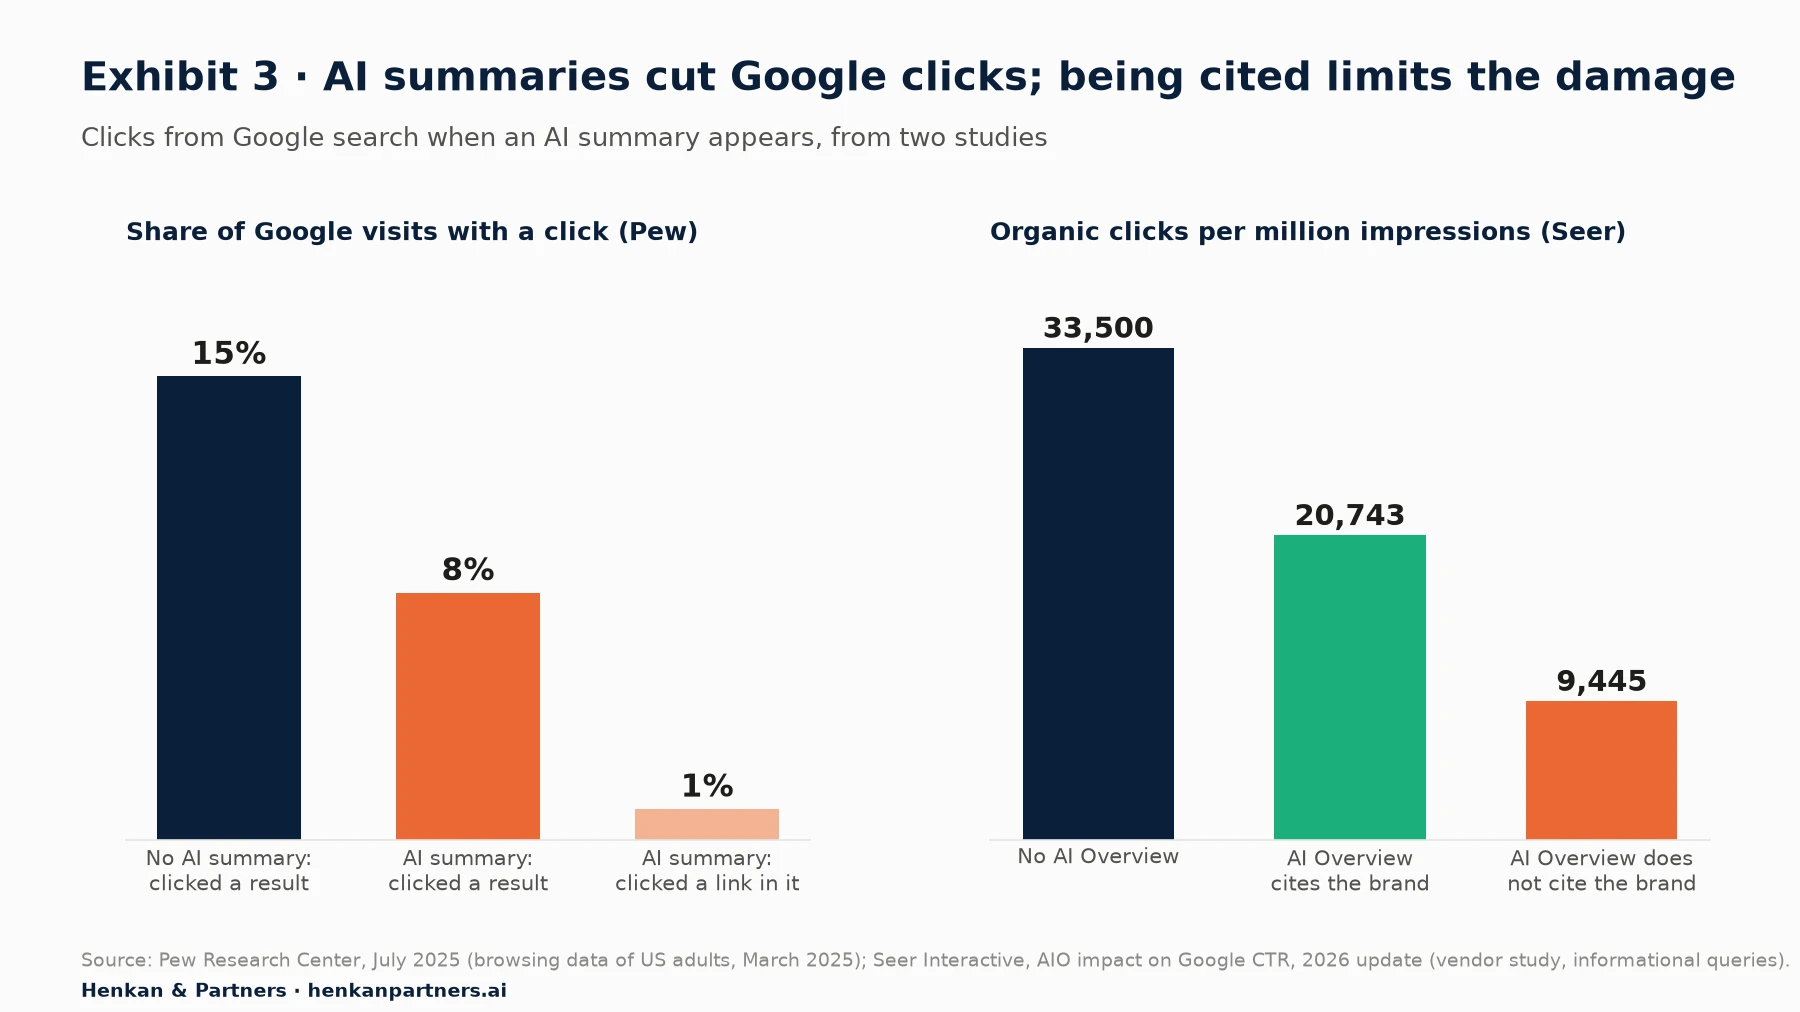
What this shows. Ranking is no longer enough: for questions that trigger an AI summary, the brands the summary cites keep about twice as many clicks as those it ignores. Seer Interactive also saw click-through recover somewhat in early 2026. Product and category searches with clear buying intent are less affected than informational questions, but the direction is clear.
AI assistants: small today, growing fast, and starting to sell
Shoppers now ask AI assistants what to buy. Contentsquare found that AI-referred traffic grew 632% in a year but still represents "just 0.2% of total visits", converting at 1.3%. Adobe measured a 693% increase in traffic from generative AI tools to US retail sites during the 2025 holiday season. The assistants are also trying to sell. In September 2025 OpenAI launched Instant Checkout in ChatGPT, where users could "complete the purchase without ever leaving the chat", but in March 2026 it moved purchases to merchants' own apps and websites after few users bought inside the chat. Google lets US shoppers check out with eligible retailers directly in AI Mode. Since May 2026, Google Analytics groups visits from recognised AI assistants into a dedicated channel.
| To be found in AI answers | Why it matters |
|---|---|
| Keep product feeds complete and accurate in Google Merchant Center and other catalogues | Assistants and AI shopping features read feeds and structured data, not only pages |
| Answer real buying questions on category and product pages (sizes, materials, use cases, comparisons) | AI summaries cite pages that answer the question directly |
| Earn reviews and mentions on sites you do not own | Assistants weigh third-party opinions, not only your own claims |
| Make shipping, returns and stock information easy to read | Agentic checkout depends on clear, machine-readable terms |
| Track AI assistant traffic as its own channel | It behaves differently from search and is growing fast from a small base |
For marketers. Measure SEO on clicks and revenue from Search Console and your analytics, not on rankings alone, and split informational from product queries. Check which of your key questions trigger AI summaries and whether you are cited. If you are not, improve the page that should be cited before writing new content.
Section 6 · Marketplaces and retail media
Marketplaces bring ready-to-buy shoppers, at the price of margin and of the customer relationship
Marketplaces such as Amazon, Zalando, Allegro or Bol put your products in front of shoppers who are already on a shopping site with their card saved. That is their strength. The costs are commissions, advertising to stay visible, and weaker ownership of the customer: the marketplace controls the relationship, the data and often the repeat purchase.
Advertising has become part of the price of selling there. Amazon's advertising services revenue reached $19.8 billion in the second quarter of 2026, up 26% year on year, and IAB and PwC put US commerce media at $63.4 billion in 2025. Retail media is growing because the retailer can show ads to shoppers at the moment of purchase and prove sales with its own data.
| Question | Sell on marketplaces when... | Be careful when... |
|---|---|---|
| Reach | Your category is searched mainly on the marketplace | Your brand is strong enough to draw shoppers to your own site |
| Margin | Commission plus ads still leaves a healthy contribution | Advertising costs keep rising to hold the same rank |
| Customer data | You can live with limited customer data | Repeat purchase and CLV are central to your model |
| Brand control | Products are standard and compared on price | Presentation, advice and service are part of the value |
Section 7 · Affiliates, creators and word of mouth
Partners, creators and happy customers bring trust that ads cannot buy, if you pay for the right behaviour
Affiliates are paid a commission on the sales they refer: publishers, review sites, cashback and voucher sites, and increasingly creators. Adobe found that affiliates and partners, including influencers, drove 20.4% of US online holiday revenue in 2025, up from 17.6% a year earlier. The risk is paying commission on sales you would have made anyway, especially when voucher sites capture shoppers at checkout.
Creators and influencers are now a large advertising market in their own right: IAB and PwC estimate US creator advertising at $37 billion in 2025, projected to reach $44 billion in 2026. Disclosure is a legal requirement in most markets. The US Federal Trade Commission requires a disclosure when there is a "material connection", including "the brand paying you or giving you free or discounted products", placed with the endorsement itself.
Referral programmes turn customers into a channel. The best evidence comes from a study of a German bank by Philipp Schmitt, Bernd Skiera and Christophe Van den Bulte, published in the Journal of Marketing: "the average value of a referred customer is at least 16% higher than that of a nonreferred customer", mainly because referred customers stayed longer. The study is not from retail, but the mechanism, trust passed on by a friend, applies to e-commerce too. Organic social and community work in the same way: Contentsquare measured a conversion rate of just 0.7% for organic social traffic, so their value lies more in trust and reach than in direct sales.
For marketers. Pay affiliates differently by type: higher commission for content and creators who bring new customers, lower or none for voucher and cashback sites on existing customers. Ask your affiliate platform to report new-customer share by partner. For referral programmes, reward both the referrer and the friend, and track referred customers as a cohort.
Section 8 · Email, SMS and app
Automated messages triggered by customer behaviour earn far more than campaigns sent to the whole list
Email is the backbone of e-commerce retention: cheap per message, owned by you and measurable. Vendors report very high returns. In Litmus's 2025 survey of marketers, retail and e-commerce respondents reported an average return of about $45 for every $1 spent. These are self-reported figures based on attributed revenue, so treat them as a sign that email is efficient, not as a forecast.
The biggest gains come from flows: messages sent automatically after a sign-up, an abandoned cart, a browse, a first purchase or a period of inactivity. Klaviyo's 2026 benchmarks, based on more than 183,000 customers, found that flows generate revenue per recipient "nearly 18× higher than campaigns"; flows are 5.3% of emails sent but about 41% of email revenue. Baymard Institute's average cart abandonment rate of 70.22%, across 50 studies, shows how many started purchases go unfinished, although many of those shoppers were only browsing.
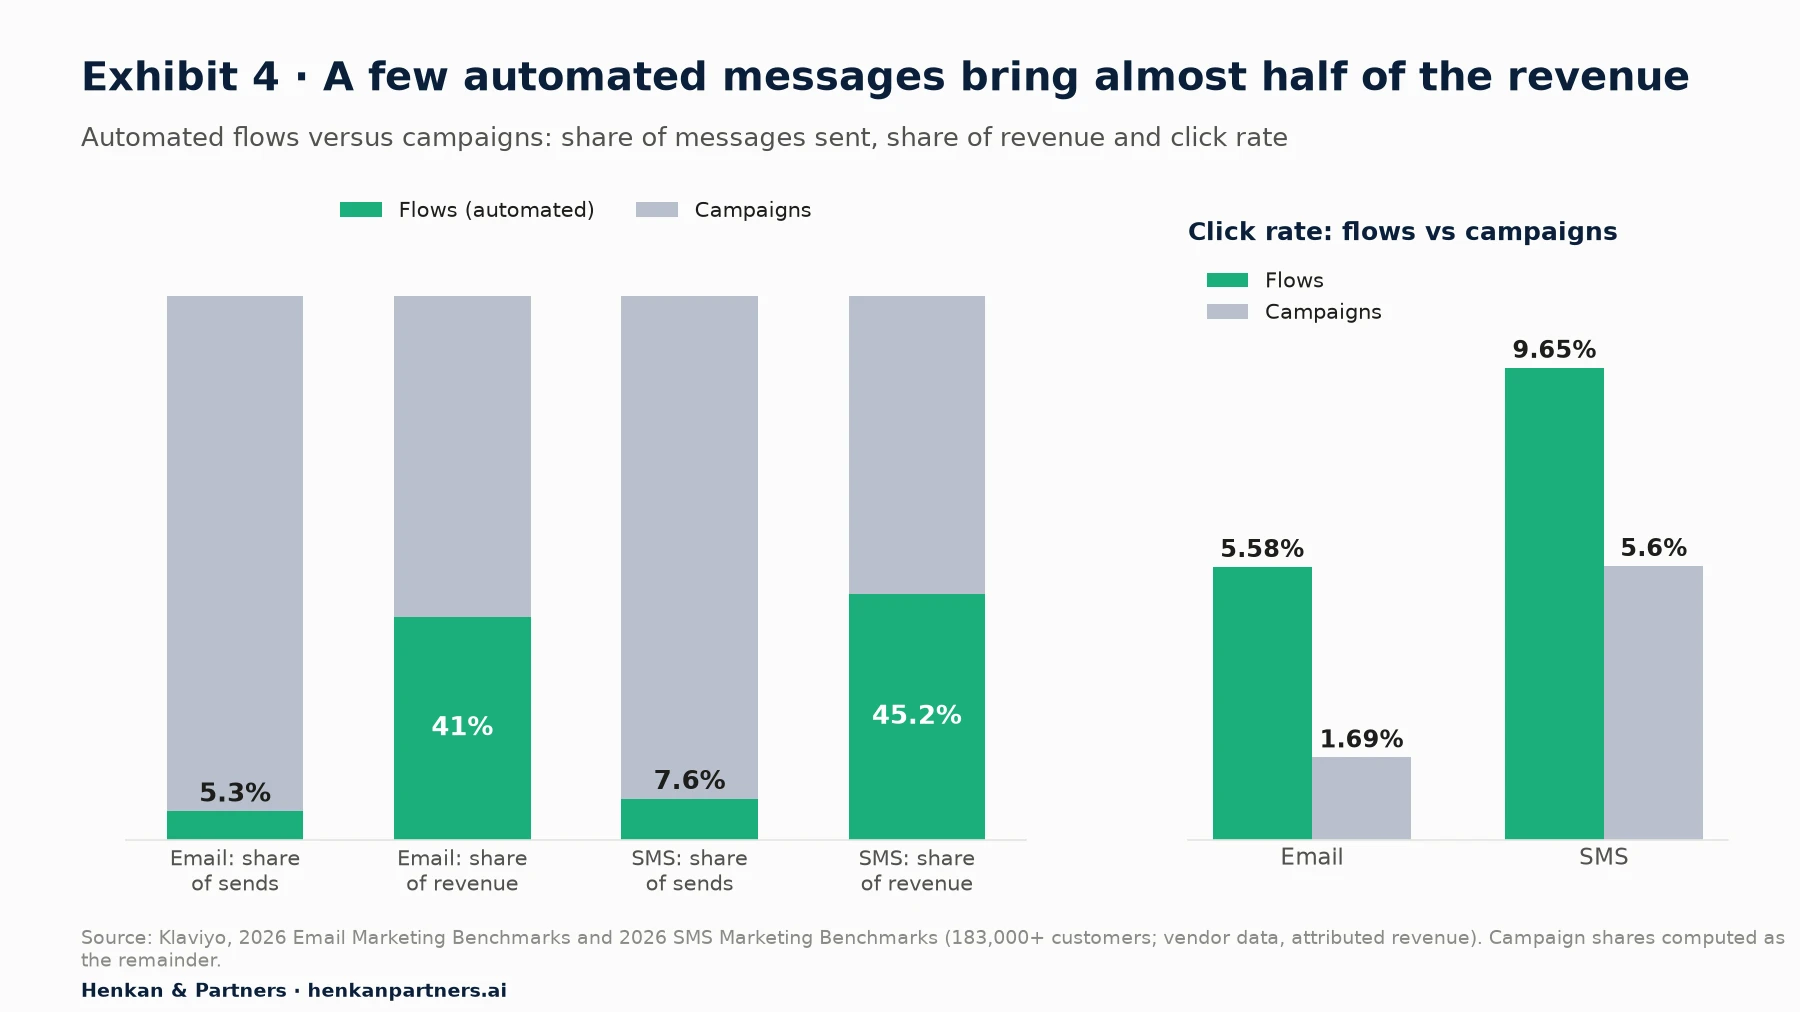
What this shows. A dozen well-built flows often matter more than the weekly newsletter. Start with the ones tied to clear intent: welcome, abandoned cart, abandoned browse, post-purchase and win-back. Then measure them with holdout groups, because attributed revenue includes purchases that would have happened anyway.
Three rules that changed email and SMS
- Open rates are no longer reliable. Apple's Mail Privacy Protection, introduced in 2021, preloads images including tracking pixels. Litmus found that Apple clients accounted for 62.26% of tracked email opens in July 2026. Measure clicks, orders and revenue instead.
- Bulk senders must authenticate and allow one-click unsubscribe. Since February 2024, Google and Yahoo require large senders to authenticate their domain (SPF, DKIM and DMARC), offer one-click unsubscribe and keep spam complaints below 0.3% (Google recommends staying below 0.1%).
- Consent rules differ by channel and country. In Europe, marketing emails to individuals need prior consent, with a "soft opt-in" exception for existing customers about similar products. The UK regulator ICO lists five conditions, including giving "an opportunity to refuse or opt out in every subsequent communication". In Europe, SMS marketing to individuals follows the same prior-consent rules.
For leaders. Your email and SMS lists are among the few marketing assets you own outright. Track list growth, active subscribers and revenue per subscriber as business metrics, and treat list-building at checkout and in store as seriously as paid acquisition.
Section 9 · Loyalty and experience
Loyalty programmes, subscriptions and a good experience turn one-off buyers into repeat customers
How often customers come back varies enormously by category. In a 2026 study of 156,110 customers of direct-to-consumer brands, BS&Co found an average repeat purchase rate of 18.8% within a year: 22% to 44% for consumables, 10% to 17% for fashion and 7% to 18% for durable goods. Half of second purchases happened within 30 days. Knowing your own curve tells you which retention tools make sense.
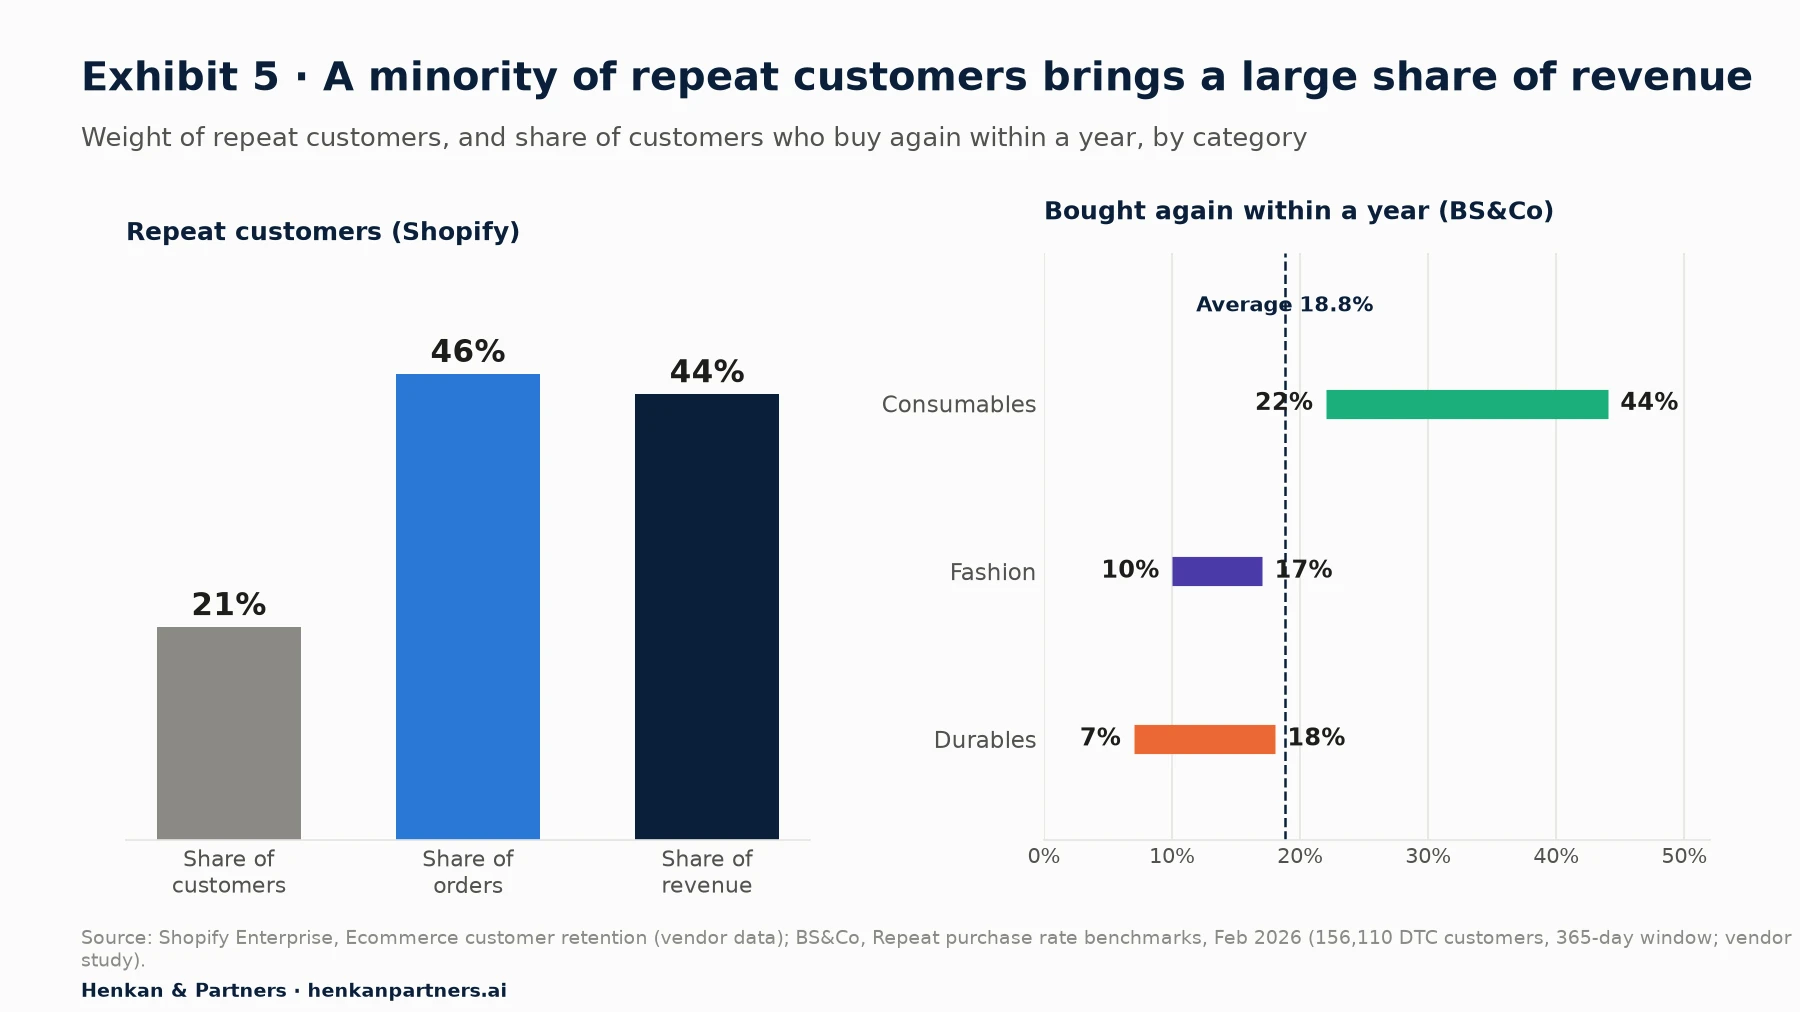
What this shows. A fashion brand and a coffee brand should not have the same retention plan. Consumables benefit from replenishment reminders and subscriptions; fashion and durables need reasons to come back, such as new collections, care content, complementary products and service.
What the evidence says about the main retention tools
| Tool | Evidence | Best for |
|---|---|---|
| Loyalty programmes | A meta-analysis of 429 effect sizes over 30 years (Belli and colleagues, Journal of the Academy of Marketing Science, 2022) found that programmes "particularly enhance behavioral loyalty", such as repeat purchase, while "shifting consumers' attitudinal loyalty is more challenging" | Frequent-purchase categories; brands with enough margin to fund rewards |
| Paid memberships | McKinsey's 2020 survey found paid programme members "60 percent more likely to spend more" after subscribing, against 30% for free programmes; CIRP estimates Amazon Prime members spend about $1,100 a year on Amazon against $500 for others | Retailers with a clear benefit such as free delivery (members may already be big spenders, so causality is uncertain) |
| Subscriptions and replenishment | McKinsey (2018): 45% of replenishment subscribers stayed at least a year, about 10 points more than curation or access subscriptions; over a third of subscribers cancel within 3 months | Consumables bought on a regular cycle |
| Personalisation | McKinsey (2021): 71% of consumers expect personalised interactions, and personalisation "most often drives 10 to 15 percent revenue lift" | Large catalogues; brands with enough data and traffic to test |
| Post-purchase experience | Delivery, returns, service and product quality decide whether a first order becomes a second; there is little public data, so measure it with your own cohorts | Every shop |
For marketers. Before launching a points programme, fix the basics that make people want to come back: delivery promises kept, easy returns, fast answers from service and a useful post-purchase email sequence. Then test a loyalty mechanic on a share of customers with a control group, and judge it on repeat rate and margin, not on sign-ups.
Section 10 · Measurement
Attribution reports who touched a sale; only experiments show what each channel really adds
Every platform reports its own contribution generously. Google, Meta, your email tool and your affiliate network will each claim credit for the same order. Attribution models share the credit more fairly, but they still measure correlation. A widely cited comparison, by Brett Gordon, Florian Zettelmeyer and colleagues using 15 Facebook field experiments, found that "the observational methods often fail to produce the same effects as the randomized experiments". In one study, the true lift measured by the experiment was 2.4%, while an observational method estimated 1,306%.
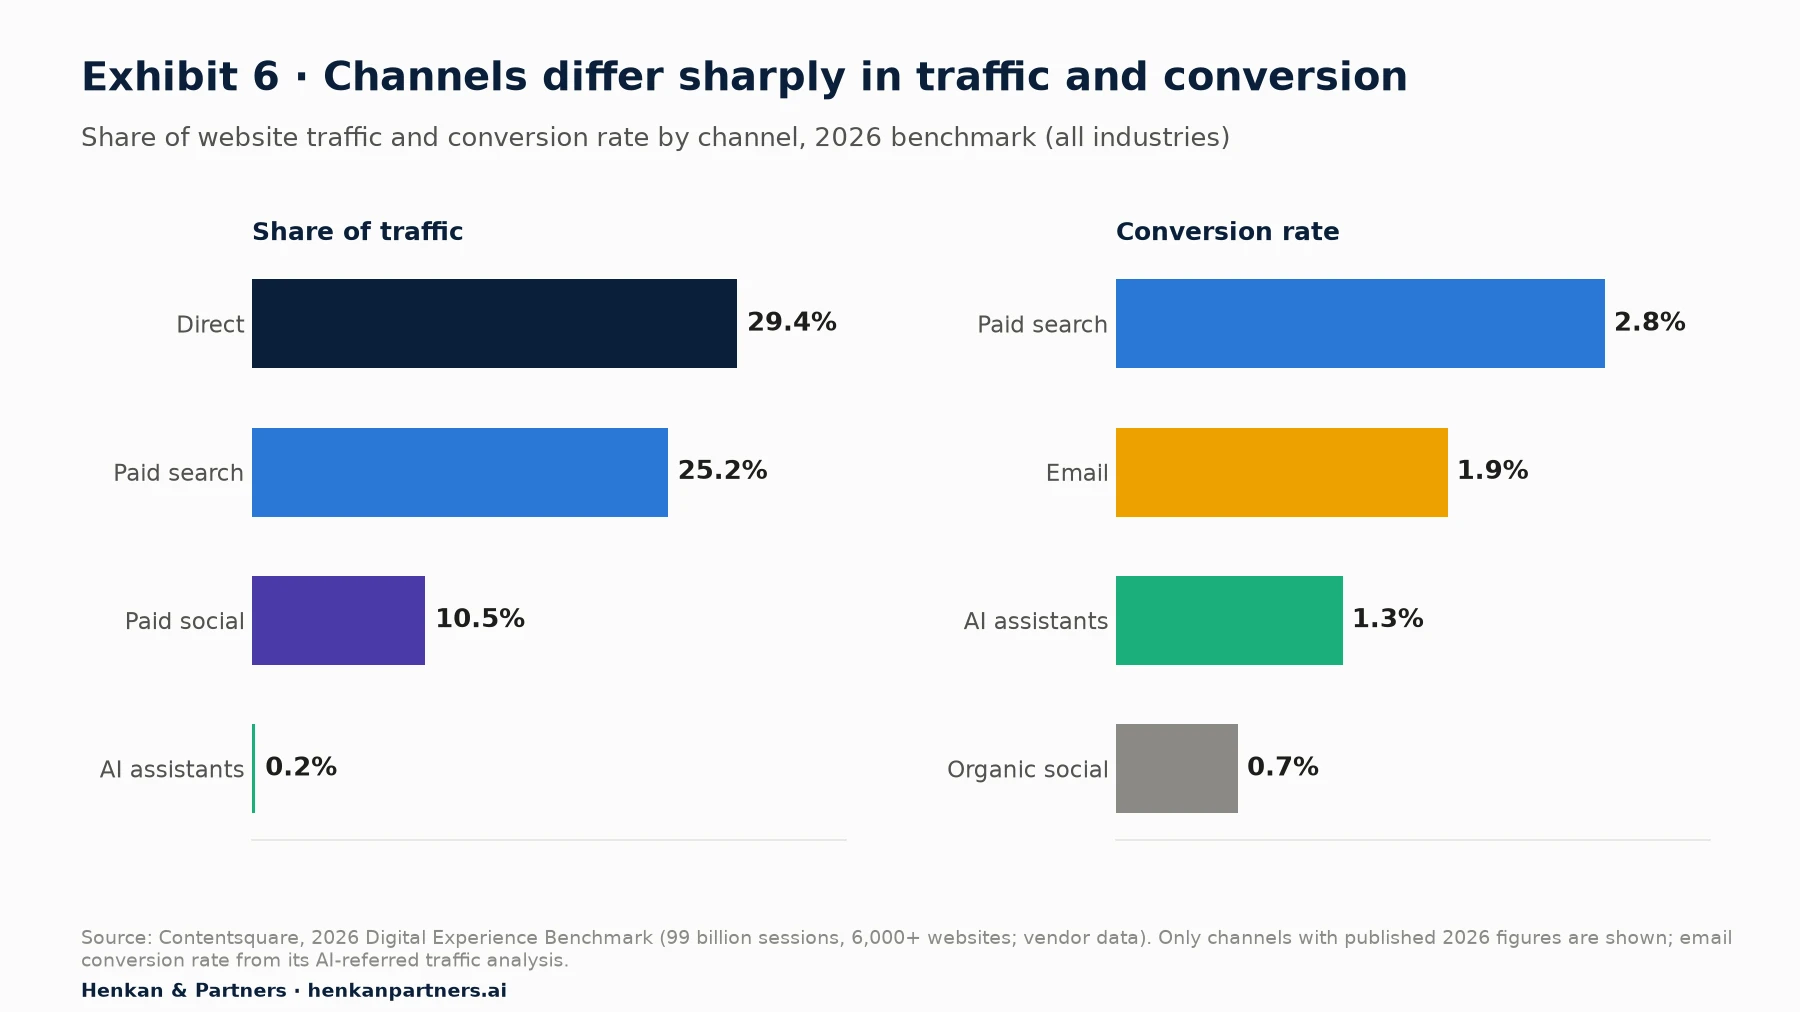
What this shows. Conversion rate by channel reflects intent, not only channel quality: people clicking a search ad or an email are closer to buying than people scrolling social media. That is why channel comparisons on last-click conversion rate or ROAS push budgets towards channels that harvest demand and away from those that create it.
| Method | Question it answers | Good for | Team size |
|---|---|---|---|
| Platform and analytics attribution | Which touchpoints were involved in a sale? | Daily optimisation within a channel | Every team |
| Holdout groups (CRM) | How many extra orders do emails, SMS or loyalty cause? | Retention channels you control | Every team with a list |
| Geographic or time-based tests | What happens to total sales when a channel is paused or increased? | Brand search, paid social, affiliates | Growing teams |
| Platform lift studies | How many extra conversions did this campaign cause? | Meta, Google and YouTube budgets | Growing teams |
| Marketing mix modelling | How should the budget be split across channels, online and offline? | Large, multi-channel budgets | Larger teams |
| Cohort and RFM analysis | Are customers from each channel coming back, and who is at risk? | Acquisition quality and retention targeting | Every team |
Our Essential Guide to Web Analytics explains attribution models and marketing mix modelling in more detail, and Beyond the Numbers: How GA4 Actually Works explains why traffic source reports can differ between tools.
For leaders. Ask for one experiment a quarter on your largest budget line. A few well-run tests on brand search, retargeting, affiliates or email frequency usually free up more money than any optimisation inside a platform.
Section 11 · By team size
The right channel mix depends on your stage, your margins and the size of your team
| Team | Acquisition focus | Retention focus | Measurement |
|---|---|---|---|
| One or two people | Google Shopping and free listings; one social platform where your customers are; SEO on your key categories | Welcome, abandoned cart and post-purchase flows; clear delivery and returns; review requests | Contribution margin by channel in a monthly spreadsheet; repeat rate by month of first order |
| Growing e-commerce team | Split brand and non-brand search; two social platforms with a creative testing routine; affiliates paid by new-customer share; AI assistant visibility | Full flow library; SMS with consent; segmentation by RFM; a loyalty or subscription test | Holdout groups on email and SMS; one geo test per quarter; CAC and CLV by channel |
| Multi-brand or international retailer | Retail media and marketplaces by country; creators at scale; connected TV and video; structured product data across markets | Paid membership or tiered loyalty; personalisation across site, app and CRM; service as a retention lever | Marketing mix modelling calibrated with experiments; cohort CLV by channel and country |
Section 12 · What to do next
Six steps build a channel mix that grows revenue and customer lifetime value
1. Map where your customers come from and come back through
List every channel, its spend, new customers, repeat customers and contribution margin for the last twelve months. Most teams find two or three channels doing most of the work and several that nobody can justify.
2. Judge channels on margin and lifetime value, not ROAS
Calculate CAC and 12-month margin per customer by acquisition channel. Shift budget towards channels whose customers come back, even if their first-order ROAS looks weaker.
3. Test incrementality where the money is
Start with brand search, retargeting and voucher affiliates, which often claim sales that would have happened anyway. A pause test in some regions or weeks is enough to start.
4. Build the retention basics before the fancy tools
Welcome, abandoned cart, post-purchase and win-back flows; list growth at checkout; reliable delivery and easy returns. Then test loyalty, subscriptions or personalisation with control groups.
5. Prepare for AI search and AI shopping
Clean product feeds and structured data, pages that answer real buying questions, reviews on third-party sites, and AI assistant traffic tracked as its own channel.
6. Improve the experience that every channel lands on
Every channel sends people to the same product pages, basket and checkout. Improving conversion there raises the return of all channels at once. Our Essential Guide to A/B Testing explains how to do it with evidence.
FAQ
Frequently asked questions about e-commerce acquisition and retention channels
Frequently asked questions
What are the main acquisition channels in e-commerce?
Paid search and Shopping ads, paid social, marketplaces and retail media, affiliates and creators, SEO and free product listings, and increasingly AI assistants. Organic social, press, reviews and referral programmes also bring new customers. Most shops rely on two or three of them for the bulk of new customers.
What are the main retention channels in e-commerce?
Email and SMS (especially automated flows), app and push notifications, loyalty programmes, subscriptions and replenishment, personalisation, and the post-purchase experience: delivery, returns and service. Retention channels are mostly owned, so they cost far less per contact than paid acquisition.
Which e-commerce marketing channel has the best ROI?
Email usually reports the highest return because it costs little to send, but its attributed revenue includes purchases that would have happened anyway. The honest answer depends on your margins and customers: compare channels on incremental contribution margin and customer lifetime value, measured with tests, not on platform ROAS.
Is acquisition or retention more important?
Both, but in Henkan & Partners' experience most shops underinvest in retention. Acquisition is getting more expensive, and repeat customers bring a disproportionate share of revenue: Shopify reports 44% of revenue from 21% of customers. The balance depends on your category: consumables can build a retention-led model; durables need steady acquisition.
How is AI changing e-commerce acquisition?
AI summaries in Google reduce clicks to websites, with users clicking a result in 8% of visits with a summary against 15% without, according to Pew. AI assistants send little traffic today (0.2% in Contentsquare's benchmark) but it grew more than sevenfold in 2025, and Google now lets US shoppers check out with some retailers inside AI Mode.
How do I measure the true impact of a marketing channel?
Use experiments: holdout groups for email, SMS and loyalty; geographic or time-based pause tests for paid channels; platform lift studies; and, for large budgets, marketing mix modelling calibrated with tests. Attribution reports are useful for daily optimisation but tend to overstate what each channel adds.
What is a good repeat purchase rate for an online shop?
It depends heavily on the category. A 2026 study of 156,110 direct-to-consumer customers found 18.8% bought again within a year on average: 22% to 44% for consumables, 10% to 17% for fashion and 7% to 18% for durable goods. Track your own rate by month of first purchase and aim to improve it over time.
Key terms
- Customer acquisition cost (CAC)
- Marketing and sales spend divided by the number of new customers. It tells you what growth costs, and it is only meaningful next to what a customer is worth.
- Customer lifetime value (CLV)
- The margin a customer generates over their whole relationship with you. It sets how much you can afford to pay to acquire one.
- ROAS
- Return on ad spend: revenue attributed to ads divided by ad spend. Easy to report, but it counts revenue, not margin, and it includes sales that would have happened anyway.
- Incrementality
- The sales a channel causes that would not have happened without it, measured with a test and control group. The only number that tells you whether to spend more.
- Paid search and Shopping
- Ads shown on search engines, as text ads or as product listings with image and price. Google's Performance Max campaigns now combine many of them.
- Paid social
- Ads on social platforms such as Meta (Facebook, Instagram), TikTok and Pinterest, targeted by interest and behaviour and optimised by the platform's algorithm.
- Retail media
- Advertising sold by retailers and marketplaces, such as Amazon Ads, on their own sites and apps, using their shopper data.
- Affiliate marketing
- Partners such as publishers, cashback sites and creators who promote your products and are paid a commission on sales they refer.
- SEO and free listings
- Earning unpaid visibility in search results through content, technical quality, structured data and free product listings in Google Merchant Center.
- AI assistant traffic (GEO)
- Visits and purchases that come from AI assistants such as ChatGPT, Gemini or Claude. Generative engine optimisation (GEO) is the work of being cited and recommended in their answers.
- Owned channels
- Channels you control and do not pay per contact for, such as your website, app, email list and SMS list. Their cost is mostly content, tools and consent.
- Flow (automation)
- A message sent automatically when a customer does something, such as signing up or abandoning a cart. The opposite of a campaign sent to a list at a chosen time.
- Soft opt-in
- The European rule that lets you email existing customers about similar products without new consent, as long as they can refuse at collection and in every message.
- Cohort analysis
- Grouping customers by when they were acquired and tracking how many buy again over time. The clearest way to see whether retention is improving.
- RFM
- Recency, frequency and monetary value: a simple scoring of customers by how recently, how often and how much they buy, used to target retention messages.
- Holdout group
- A random share of customers deliberately left out of a campaign or channel, so you can compare their behaviour and measure what the channel adds.
Sources
Methodology. This guide was researched in September 2026 from industry reports (IAB and PwC, WPP Media), company results (Amazon, Meta), official documentation (Google, OpenAI, Yahoo, the FTC, the ICO and the CNIL), peer-reviewed research and vendor benchmarks. Vendor figures come from each company's own customers or panel and are labelled as such; they show direction and scale, not market averages. Every source was opened and checked on 27 September 2026. Recommendations marked Henkan & Partners are our own.
- IAB and PwC, Digital ad revenue climbs to nearly $300B (Internet Advertising Revenue Report, full year 2025)
- IAB, Internet Advertising Revenue Report: Full Year 2025
- WPP Media, This Year Next Year: Midyear 2026 Global Forecast
- Meta, Second Quarter 2026 Results
- Amazon, Second Quarter 2026 Results
- Contentsquare, How digital traffic is changing in 2026
- Contentsquare, Conversion rates in 2026
- Contentsquare, What is AI-referred traffic? 2026 benchmarks
- SimplicityDX, Brands losing a record $29 for each new customer acquired
- Shopify Enterprise, Ecommerce customer retention
- Amy Gallo, The Value of Keeping the Right Customers, Harvard Business Review, 2014
- Reichheld and Sasser, Zero Defections: Quality Comes to Services, Harvard Business Review, 1990 (Bain & Company)
- Google Ads Help, About Performance Max campaigns
- WordStream, Google Ads benchmarks 2026
- Blake, Nosko and Tadelis, Consumer Heterogeneity and Paid Search Effectiveness: A Large Scale Field Experiment (NBER)
- Triple Whale, Facebook ad benchmarks by industry
- Triple Whale, Ecommerce benchmarks 2026
- CNBC, Facebook says Apple iOS privacy change will result in $10 billion revenue hit this year, 2022
- Momentum Works, TikTok Shop U.S. GMV grew 68% to reach US$15.1B in 2025
- Adobe, Holiday shopping season drove a record $257.8 billion online, January 2026
- Google Search Central, Intro to product structured data
- Google Merchant Center Help, Free listings for products
- SparkToro, 2024 Zero-Click Search Study
- Pew Research Center, Google users are less likely to click on links when an AI summary appears in the results, July 2025
- Seer Interactive, AIO impact on Google CTR: 2026 update
- OpenAI, Buy it in ChatGPT: Instant Checkout and the Agentic Commerce Protocol, September 2025
- Forbes, Why OpenAI's checkout retreat spells trouble for its commerce strategy, March 2026
- Google Search Help, Make purchases directly from AI Mode in Google Search
- Google Analytics Help, What's new in Google Analytics (AI Assistant channel, May 2026)
- FTC, Disclosures 101 for social media influencers
- Schmitt, Skiera and Van den Bulte, Referral Programs and Customer Value, Journal of Marketing, 2011
- Litmus, The ROI of email marketing
- Klaviyo, 2026 Email Marketing Benchmarks
- Klaviyo, 2026 SMS Marketing Benchmarks
- Baymard Institute, Cart abandonment rate statistics
- Litmus, Email client market share
- Yahoo Sender Hub, Best practices
- Google Workspace Admin Help, Email sender guidelines FAQ
- ICO, How do we comply with the PECR electronic mail marketing rules?
- CNIL, Communication électronique : quelles règles ?
- BS&Co, Repeat purchase rate benchmarks, February 2026
- Belli et al., 40 years of loyalty programs: how effective are they? Journal of the Academy of Marketing Science, 2022
- McKinsey, Coping with the big switch: how paid loyalty programs can help bring consumers back to your brand, 2020
- CIRP, Amazon Prime shoppers outspend the rest, 2022
- McKinsey, Thinking inside the subscription box: new research on e-commerce consumers, 2018
- McKinsey, The value of getting personalization right, or wrong, is multiplying, 2021
- Gordon, Zettelmeyer, Bhargava and Chapsky, A Comparison of Approaches to Advertising Measurement: Evidence from Big Field Experiments at Facebook, Marketing Science, 2019
- Henkan & Partners, The Essential Guide to Web Analytics
- Henkan & Partners, Beyond the Numbers: How GA4 Actually Works
- Henkan & Partners, The Essential Guide to A/B Testing