Focus
E-commerce KPIs and Benchmarks: The Metrics That Matter and What Good Looks Like in 2026
Alexandre Suon · 2026-09-28
Most e-commerce teams track dozens of metrics and still cannot say why revenue moved. This deep dive sets out the ecommerce KPIs that matter at each level of the business, how to calculate each one and where to find it in GA4, what good looks like in 2026 according to sourced benchmarks, and how to use those benchmarks without fooling yourself.
Executive summary
- Build your KPIs as a tree from contribution down, not as a list. Revenue is sessions × conversion rate × average order value, and contribution is what is left after returns, variable costs and marketing. Every KPI on a dashboard should sit on one branch of that tree and have one owner.
- Fifteen KPIs across four levels are enough. The board needs net revenue, contribution, customer lifetime value against acquisition cost and return rate. The e-commerce lead needs sessions, conversion rate, average order value and revenue per visitor. CRO, UX and CRM teams need the diagnostic metrics beneath them.
- Benchmarks are wide, so read them as ranges, not targets. IRP Commerce put the average UK conversion rate at 2.23% in August 2026, from 0.57% in baby products to 5.81% in arts and crafts. Contentsquare measured 3.4% on desktop against 2.0% on mobile, and 2.9% for returning visitors against 1.7% for new ones. Baymard puts average cart abandonment at 70.22%.
- The spread between average and good is large on every metric. Across 2,800 stores benchmarked by Littledata, the average conversion rate was 1.4% while the top 10% started at 4.7%. Only 48% of mobile websites passed all three Core Web Vitals in 2025, and US retailers expected 19.3% of online sales to come back as returns.
- Your own trend beats someone else's average. Cross-site benchmarks mix categories, prices, traffic sources, attribution rules and tracking quality. Compare with the same period last year, by device and by cohort, and use benchmarks only to decide where to look first.
- AI helps you watch KPIs continuously, but only on top of trusted definitions. GA4 already flags anomalies with a Bayesian time-series model, and Google's official MCP server lets AI assistants query GA4 in plain language. Both are only as good as the tracking, consent set-up and metric definitions underneath.
Section 1 · Definitions
Ecommerce KPIs are the few metrics that explain profit, not everything you can measure
E-commerce KPIs (key performance indicators) are the small set of metrics an online business uses to judge whether it is reaching its goals. The core ones are conversion rate, average order value, revenue per visitor, customer acquisition cost, customer lifetime value, repeat purchase rate and return rate, all of which roll up into revenue and contribution margin.
A metric is anything you can count: page views, scroll depth, clicks on a filter. A KPI is a metric that someone is accountable for and that is tied to a business outcome. The difference matters because GA4 alone offers hundreds of metrics. If they all appear on the same dashboard, nobody knows which ones to act on.
The simplest way to choose is to start from the outcome and work down. Online revenue is not a sum of unrelated numbers; it is a product of a few factors. We covered this in detail in Understanding the E-commerce Market Equation. In short:
Revenue = sessions × conversion rate × average order value
Revenue = customers × orders per customer × average order value
Net revenue = revenue − returns and refunds
Contribution = net revenue − cost of goods − delivery − payment fees − marketing
The first line is the session view, the one analytics tools show and conversion work acts on. The second is the customer view, which shows whether growth comes from new or returning buyers. The last two lines are the profit view, which tells you how much of the revenue the business keeps. A good KPI set covers all three, because a gain on one line can hide a loss on another.
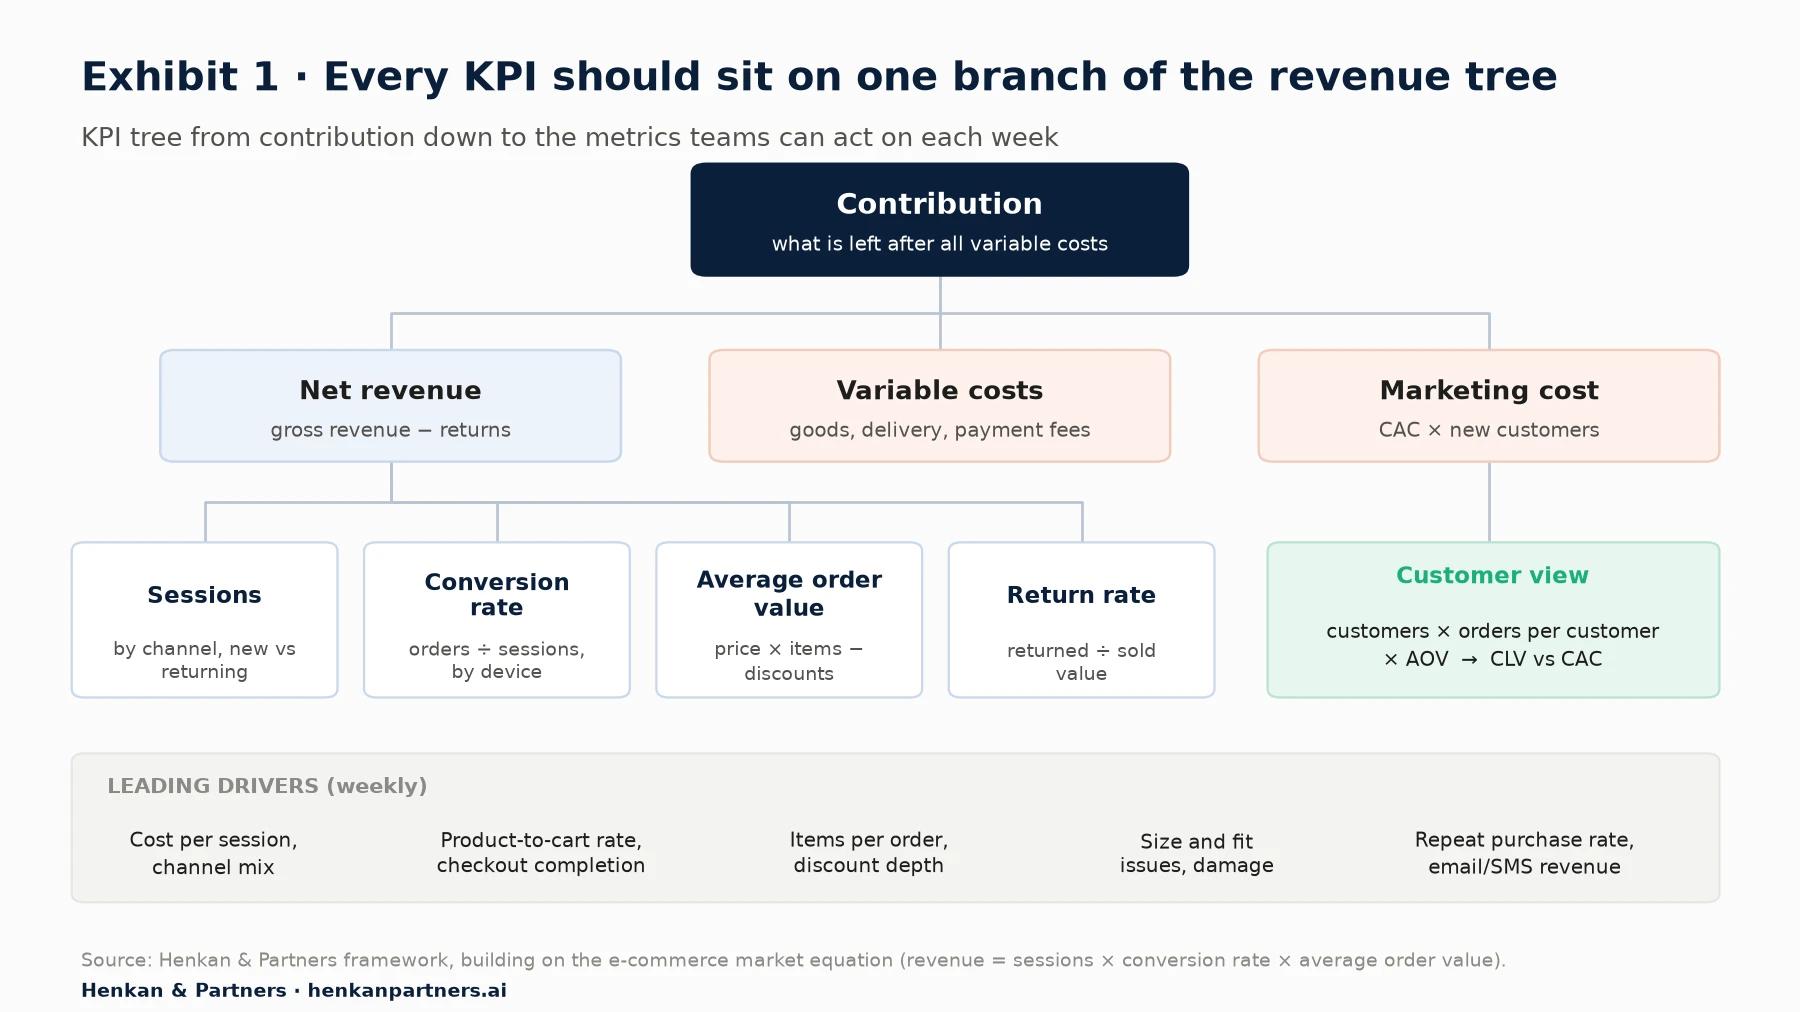
What this shows. Each KPI earns its place by sitting on a branch of the tree. Sessions, conversion rate and order value multiply into revenue; returns, variable costs and marketing are subtracted to reach contribution. The bottom band holds the leading drivers that teams can move within a week, which is where most day-to-day work happens.
For leaders. Ask for results in the shape of the tree: which branch moved, by how much, and what it did to contribution. A revenue gain driven by discounts and paid traffic is a different achievement from one driven by conversion and repeat purchase, even when the totals match.
For marketers. Before launching a campaign, write down which branch it should move. A campaign that lifts sessions but lowers conversion rate and order value may still lose money once acquisition cost is counted.
Section 2 · The KPI set
Fifteen KPIs cover four levels of the business, each with one owner
Different people need different numbers. The board needs to know whether the business is creating value. The e-commerce lead needs to know which lever moved. CRO, UX and CRM teams need diagnostic metrics precise enough to act on. The table below is the set we start from with clients; most businesses need no more than 15 KPIs, plus diagnostic metrics that sit behind them.
The "where to measure" column uses GA4 metric names where GA4 is the right source. For anything involving money after the order (returns, margin, lifetime value), the back office or ERP is the reference, not the analytics tool. If you are new to how GA4 counts sessions, users and events, start with Beyond the Numbers: How GA4 Actually Works.
| KPI | Level | What it tells you | Formula | Where to measure |
|---|---|---|---|---|
| Net revenue | Board | Sales the business keeps after returns | Gross revenue − returns and refunds | Back office or ERP (GA4 Purchase revenue minus Refund amount only if refunds are sent to GA4) |
| Contribution margin | Board | Profit per order before fixed costs | Net revenue − goods − delivery − payment fees − marketing | Finance, ERP |
| CLV : CAC | Board | Whether customers are worth what they cost to win | Customer lifetime value ÷ customer acquisition cost | CRM plus finance and ad platforms |
| Return rate | Board | Share of sales that come back | Value returned ÷ value sold | Back office, returns platform |
| Sessions by channel | E-commerce lead | How much demand you attract, and from where | Count of visits | GA4 Sessions by Session default channel group |
| Conversion rate | E-commerce lead | How well the site turns visits into orders | Orders ÷ sessions | GA4 Session key event rate for the purchase key event, or Transactions ÷ Sessions |
| Average order value (AOV) | E-commerce lead | How much each order is worth | Revenue ÷ orders | GA4 Average purchase revenue; back office for net AOV |
| Revenue per visitor (RPV) | E-commerce lead | Conversion and basket value in one number | Revenue ÷ sessions (or ÷ users) | GA4 calculated metric: Purchase revenue ÷ Sessions |
| Customer acquisition cost (CAC) | E-commerce lead | What a new customer costs | Marketing spend ÷ new customers | Ad platforms plus back office; GA4 First time purchasers as a cross-check |
| Product-to-cart rate | CRO and UX | Whether product pages persuade | Add-to-carts ÷ product views | GA4 Cart-to-view rate |
| Checkout completion rate | CRO and UX | Whether checkout lets people finish | Purchases ÷ checkouts started | GA4 Transactions ÷ Checkouts |
| Cart abandonment rate | CRO and UX | Share of carts that never become orders | 1 − (orders ÷ carts created) | GA4 funnel exploration from add_to_cart to purchase |
| Core Web Vitals pass rate | CRO and UX | Whether real users get a fast, stable page | Share of URLs or origins with good LCP, INP and CLS at the 75th percentile | Chrome UX Report, Search Console, PageSpeed Insights |
| Repeat purchase rate | CRM | Whether first-time buyers come back | Customers with 2+ orders ÷ all customers, over a fixed window | CRM or back office (GA4 undercounts because of cookies and consent) |
| Email and SMS revenue per recipient | CRM | Value created by owned channels | Attributed revenue ÷ recipients | Email or SMS platform, reconciled with back office |
The formulas that matter most
Five formulas do most of the work. Write them into your data dictionary with the exact source of each term, because two teams using the same name for different calculations is the most common reason KPI discussions go nowhere.
Conversion rate = orders ÷ sessions × 100
Average order value = revenue ÷ orders
Revenue per visitor = revenue ÷ sessions = conversion rate × average order value
Cart abandonment rate = 1 − (completed orders ÷ carts created)
Customer lifetime value (contribution) = average order value × orders per customer over the period × contribution margin %
LTV : CAC = customer lifetime value ÷ customer acquisition cost
Revenue per visitor deserves a special mention. Because it multiplies conversion rate by order value, it cannot be improved by trading one against the other, which makes it the best single metric for A/B tests and for comparing traffic sources. Our Essential Guide to Conversion Rate Optimization explains why we prefer it to conversion rate as a primary test metric.
Our view. Decide early whether conversion rate is per session or per user and stick to it. Session-based rates are lower and more sensitive to traffic mix; user-based rates are higher and more sensitive to cookie loss. Neither is wrong, but a switch halfway through a year will create a trend that does not exist.
Section 3 · Conversion benchmarks
Average conversion rates sit between 1.4% and 3.4%, but category and device move them more than anything you do
Ecommerce conversion rate is the most searched benchmark, and the one most often misused. Three recent sources, each measuring a different population, give a sense of the range.
| Source | Population and period | Average conversion rate | Notes |
|---|---|---|---|
| IRP Commerce | UK independent merchants, about 30% of UK e-commerce, August 2026 | 2.23% | Up from 1.85% in August 2025; last-click attribution; vendor data |
| Contentsquare | 99 billion sessions on 6,500 sites, Q4 2024 to Q4 2025 | 3.4% desktop, 2.0% mobile | Returning visitors 2.9%, new visitors 1.7%; vendor data |
| Littledata | 2,800 e-commerce stores, 2023 | 1.4% (Shopify); top 10% above 4.7% | Mobile 1.2%, desktop 1.9%; vendor data |
The differences between these sources are not errors. They reflect who is measured: small UK merchants on one platform, sites using one experience-analytics vendor, or stores connected to one Shopify analytics service. A 2% conversion rate is good in one population and weak in another.
Category is the biggest single driver
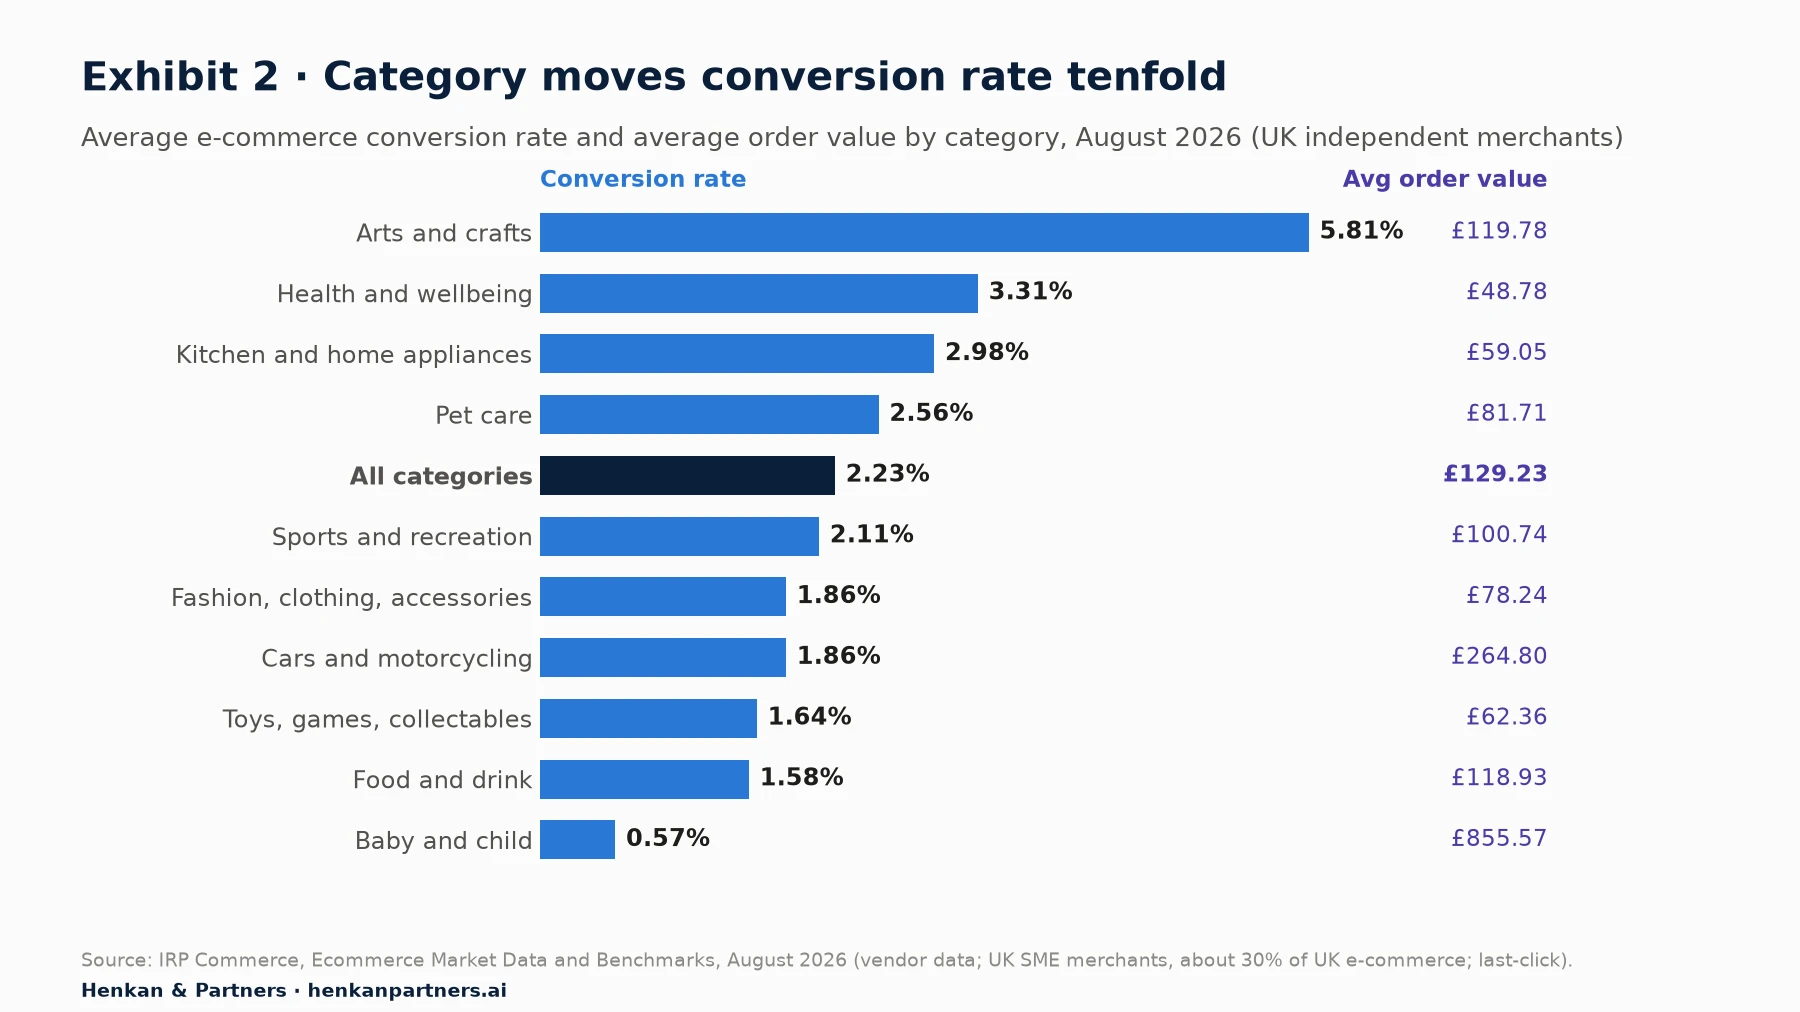
What this shows. Conversion rate varies about tenfold between categories, from 0.57% for baby and child products to 5.81% for arts and crafts. A low conversion rate can go with a high order value: baby and child orders averaged £855.57, the highest of any category. Conversion rate and order value have to be read together, which is why revenue per visitor is a better yardstick across categories.
Device and visitor type come next
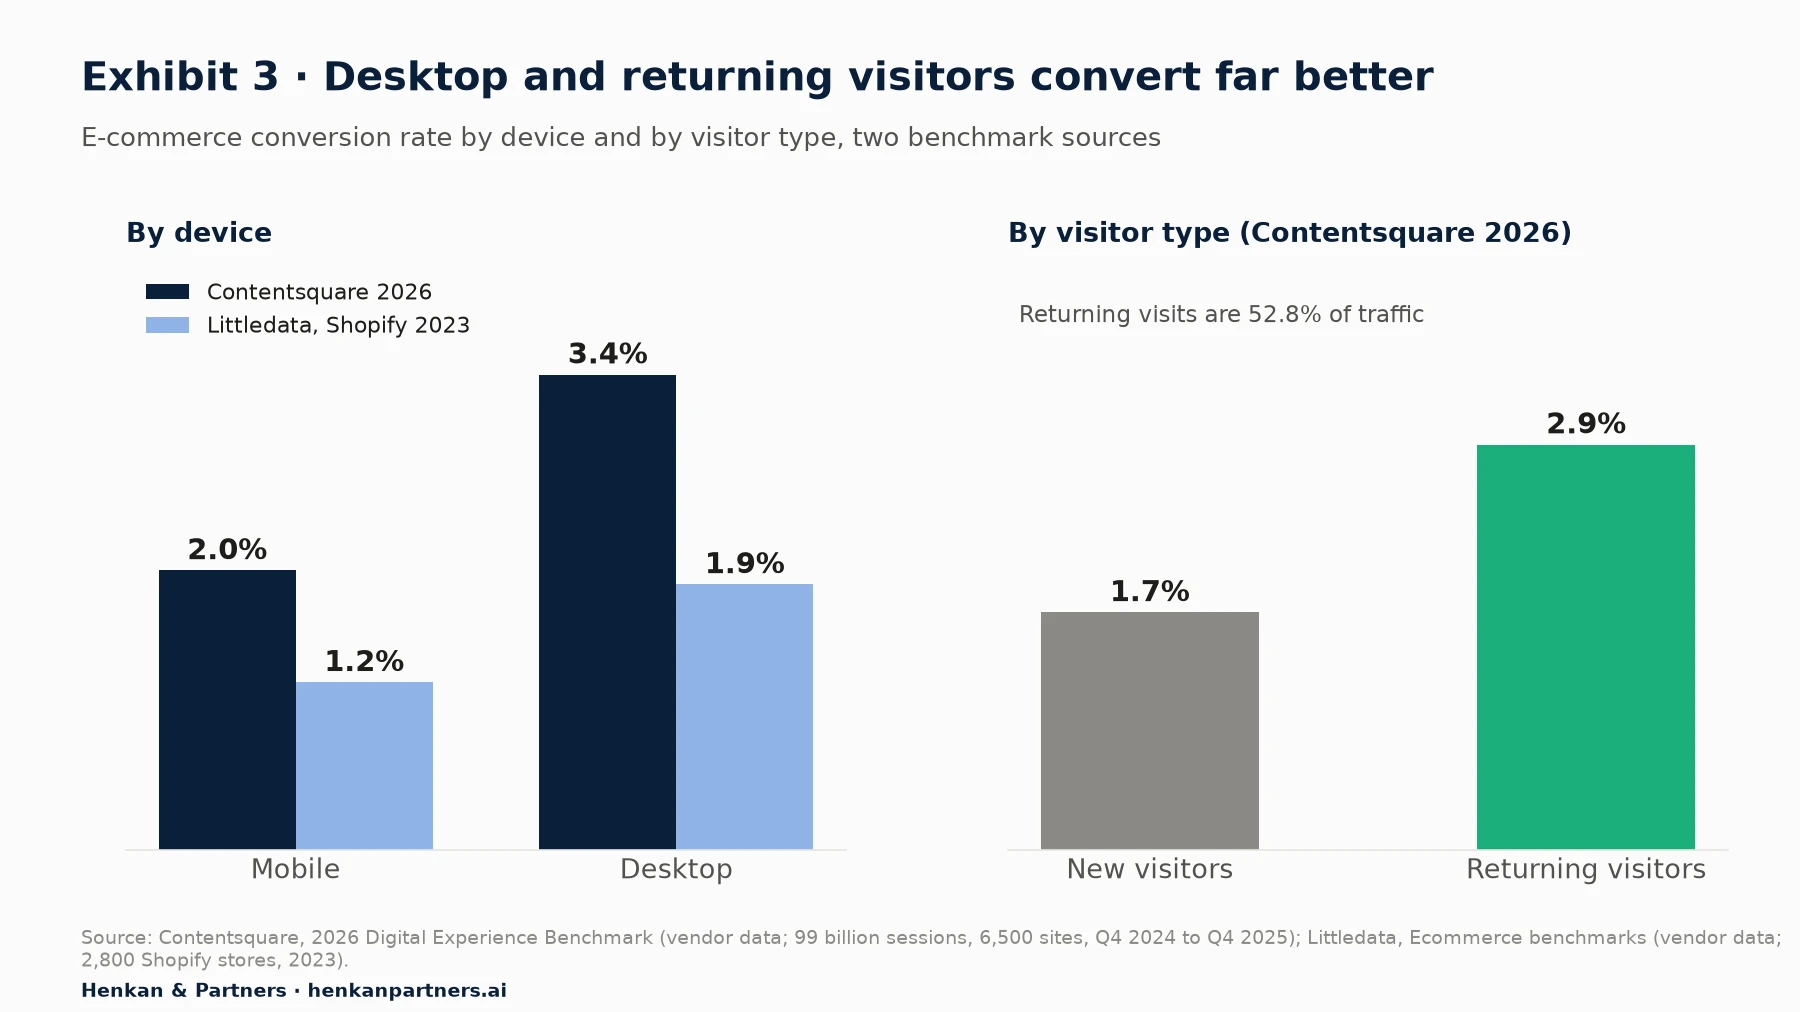
What this shows. In both datasets desktop converts roughly 1.6 to 1.7 times as well as mobile, even though Contentsquare finds that mobile brings 69.9% of traffic. Returning visitors convert at 2.9% against 1.7% for new visitors. A shift in traffic mix towards mobile or new visitors will lower the blended conversion rate even if nothing on the site has changed.
Channel matters too. Contentsquare reports that paid search converted at 2.8%, the highest of the paid channels, while organic social converted at 0.7%. Traffic referred by AI assistants converted at 1.3%, up 55% year on year, while the volume of AI-referred traffic grew 632%. We cover how channels differ in cost and quality in The Essential Guide to E-commerce Acquisition and Retention Channels.
For marketers. Never report one blended conversion rate. Report it at least by device and by new versus returning visitors, and by channel when you judge campaigns. Otherwise every change in traffic mix will look like a change in site performance.
Section 4 · Basket, customers and returns
Order value, repeat purchase and returns decide what a customer is really worth
Conversion rate gets the attention, but the terms that follow it decide profit. A customer who orders once and returns half the parcel is worth far less than one who orders three times a year and keeps everything.
Average order value: know your own distribution
IRP Commerce reported an average order value of £129.23 across its UK merchants in August 2026, up 6.28% on a year earlier, with category averages from £48.78 in health and wellbeing to £855.57 in baby and child. Littledata's 2023 benchmark gave an overall average of US$101 (US$85 for Shopify stores), with the top 10% of stores above US$534. These figures describe the populations measured; your own AOV depends mainly on your price points and assortment.
The more useful work is internal. Look at the distribution of order values, not just the mean: a few very large orders can lift the average while most customers buy one item. Track items per order and discount depth alongside AOV so that you can tell whether a rise came from bigger baskets or from higher prices.
Repeat purchase and retention: most first-time buyers never return
Retention figures vary with the definition used, so always check it. Bluecore's 2025 Customer Growth Benchmarks, as reported by Shopify, put the average retention rate for retailers (the share of prior-year buyers who buy again) at 27.4%, from 19.1% in jewellery and accessories to 41.2% in health and beauty, where products need replenishing. Bluecore's report covers more than 100 retailers across seven verticals for calendar year 2024. It also found that active repeat buyers spent 69.2% more than new buyers in 2023 and that only about 6 in 100 new customers were still active buyers three years later (vendor data).
The practical lesson is to measure repeat purchase rate by cohort: of the customers who first bought in a given month, what share bought again within 90, 180 and 365 days? A cohort view separates the effect of acquisition (who you bring in) from the effect of experience and CRM (whether they come back). GA4 is a weak tool for this because cookie loss and consent refusals break the link between visits; use your back office or CRM.
Customer lifetime value and CAC: use the 3:1 ratio as a rule of thumb, not a law
Customer lifetime value (CLV) estimates what a customer is worth over a period. Customer acquisition cost (CAC) is what you spend to win one. The ratio between the two is widely quoted as a health check. Its best-known source is David Skok's SaaS metrics guidance, which suggests that LTV should be more than three times CAC and that CAC should be recovered in less than 12 months. Skok wrote this for software businesses with gross margins of 80% or more, and he notes that many successful SaaS firms now take around 20 months to recover CAC.
For e-commerce, treat 3:1 as a rule of thumb and apply it to contribution, not revenue, because product and delivery costs take a far bigger share of each order than in software. A worked example makes the point (illustrative figures):
AOV = €80, orders per customer over 3 years = 2.5, contribution margin = 30%
CLV (revenue) = €80 × 2.5 = €200
CLV (contribution) = €200 × 30% = €60
CAC = €40
LTV : CAC on revenue = 5.0   |   LTV : CAC on contribution = 1.5
On revenue the business looks very healthy at 5:1. On contribution it barely covers the cost of winning the customer. The same data can lead to opposite decisions depending on which version of CLV is used, which is why the definition belongs in the KPI dictionary.
Returns: the KPI that marketing dashboards forget
The National Retail Federation and Happy Returns estimated that US retailers would see 19.3% of online sales returned in 2025, against 15.8% of total retail sales, or $849.9 billion in returned merchandise. They also estimated that 9% of all returns were fraudulent. The survey covered 358 e-commerce professionals at US retailers with more than $500 million in revenue and 2,006 consumers.
Returns rarely appear in analytics tools, because the web analytics purchase event fires before the parcel leaves the warehouse. Yet a campaign, a product page change or a size guide can move the return rate as much as it moves conversion. Join return data to orders at line level so that you can see return rates by product, channel, campaign and test variant.
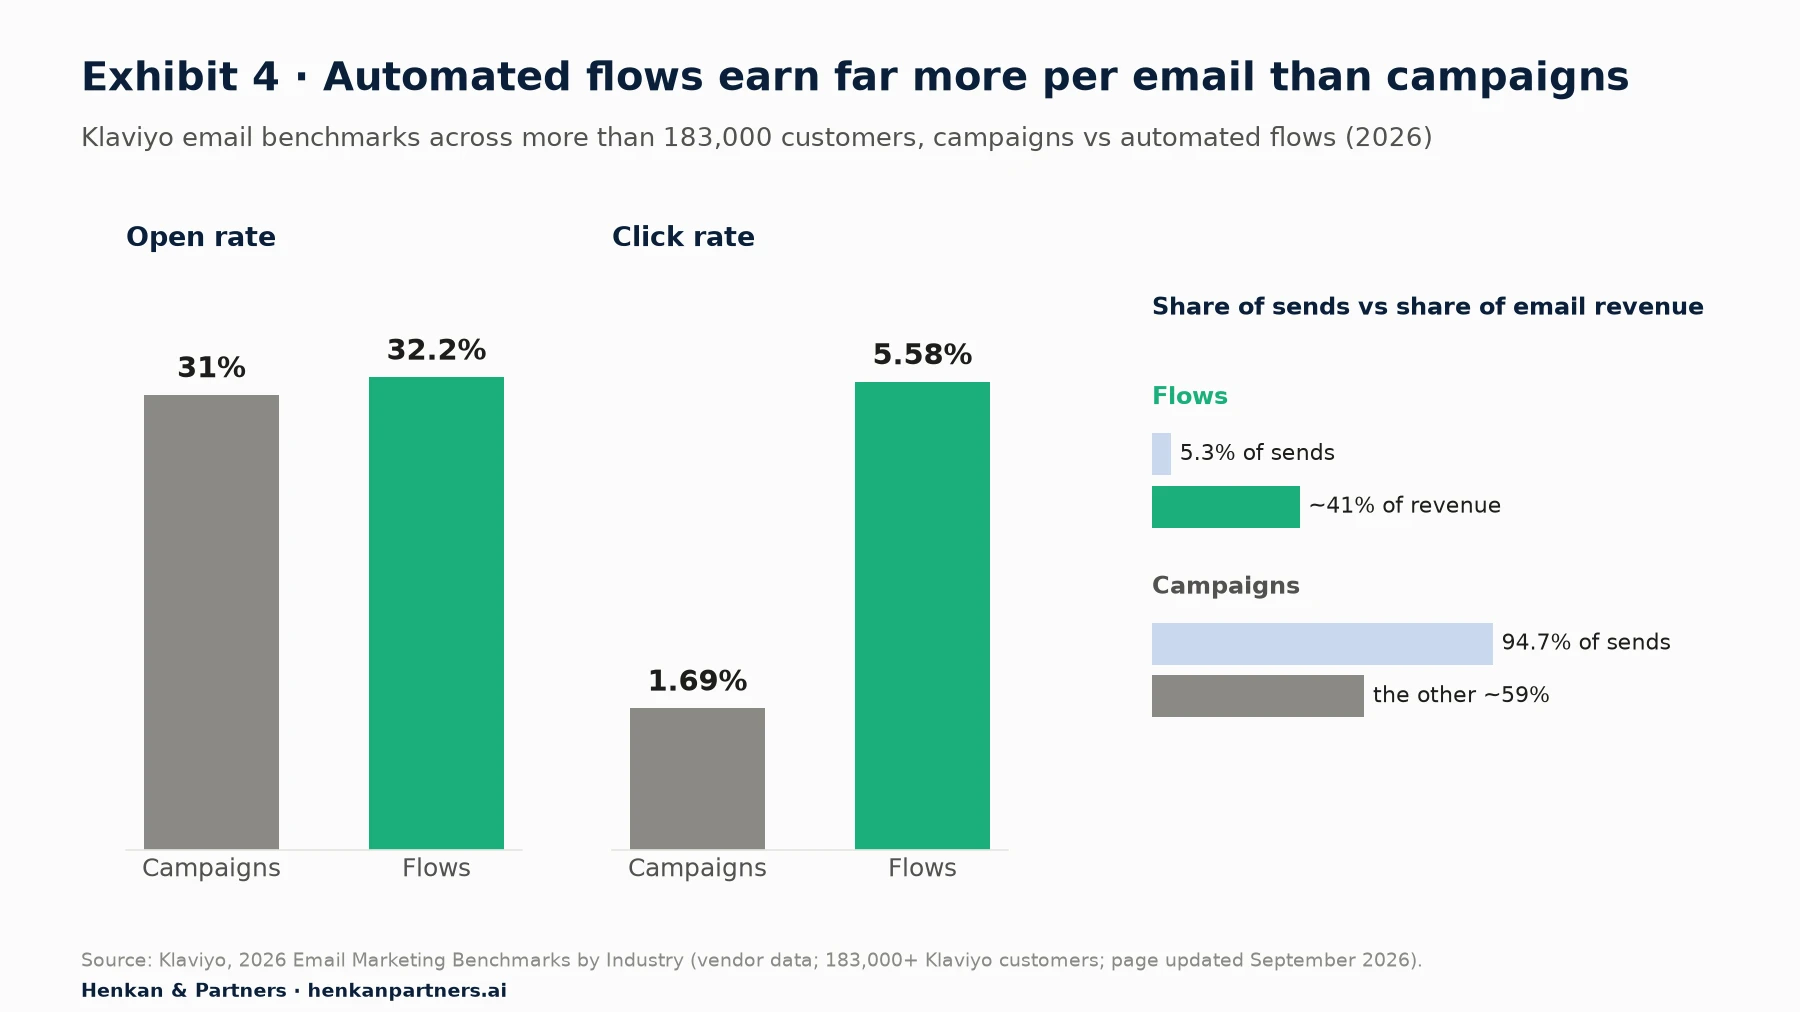
What this shows. Automated flows such as welcome, abandoned-cart and post-purchase emails get similar open rates to campaigns but more than three times the click rate. Klaviyo reports that flows generate nearly 41% of email revenue from 5.3% of sends. For CRM teams, revenue per recipient by flow is a more useful KPI than open rate, because it measures money rather than attention.
Klaviyo's figures are vendor data from its own customer base: an average campaign open rate of 31% and click rate of 1.69%, and a flow click rate of 5.58%, with placed-order rates ranging by industry from 0.97% to 1.34% for campaigns and 1.62% to 2.17% for flows. We did not find SMS benchmarks from a source we could verify, so we have left them out.
Section 5 · Funnel and experience
Cart abandonment, engagement and speed show where the funnel leaks
Outcome KPIs tell you that something changed. Funnel and experience metrics tell you where. Three families are worth tracking.
Cart abandonment: about 70% is normal, the reasons are what matter
Baymard Institute's meta-analysis of 50 studies puts the average documented online cart abandonment rate at 70.22% (list updated September 2025). A high rate is not in itself a problem: many shoppers use the cart as a wish list or are just browsing. Once those shoppers are set aside, the top reasons in Baymard's survey were extra costs such as delivery, taxes and fees (40%), slow delivery (20%), not trusting the site with card details (19%) and being forced to create an account (18%). Baymard estimates that a large e-commerce site could lift its conversion rate by 35.26% through checkout design improvements alone.
Littledata's 2023 benchmark splits the funnel further: an average add-to-cart rate of 4.6% (top 10% above 9.6%) and an average checkout completion rate of 45% (top 10% above 66%), with mobile at 44% and desktop at 49%. Track both, because they point to different fixes: product pages and merchandising for the first, checkout and payment for the second.
Engagement and bounce: useful as diagnostics, weak as targets
In GA4, an engaged session lasts longer than 10 seconds, has a key event or has at least two page or screen views; engagement rate is the share of sessions that are engaged, and bounce rate is simply the share that are not. Contentsquare's 2026 benchmark found that overall engagement fell 10% year on year and time on site 7%. Desktop sessions lasted 4 minutes 46 seconds against 2 minutes 20 seconds on mobile. One visit in three started on a product detail page, and those pages had a 61% bounce rate.
Engagement metrics are good at spotting broken pages or poor landing-page matches. They make poor targets: a faster checkout lowers time on site, and a clear product page can satisfy a visitor in one view. Use them to diagnose, not to reward.
Page speed: fewer than half of mobile sites pass Core Web Vitals
Google's Core Web Vitals measure loading (Largest Contentful Paint, LCP, good at 2.5 seconds or less), responsiveness (Interaction to Next Paint, INP, good at 200 milliseconds or less) and visual stability (Cumulative Layout Shift, CLS, good at 0.1 or less), each at the 75th percentile of real page loads.
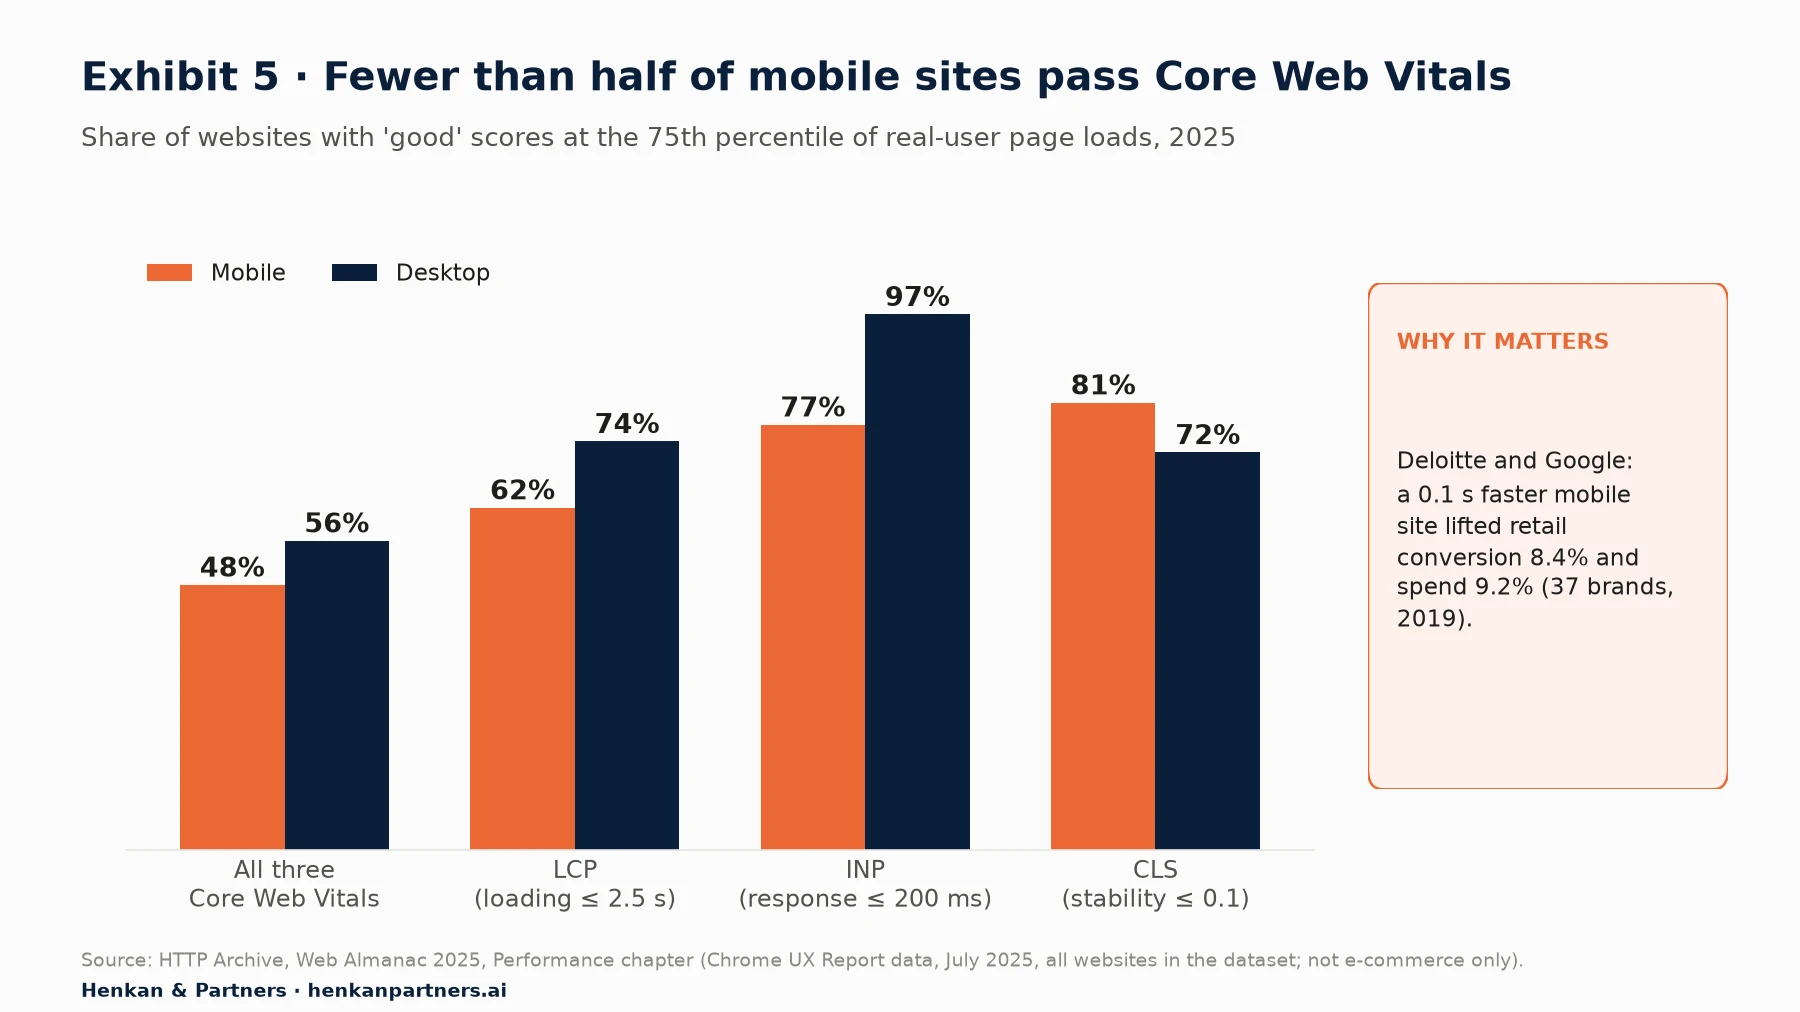
What this shows. Only 48% of mobile websites and 56% of desktop websites passed all three Core Web Vitals in July 2025. Loading (LCP) is the weakest metric on mobile, at 62%. In the Deloitte and Google study of 37 brand sites, a 0.1-second improvement in mobile speed was associated with 8.4% more retail conversions and 9.2% higher spend. The population is all websites, so treat it as a floor for comparison rather than an e-commerce benchmark.
Section 6 · Using benchmarks
Benchmarks tell you where to look; only your own trend tells you whether you improved
Benchmarks are useful for one thing: spotting where you might be far off the norm, so you know where to dig first. They are dangerous when they become targets. Five reasons explain why a cross-site figure rarely compares like with like.
- Population. IRP measures UK independent merchants, Littledata measures stores connected to its service, Contentsquare measures sites using its own tools. None is "the market".
- Definitions. Conversion rate can be per session or per user, and orders can be counted before or after cancellations. GA4 key events, platform dashboards and back offices often disagree on both.
- Attribution and tracking quality. IRP uses last-click attribution; other sources use the analytics tool's own model. Consent refusals, ad blockers and bot traffic change the denominator by different amounts on each site.
- Mix. A site with 80% mobile traffic or a big paid social budget will have a lower blended conversion rate than one with loyal desktop buyers, with no difference in quality.
- Time. Benchmarks move with the calendar and the economy. IRP's own figures show arts and crafts conversion up 45% and kitchen and home appliances down 14% year on year in the same month.
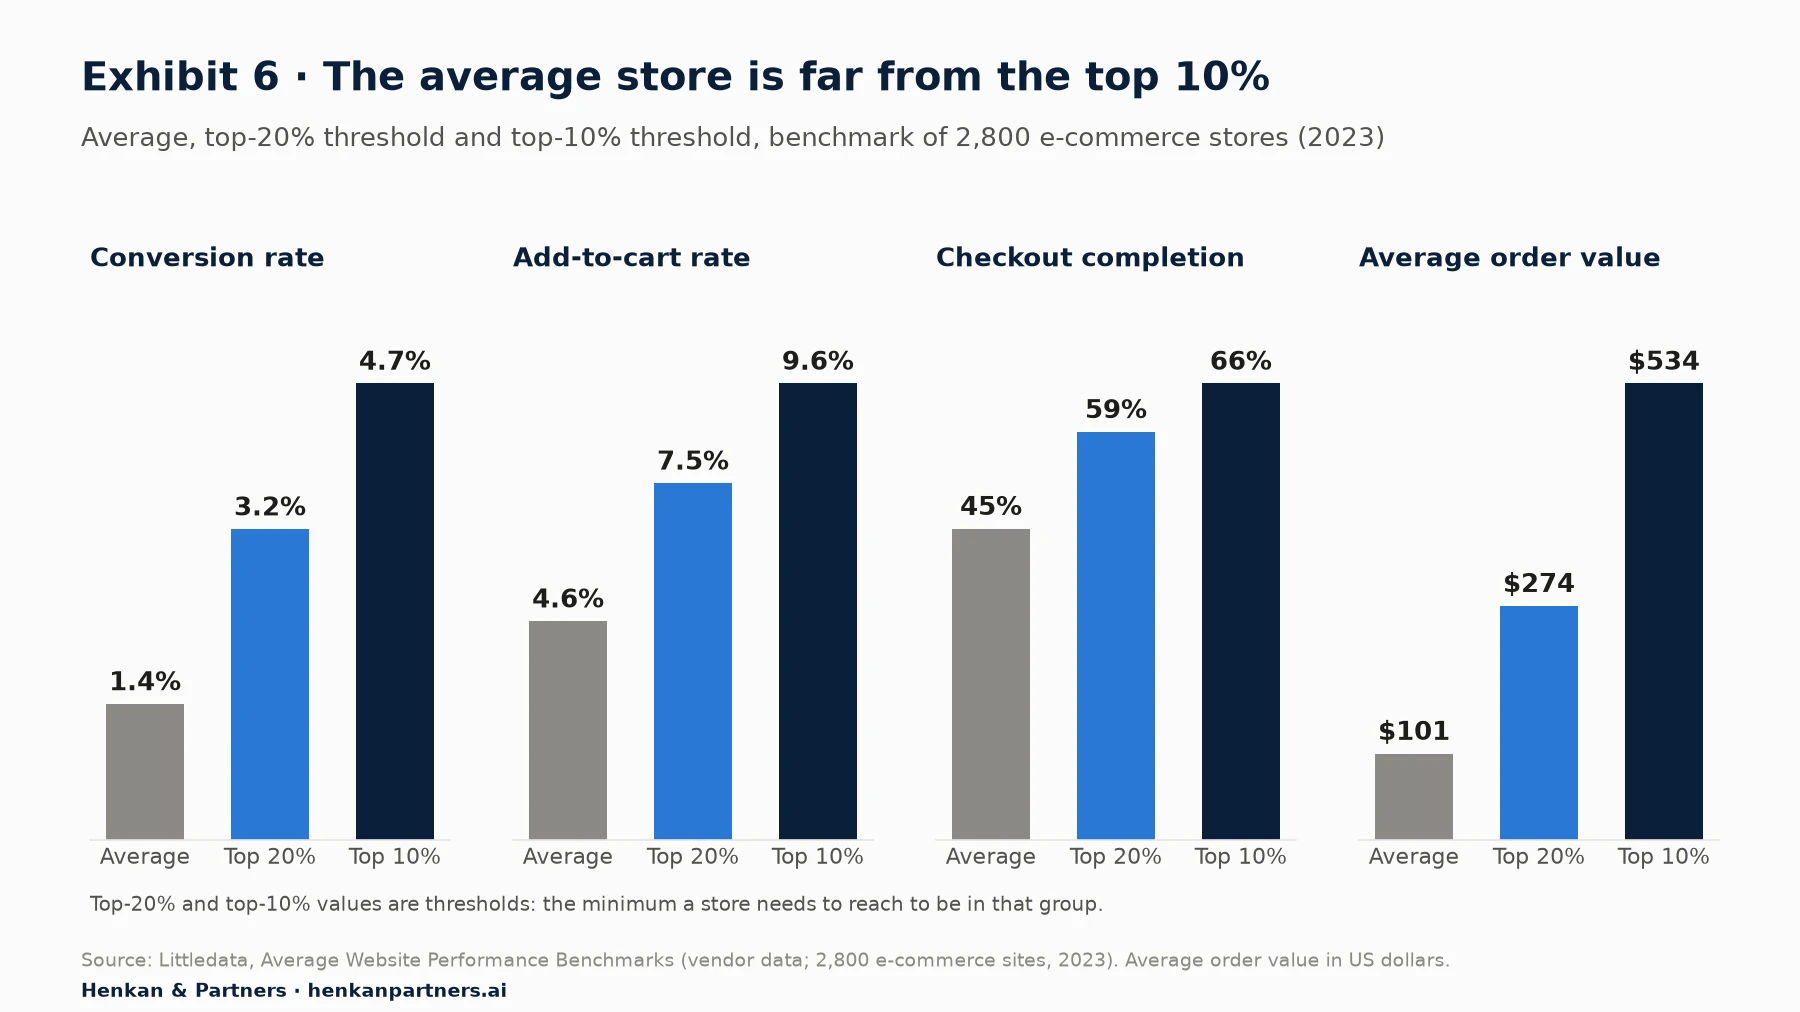
What this shows. On every metric the top-10% threshold sits well above the average, from about one and a half times for checkout completion to more than five times for order value. Gaps this wide point to skewed distributions, in which a minority of strong stores pull the average up. Before comparing yourself to an average, ask what population it describes and whether a median would tell a different story.
How to benchmark against yourself
- Year on year, same period. Compare this week with the same week last year, aligned by weekday, and flag promotions and holidays on both sides. Month on month comparisons can be dominated by seasonality.
- By segment. Keep device, new versus returning and channel apart. A flat total can hide a mobile gain and a desktop loss.
- By cohort. For retention and lifetime value, compare customers acquired in the same month, not all customers at once.
- With a control where you can. When you change something big, keep a holdout group or run an A/B test. A before-and-after comparison cannot separate your change from everything else that happened.
For leaders. Set targets on your own trajectory ("lift mobile revenue per visitor by 10% year on year"), not on a benchmark ("reach 3% conversion"). The first is something a team can own; the second may be impossible or trivial depending on your category and traffic mix.
Section 7 · Leading and lagging
Leading indicators let you act before the monthly revenue number arrives
A lagging indicator reports an outcome after the fact: revenue, contribution, lifetime value. A leading indicator moves earlier and predicts the outcome: product-to-cart rate, checkout errors, delivery promise, email sign-ups. Boards look at lagging indicators; teams need leading ones, because by the time monthly revenue shows a problem, a month of sales has been lost.
| Lagging outcome | Leading indicators to watch | Typical cadence |
|---|---|---|
| Net revenue | Sessions by channel, product-to-cart rate, checkout completion, payment error rate | Daily alerts, weekly review |
| Contribution margin | Discount depth, share of orders below free-delivery threshold, cost per session | Weekly |
| Return rate | Size-guide use, product review mentions of fit or quality, share of multi-size baskets | Weekly |
| Customer lifetime value | Second-order rate within 90 days, email and SMS opt-in rate, account creation | Monthly by cohort |
| CAC | Cost per session and cost per new customer by campaign, new-visitor conversion rate | Weekly |
Test your leading indicators. If product-to-cart rate rises for a month and revenue does not follow, either the indicator is not leading or something further down the funnel is broken. Both are worth knowing. The Essential Guide to Product Analytics explains how to analyse behaviour at event level, which is how you test links like these.
Section 8 · Pitfalls
The most common KPI mistakes make the dashboard look better while the business gets worse
Conversion rate goes up while profit falls
This is the classic trap, and discounts are a common cause. A worked example with illustrative figures:
Before: 100,000 sessions × 2.0% conversion = 2,000 orders × €80 AOV = €160,000 revenue
  Product cost €40, delivery and payment €12 per order → contribution before marketing = 2,000 × (€80 − €40 − €12) = €56,000
After a 15% site-wide discount: conversion rises to 2.3% (+15%), AOV falls to €68
  2,300 orders × €68 = €156,400 revenue → contribution before marketing = 2,300 × (€68 − €40 − €12) = €36,800
Result: conversion +15%, revenue −2%, revenue per visitor −2%, contribution −34%
The conversion rate chart shows a win. Revenue per visitor shows a small loss. Contribution shows a large one. This is why every test and promotion should report revenue per visitor as a minimum, and contribution when margin data is available. The same pattern appears with free-delivery thresholds, generous return policies and aggressive retargeting.
Averages hide distributions
An average order value of €80 can mean most orders at €80, or most at €30 with a few at €500. A conversion rate of 2% can mean every page converts evenly, or one landing page converts at 6% while the rest struggle. Look at distributions and at segments before drawing conclusions, and be wary of any test result driven by a handful of very large orders. Median order value and trimmed means (excluding the top 1% of orders) are good companions to AOV.
GA4 and the back office never match exactly
GA4 will almost always show fewer orders and less revenue than your back office. Common causes include ad blockers and privacy browsers, visitors who refuse consent, tags that fire just before a redirect to a payment page, test orders, and cancelled orders that GA4 never hears about. Julius Fedorovicius of Analytics Mania writes that, in his experience, fewer than 5% of transactions missing from GA4 is lucky and 10% is a good result; in regions under GDPR he reports that far larger losses can be normal because of consent refusals (practitioner estimate).
The fix is not to chase perfect agreement but to agree which source is the reference for which KPI. Use the back office for revenue, orders, returns and customers; use GA4 for behaviour, funnels and ratios. Track the gap between the two as a data-quality KPI: if it jumps, something broke. Our focus on which custom dimensions to collect in your e-commerce analytics shows how to pass an order ID and other keys so the two can be joined.
Consent mode changes what you are measuring
With Google's consent mode, GA4 can use behavioural modelling to estimate the activity of visitors who refuse analytics cookies, based on the behaviour of similar visitors who accept them. Eligibility requires consent mode on all pages, at least 1,000 events a day with analytics storage denied for at least 7 days, and at least 1,000 daily users with analytics storage granted for at least 7 of the previous 28 days. Modelled data is not available in audiences, user explorer, cohort and lifetime explorations, retention reports, predictive metrics or data exports such as BigQuery.
Two consequences follow. First, a change in consent banner design or consent rate will move your KPIs even though customer behaviour has not changed. Second, figures in the GA4 interface and in BigQuery will differ. Record consent rate as a KPI in its own right and annotate every banner change. Our focus on user consent in e-commerce before 2027 covers the regulatory side.
Our view. Most KPI disputes we are asked to settle are not about performance; they are about definitions and data sources. Half a day spent writing a one-page KPI dictionary (name, formula, source, owner, cadence) saves weeks of arguments later.
Section 9 · Dashboard design
A good KPI dashboard has three layers and fewer than twenty headline numbers
A dashboard is a tool for decisions, not a data dump. In our experience, the design that works best has three layers, each with its own audience and rhythm.
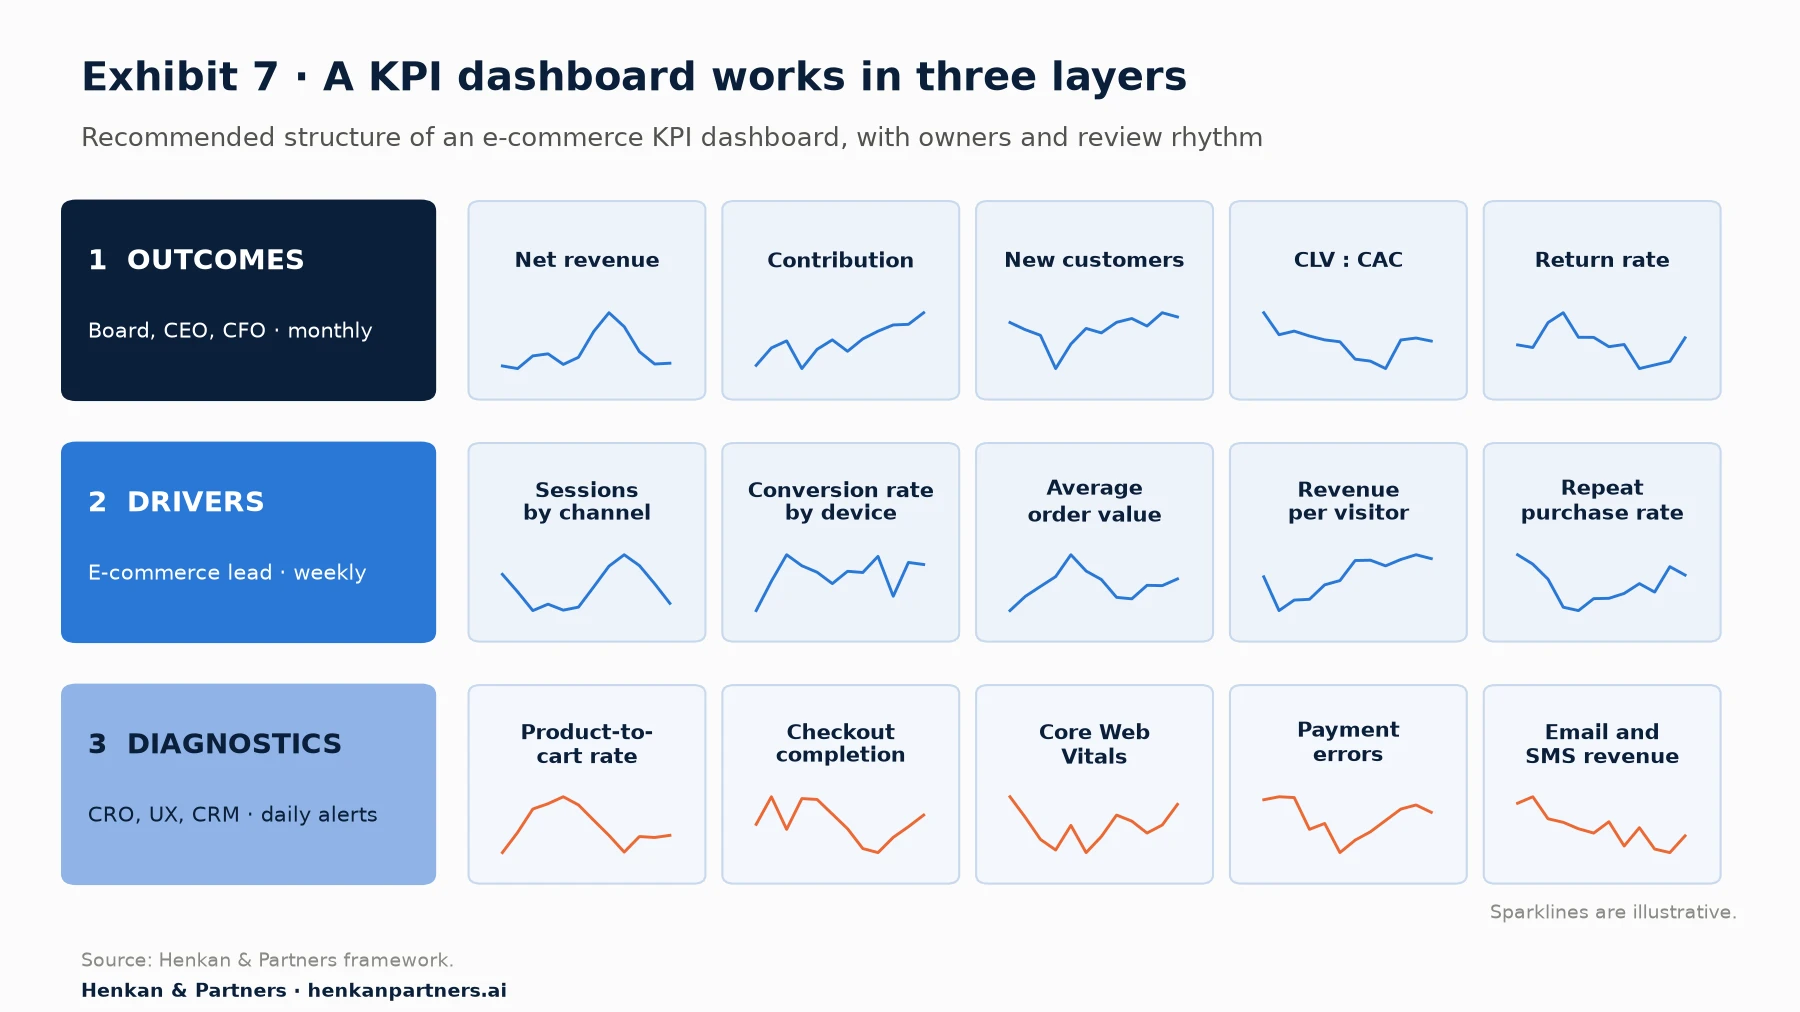
What this shows. Outcomes sit at the top and change slowly. Drivers explain the outcomes and are reviewed weekly. Diagnostics run underneath with automated alerts, so that the team hears about a broken checkout within hours rather than at the monthly review. Each layer should explain the one above it.
Six design rules make the difference between a dashboard that is used and one that is ignored:
- Show every KPI against a comparison. Same period last year and target, never a number on its own.
- Split by the dimensions that matter. Device, new versus returning, channel. Put the blended figure first, the split one click away.
- Label the source and definition. A small note under each tile ("back office, net of returns") prevents most disputes.
- Annotate events. Promotions, releases, tracking changes and consent-banner changes, directly on the charts.
- Limit the headline numbers. If the first screen has more than 15 to 20 numbers, nobody will read it.
- Assign an owner to every KPI. A metric nobody owns will not improve.
For the analytics foundations underneath the dashboard, from data collection to reporting, see The Essential Guide to Web Analytics.
Section 10 · AI and KPIs
AI makes KPI monitoring continuous, but only on top of definitions you trust
AI is changing two parts of KPI work: spotting that something moved, and asking why.
Anomaly detection is already built in
GA4's anomaly detection uses a Bayesian state-space time-series model trained on past data: two weeks for hourly anomalies, 90 days for daily and 32 weeks for weekly. It flags a value as anomalous when it falls outside the model's credible interval. Custom insights in GA4 can use a "has anomaly" condition so that you are alerted without setting a threshold yourself.
In our experience this works well for sudden breaks, such as a tag that stops firing or a payment method that fails. It works less well for slow drifts, for small segments, and around promotions the model has not seen before. Use it as a first line of defence, with explicit alerts on the handful of diagnostics that matter most, such as checkout completion and payment errors.
AI assistants can now query analytics directly
The Model Context Protocol (MCP) is an open standard that lets AI assistants call external tools. Google's Analytics team publishes an official, read-only MCP server for GA4, with tools such as run_report, run_funnel_report and run_realtime_report. Connected to an assistant, it lets a manager ask "why did mobile revenue per visitor fall last week?" and get an answer built from live GA4 reports rather than a screenshot.
The risks are real. An assistant can pick the wrong metric (users instead of sessions), ignore sampling or thresholding, compare periods with different consent rates, or state a cause when it has only found a correlation. The KPI dictionary becomes more important, not less: give the assistant the definitions, the reference source for each KPI and the known data-quality caveats, and ask it to show the query behind every number.
Disclosure: Henkan & Partners builds Stuart, an analytics platform that connects sources such as GA4, Contentsquare, Kameleoon and Qualtrics and exposes them to AI assistants via MCP. We use it in client work.
For leaders. AI assistants make it cheap to ask questions of your data. That raises the value of clean tracking and shared definitions, because wrong answers now arrive faster and sound more confident. Budget for data quality before you budget for AI analytics.
Section 11 · What to do next
What to do next: five steps to a KPI set your team will use
1. Draw your KPI tree
Start from contribution and write down each branch down to the weekly drivers, as in Exhibit 1. Agree which branch each team owns. If a metric on your current dashboard does not fit on the tree, question why it is there.
2. Write a one-page KPI dictionary
For each of your 12 to 15 KPIs, record the name, formula, reference source, owner and review cadence. Settle the session-versus-user question and which system is the reference for revenue and orders.
3. Build your own baseline before looking outward
Pull 24 months of your KPIs by device, new versus returning and channel. Mark promotions, releases and tracking changes. Only then compare with the benchmarks in this article, and only to decide where to investigate first.
4. Measure data quality as a KPI
Track the gap between GA4 and the back office on orders and revenue, and your consent rate. A sudden change in either is a tracking problem until proven otherwise.
5. Connect KPIs to action
Set up alerts on the diagnostic layer, a weekly review of drivers and a monthly outcome review. Link each KPI movement to a hypothesis you can test. If you want help designing the tree, the dictionary or the dashboard, or connecting your KPIs to an AI assistant, talk to us.
FAQ
Frequently asked questions about ecommerce KPIs and benchmarks
Frequently asked questions
What are ecommerce KPIs?
Ecommerce KPIs are the few metrics an online business uses to judge progress towards its goals. The core set is conversion rate, average order value, revenue per visitor, customer acquisition cost, customer lifetime value, repeat purchase rate and return rate, which together explain revenue and contribution margin.
What is a good ecommerce conversion rate?
It depends on category, device and traffic mix. IRP Commerce reported a UK average of 2.23% in August 2026, from 0.57% to 5.81% by category. Contentsquare measured 3.4% on desktop and 2.0% on mobile. Among 2,800 stores benchmarked by Littledata, the average was 1.4% and the top 10% started at 4.7%. Your own year-on-year trend is a better guide than any of these.
What is the average cart abandonment rate?
Baymard Institute's average across 50 studies is 70.22%. Many abandoners are just browsing; among the rest, unexpected extra costs such as delivery and taxes are the most common reason (40%).
What is a good average order value?
There is no universal figure. IRP Commerce reported £129.23 for UK independent merchants in August 2026, ranging from £48.78 to £855.57 by category. Littledata reported US$101 on average across its 2023 benchmark. Track your own AOV alongside items per order and discount depth.
How do you calculate customer lifetime value?
A simple version is average order value × number of orders per customer over a set period × contribution margin. Calculate it by acquisition cohort and on contribution rather than revenue, so that it can be compared with customer acquisition cost.
What is a good LTV to CAC ratio?
A ratio of 3:1 is a widely used rule of thumb that comes from SaaS guidance by David Skok, written for businesses with high gross margins. For e-commerce, apply it to lifetime value measured on contribution, not revenue, and treat it as a guide rather than a target.
What is revenue per visitor and why does it matter?
Revenue per visitor is revenue divided by sessions (or users), which equals conversion rate × average order value. It cannot be improved by trading conversion against basket size, which makes it the best single KPI for A/B tests and channel comparisons.
Why doesn't GA4 revenue match my back office?
Ad blockers, consent refusals, tags that fire before payment redirects, test orders and cancellations all create gaps. Use the back office as the reference for revenue and orders, GA4 for behaviour and ratios, and track the gap as a data-quality KPI.
Which ecommerce metrics should be on a dashboard?
Use three layers: outcomes for the board (net revenue, contribution, new customers, CLV to CAC, return rate), drivers for the e-commerce lead (sessions, conversion rate, AOV, revenue per visitor, repeat purchase rate) and diagnostics with alerts for CRO, UX and CRM teams.
Key terms
- KPI (key performance indicator)
- A metric tied to a business goal and owned by someone. It matters because it separates the few numbers that drive decisions from the hundreds a tool can report.
- Conversion rate
- Orders divided by sessions (or users). It shows how well the site turns visits into orders, but moves with traffic mix, so it must be read by device and channel.
- Average order value (AOV)
- Revenue divided by orders. It matters because conversion gains can be wiped out by smaller baskets, and vice versa.
- Revenue per visitor (RPV)
- Revenue divided by sessions, equal to conversion rate × AOV. It is the best single KPI for tests because it cannot be gamed by trading one term against the other.
- Cart abandonment rate
- The share of carts created that do not become orders. It points to friction in cost, delivery, trust or checkout design; Baymard's average is 70.22%.
- Checkout completion rate
- Purchases divided by checkouts started. It isolates problems in checkout and payment from problems on product pages.
- Customer acquisition cost (CAC)
- Marketing spend divided by new customers won. It matters because growth bought at a CAC higher than customer value destroys profit.
- Customer lifetime value (CLV)
- The value a customer brings over a period, best measured on contribution and by cohort. It sets how much you can afford to spend to acquire a customer.
- Repeat purchase rate
- The share of customers who order more than once in a set window. It is the clearest early signal of retention and future lifetime value.
- Contribution margin
- Revenue after returns, cost of goods, delivery, payment fees and marketing. It shows whether growth makes money before fixed costs.
- Leading indicator
- A metric that moves before an outcome and helps predict it, such as product-to-cart rate. It lets teams act before revenue is lost.
- Lagging indicator
- A metric that records an outcome after the fact, such as monthly revenue. It confirms results but arrives too late to steer day-to-day work.
- Core Web Vitals
- Google's real-user measures of loading (LCP), responsiveness (INP) and visual stability (CLS). They matter because faster, more stable pages are associated with higher conversion.
- Engagement rate
- In GA4, the share of sessions that last over 10 seconds, include a key event or view at least two pages. Useful as a diagnostic, weak as a target.
- Consent mode
- Google's mechanism for adjusting tags to visitors' consent choices, with optional behavioural modelling. It matters because consent rates change what your KPIs measure.
Sources
All sources were checked in September 2026. IRP Commerce, Contentsquare, Littledata, Bluecore and Klaviyo figures are vendor data describing each vendor's own clients or platform users; Baymard Institute figures come from its own research and a meta-analysis of published studies. Populations and dates are stated next to each figure. The KPI tree (Exhibit 1), the KPI table (Table 1), the leading and lagging table (Table 3), the dashboard design (Exhibit 7) and the worked examples are Henkan & Partners frameworks with illustrative figures. The LTV to CAC ratio of 3:1 is a rule of thumb, not a benchmark.
- IRP Commerce (2026). Ecommerce Market Data and Ecommerce Benchmarks.
- Contentsquare (2026). Conversion Rates in 2026: Benchmarks, AI, and What's Driving Growth.
- Contentsquare (2026). Benchmarks: What Does Engagement Look Like in 2026?.
- Littledata (2023). Average Ecommerce Conversion Rate.
- Littledata (2023). Average Website Performance Benchmarks.
- Baymard Institute (2025). Cart Abandonment Rate Statistics.
- HTTP Archive (2025). Web Almanac 2025: Performance.
- Google, web.dev (n.d.). Web Vitals.
- Google, web.dev (2020). Milliseconds make millions.
- National Retail Federation (2025). Consumers Expected to Return Nearly $850 Billion in Merchandise in 2025.
- Shopify (2026). Average Customer Retention Rate by Industry.
- Bluecore (2025). Customer Growth Benchmarks Report.
- Klaviyo (2026). Email Marketing Benchmarks by Industry.
- Skok, D., For Entrepreneurs (n.d.). SaaS Metrics 2.0: A Guide to Measuring and Improving What Matters.
- Google Analytics Help (n.d.). GA4 anomaly detection.
- Google Analytics Help (n.d.). GA4 behavioral modeling for consent mode.
- Google Analytics Help (n.d.). GA4 engagement rate and bounce rate.
- Google Analytics (n.d.). Google Analytics MCP server. GitHub.
- Fedorovicius, J., Analytics Mania (n.d.). Missing Google Analytics 4 transactions? Here are the solutions.
- Fedorovicius, J., Analytics Mania (n.d.). Ecommerce conversion rate in Google Analytics 4.