Focus
Understanding the E-commerce Market Equation
Alexandre Suon · 2026-09-27
Online revenue looks like one number, but it is the product of a few simple factors: how many people visit, how many buy, how much they spend and how often they come back. This focus explains the e-commerce market equation, from market share to profit per order, shows which lever moves profit most, and how to use it to decide where to invest.
Executive summary
- Online revenue is a multiplication, not a sum. Revenue equals sessions × conversion rate × average order value, or customers × orders per customer × average order value. Because the factors multiply, a 5% gain on each of three levers gives a 15.8% gain in revenue.
- The online share of retail still grows, but by less than a point a year, so in our view most of a shop's growth has to be won from competitors or existing customers. E-commerce reached 17.1% of US retail sales in the second quarter of 2026, up from 16.3% a year earlier. In France, the number of online transactions grew 10% in 2025 while the average basket fell 3%.
- The levers are linked, so pushing one can pull another down. Cheaper traffic often converts less, discounts raise conversion but cut margin, and free-delivery thresholds lift order value but can raise returns. The equation is useful only if you watch all its terms together.
- Revenue is not profit: returns, delivery, payment fees and marketing take a large share of every order. In the United States, retailers expected 19.3% of online sales to be returned in 2025. In our illustrative model of a €100 order, less than a sixth of the order value is left as contribution after these costs.
- Price and returns move profit far more than traffic. McKinsey estimated that a 1% price rise, at stable volume, would raise operating profit by 8% for an average S&P 1500 company. In our illustrative model, a 1% price rise lifts contribution by about 4.8% and a one-point cut in the return rate by about 2.4%, against 1% for 1% more traffic.
- Use the equation as a management tool, whatever your size. Track each term by device, channel and customer type, agree which ones you are trying to move, and test changes before rolling them out. The customer experience is what connects all the terms: it decides who buys, how much, and whether they come back.
The e-commerce market equation breaks online revenue into factors you can measure and manage: revenue = sessions × conversion rate × average order value. A customer version (customers × orders per customer × average order value) shows the role of retention, and a profit version subtracts returns, cost of goods, delivery, payment fees and marketing to show what each order really earns.
Section 1 · The equation
Online revenue is the product of a few factors, and each one can be measured and managed
Every euro of online revenue comes from the same chain. A market of shoppers exists; a share of them visits your site; a share of those visitors buys; each order has a value; and some customers come back. The e-commerce market equation writes this chain down so that each link can be measured, compared and improved.
Revenue = sessions × conversion rate × average order value
Revenue = customers × orders per customer × average order value
Contribution = revenue − returns − cost of goods − delivery − payment fees − marketing
The three versions answer different questions. The session view is the one analytics tools show and the one conversion optimisation works on. The customer view shows whether growth comes from new or returning customers, which matters because they cost very different amounts to win. The profit view shows how much of that revenue the business keeps.
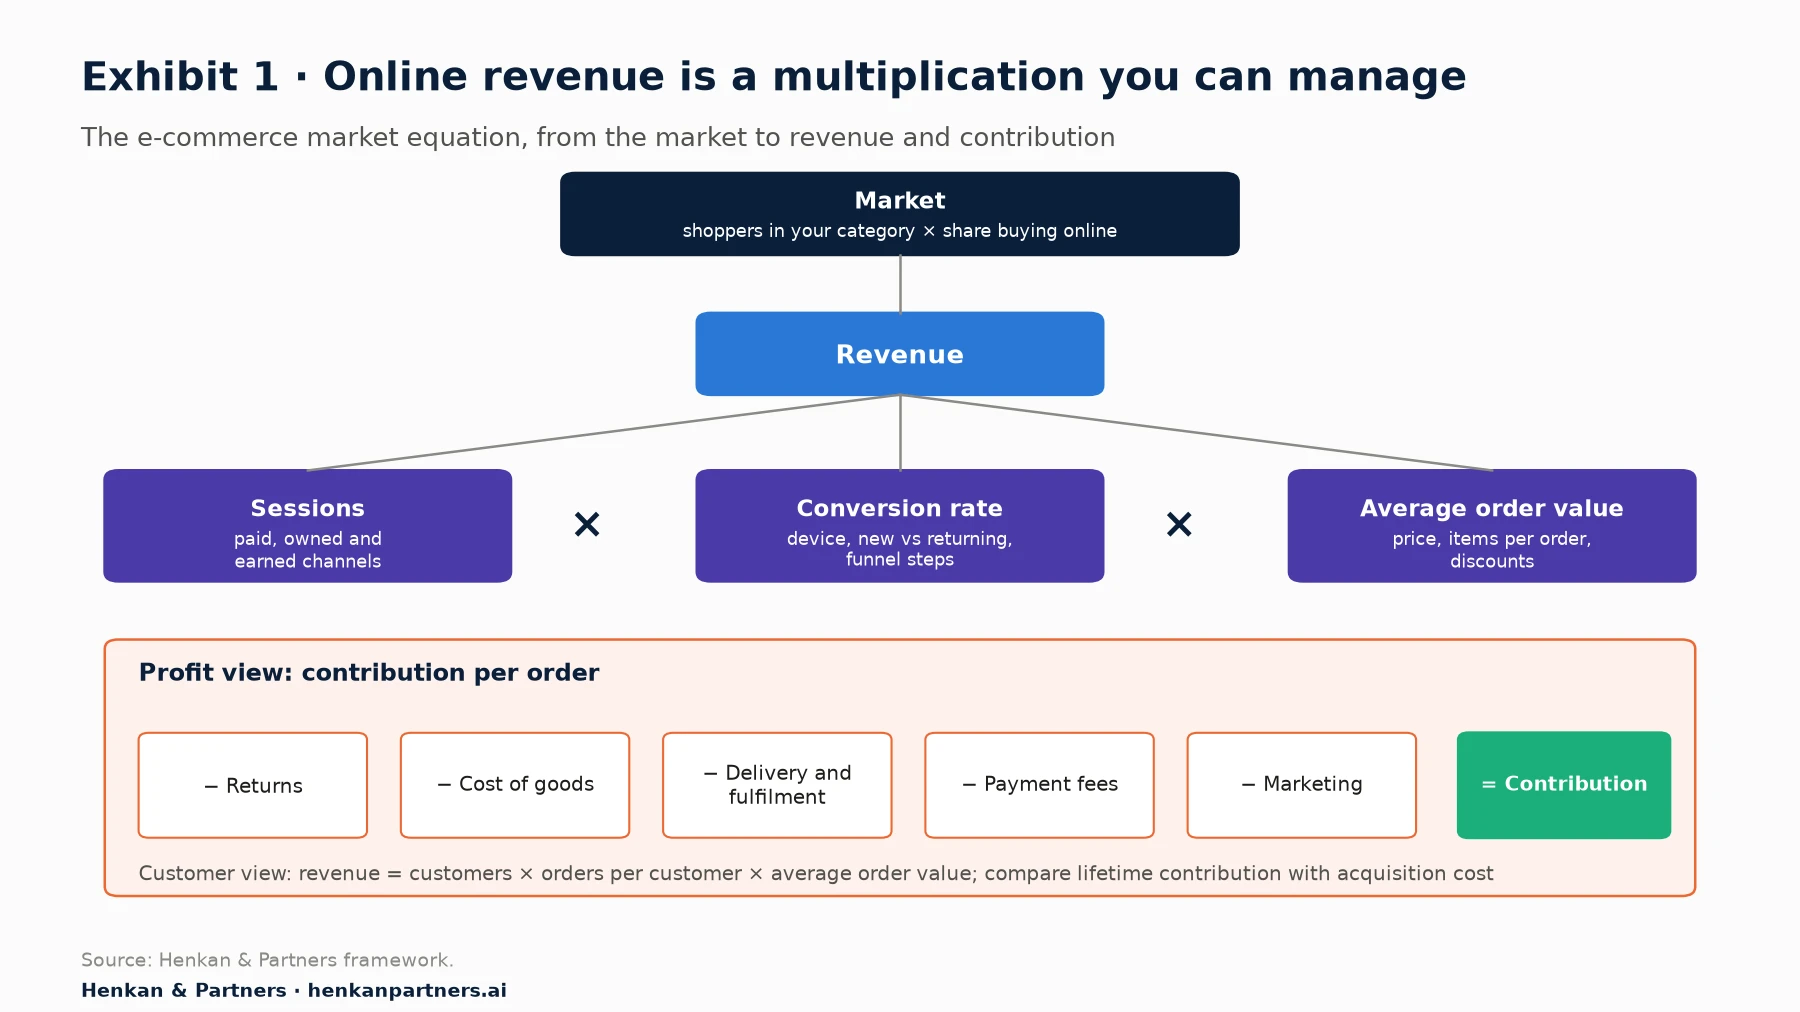
What this shows. Every initiative in e-commerce works on one or more branches of this tree. A new campaign moves sessions; a checkout redesign moves conversion; a bundle moves order value; a returns policy moves the bottom of the tree. Writing the tree down forces a team to say which term it expects to move, and by how much.
For leaders. Ask your team to present results as the equation, not as one revenue figure: sessions, conversion rate and order value by device and channel, plus returns and contribution. A revenue increase driven by discounts and paid traffic is not the same achievement as one driven by conversion and repeat purchase, even if the total is identical.
Section 2 · The market
The online share of retail still grows, but slowly, so much of a shop's growth has to be taken from competitors
The first term of the equation sits outside your control: how much of your category is bought online. In the United States, the Census Bureau reports that e-commerce accounted for 17.1% of total retail sales in the second quarter of 2026, up from 16.3% a year earlier. The share jumped during the pandemic, fell back, and has since grown by less than a point a year.
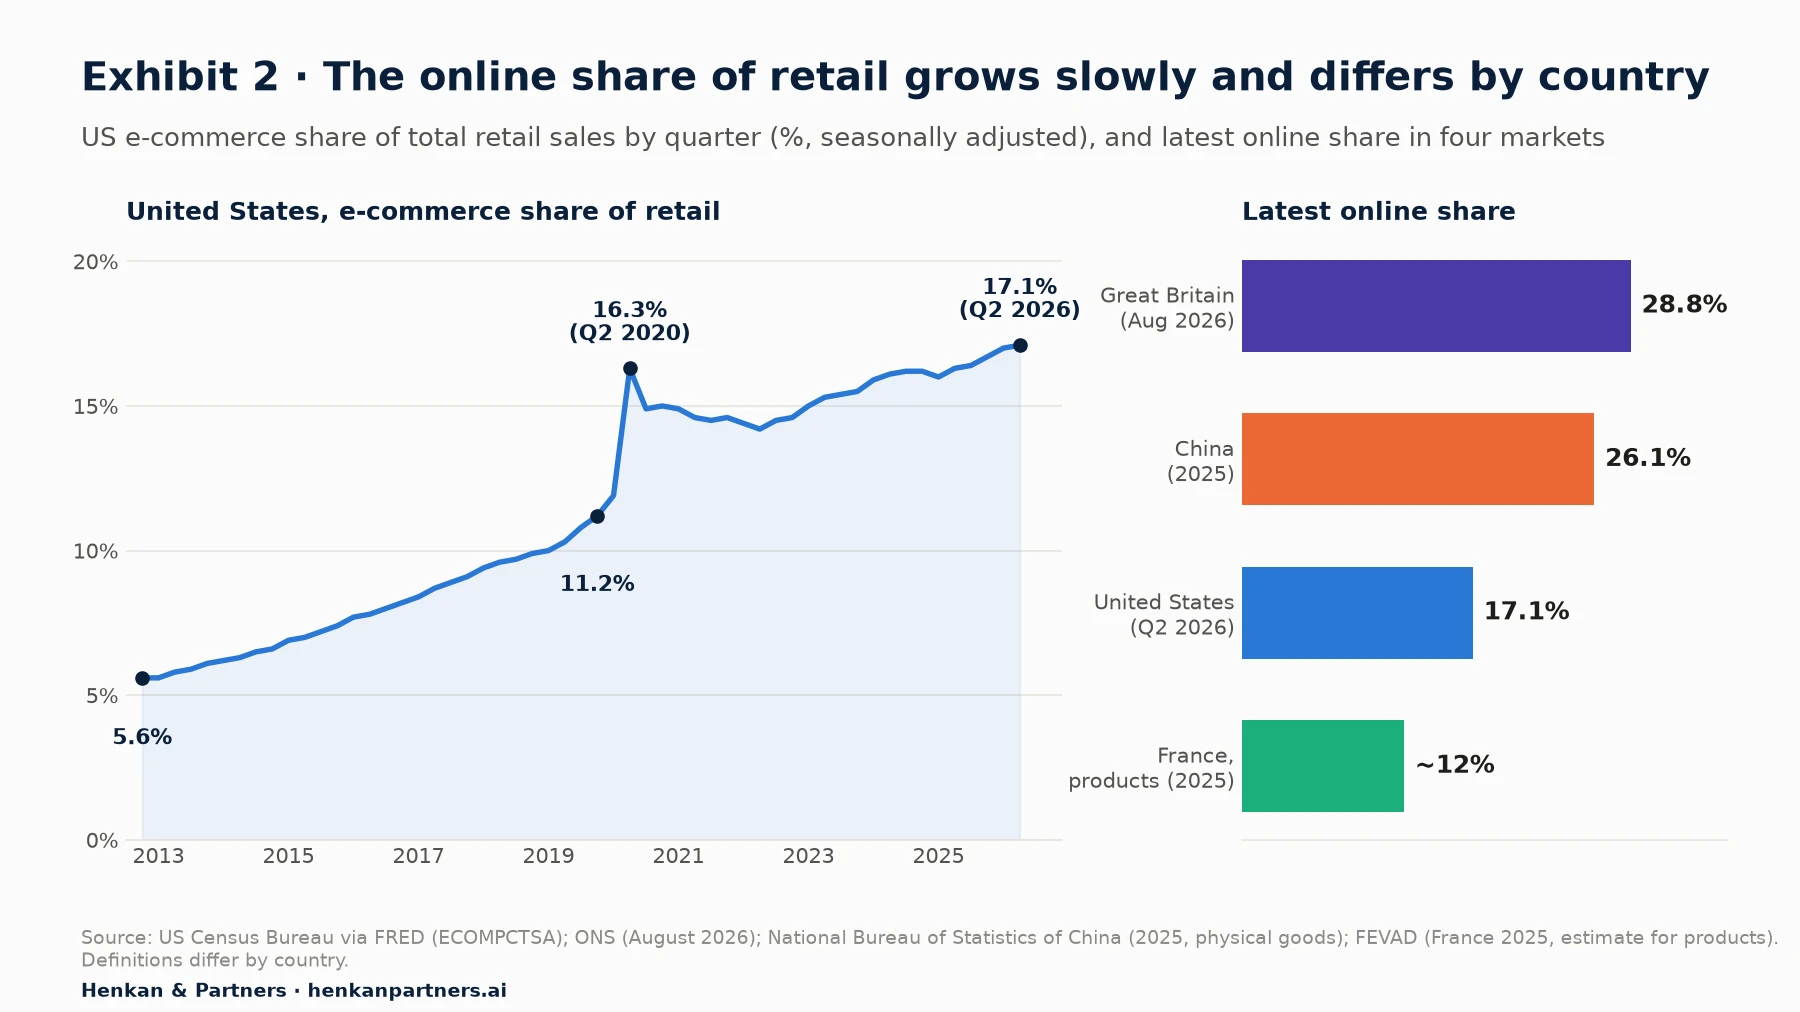
What this shows. Online penetration differs widely by country, from about 12% of product sales in France to almost 29% of retail in Great Britain. Where it grows by less than a point a year, most of a shop's growth has to come from winning share from competitors, or from selling more to existing customers, rather than from the market itself.
The composition of growth is changing too. FEVAD reports that French consumers spent €196.4 billion online in 2025, up 7%, with 3.2 billion transactions (up 10%) but an average basket of €62, down 3%. Ecommerce Europe and EuroCommerce estimate that European B2C e-commerce grew 7% in 2024, from €784 billion to €842 billion. More frequent, smaller orders make delivery and payment costs weigh more on each order, which is why the profit view of the equation matters (Section 6).
| Market | Latest online share | What it measures | Source |
|---|---|---|---|
| United States | 17.1% (Q2 2026) | E-commerce share of total retail sales, seasonally adjusted | US Census Bureau |
| Great Britain | 28.8% (August 2026) | Internet sales as a share of total retail sales | ONS |
| China | 26.1% (2025) | Online retail of physical goods as a share of retail sales of consumer goods | National Bureau of Statistics |
| France | About 12% (2025) | Estimated online share of retail sales of products | FEVAD |
| European Union | 78% of internet users bought online (2025) | Share of internet users aged 16 to 74 who bought goods or services online in the previous 12 months | Eurostat |
Section 3 · Multiplication
Because the factors multiply, small gains compound, but the levers are linked and can cancel each other out
The most useful property of the equation is that it multiplies. Improving sessions, conversion rate and average order value by 5% each does not add 15% to revenue; it adds 15.8% (1.05 × 1.05 × 1.05). The same logic works in reverse: three small losses compound into a large one. This is why a programme of many modest, tested improvements can beat a single big project.
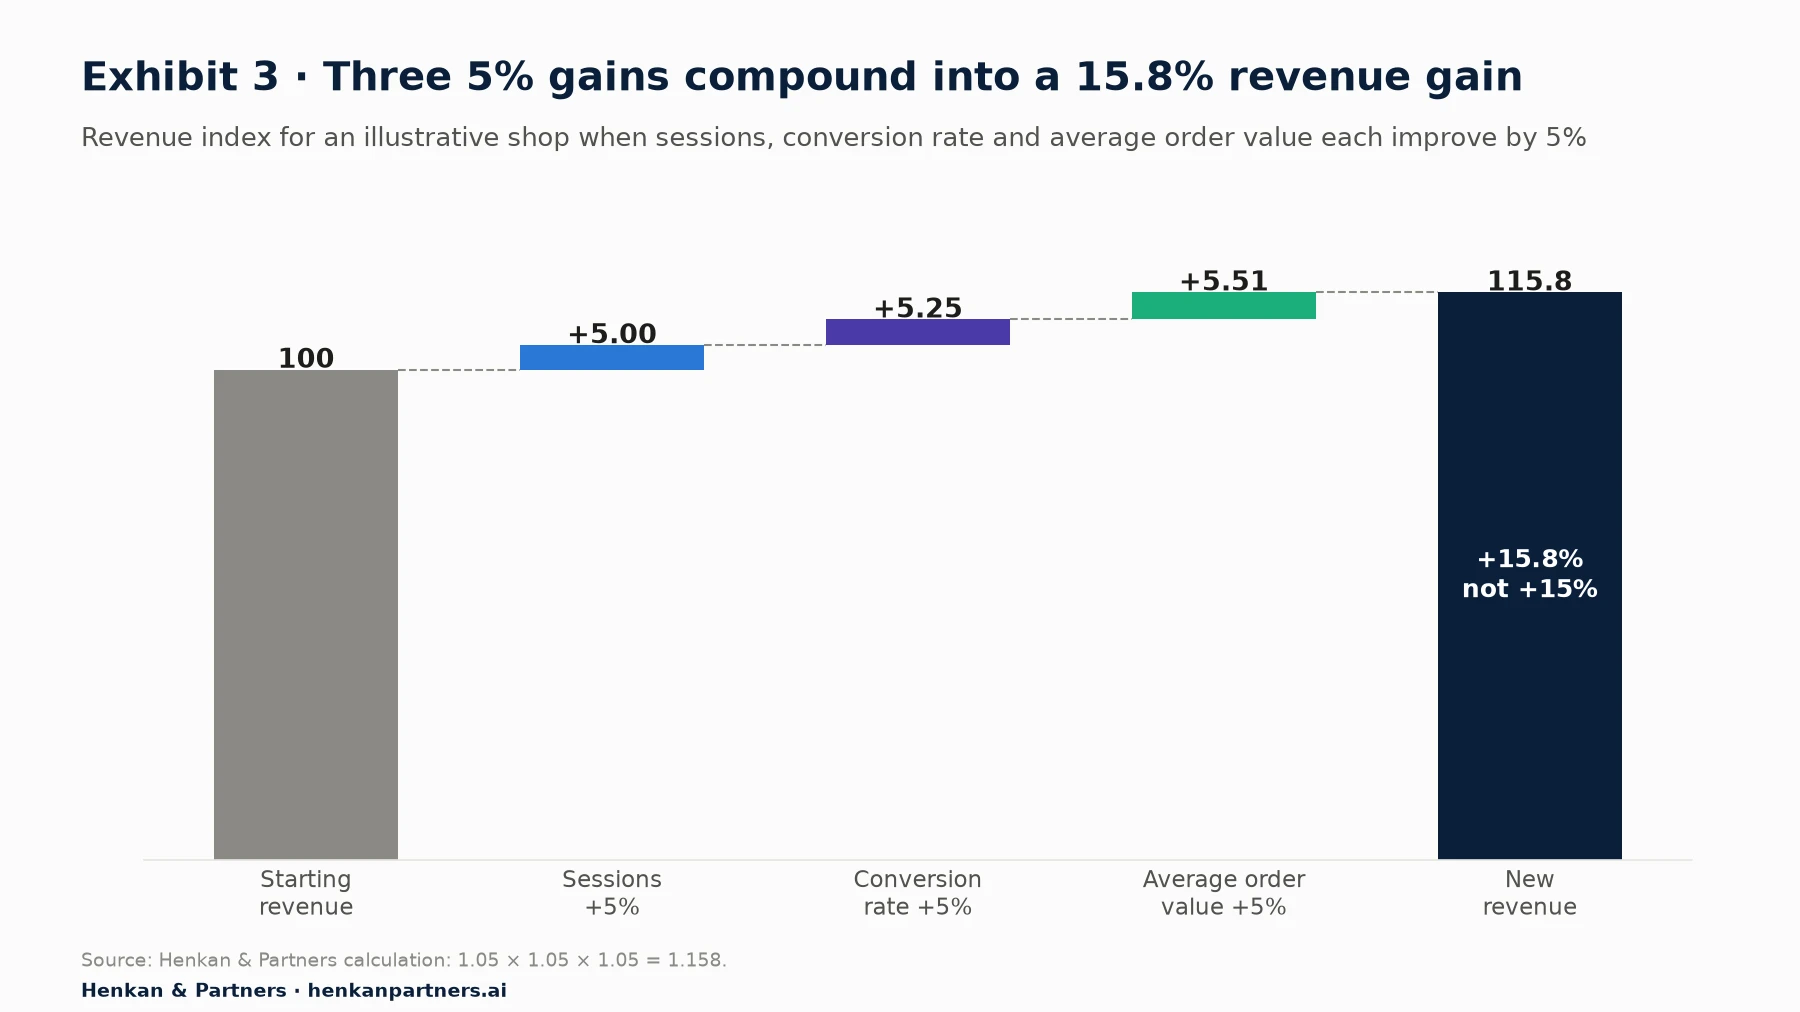
What this shows. Each later gain applies to a larger base. The practical consequence is that teams working on traffic, conversion and basket size should share one target and one view of the equation, rather than each claiming their own percentage of the same revenue.
The levers are not independent
The multiplication only holds if a change to one factor leaves the others alone, and it rarely does. The most common interactions are these:
| Action | Term it raises | Term it can lower | What to watch |
|---|---|---|---|
| Buying more or cheaper traffic | Sessions | Conversion rate, if new visitors are less ready to buy | Revenue per session and new-customer share by channel |
| Discounts and promotions | Conversion rate, orders | Average order value, gross margin, future full-price sales | Contribution per order, not revenue |
| Free-delivery thresholds and bundles | Average order value | Conversion rate for small baskets; returns if people add items to reach the threshold | Share of orders just above the threshold and their return rate |
| Price increases | Average order value, margin | Conversion rate, if demand is price sensitive | Test before rolling out; compare contribution per session |
| Easier checkout and more payment methods | Conversion rate | Usually nothing, but some payment methods add fees | Payment cost per order |
| Lenient returns policy | Conversion rate, trust | Contribution, through more returns | Return rate by product and customer |
For marketers. Report revenue per session next to conversion rate. When a campaign brings many new visitors, conversion rate often falls while revenue per session tells you whether the extra traffic was worth it. For the channel view of the equation, see our Essential Guide to E-commerce Acquisition and Retention Channels.
Section 4 · Traffic and conversion
Traffic is getting more expensive, so the return on every visit decides growth
For most shops, sessions are bought as much as earned. Contentsquare's 2026 benchmark, covering 99 billion sessions across industries, found that total traffic fell 3.8% in a year while the cost per visit rose 9%, and 30% over three years. Meta reported that its average price per ad rose 12% year on year in the second quarter of 2026. When each visit costs more, the conversion rate and order value of that visit decide whether growth pays.
Conversion rates depend heavily on who visits, not only on the site itself. Contentsquare found that returning visitors convert at 2.9% against 1.7% for new visitors, and that desktop converts at a rate 74% higher than mobile. IRP Commerce, which tracks independent and mid-sized online retailers in the UK and Ireland, reported a conversion rate of 2.23% and an average order value of £129.23 for August 2026. Comparing your own figures with these only makes sense within the same mix of devices, visitors and channels.
Where conversion leaks
The checkout is where many shops lose sales for reasons they can fix. Baymard Institute's research on US online shoppers who abandoned a checkout, excluding those who were only browsing, shows that most of the reasons are fixable: unexpected extra costs, slow delivery, forced account creation, a complicated checkout and lack of trust.
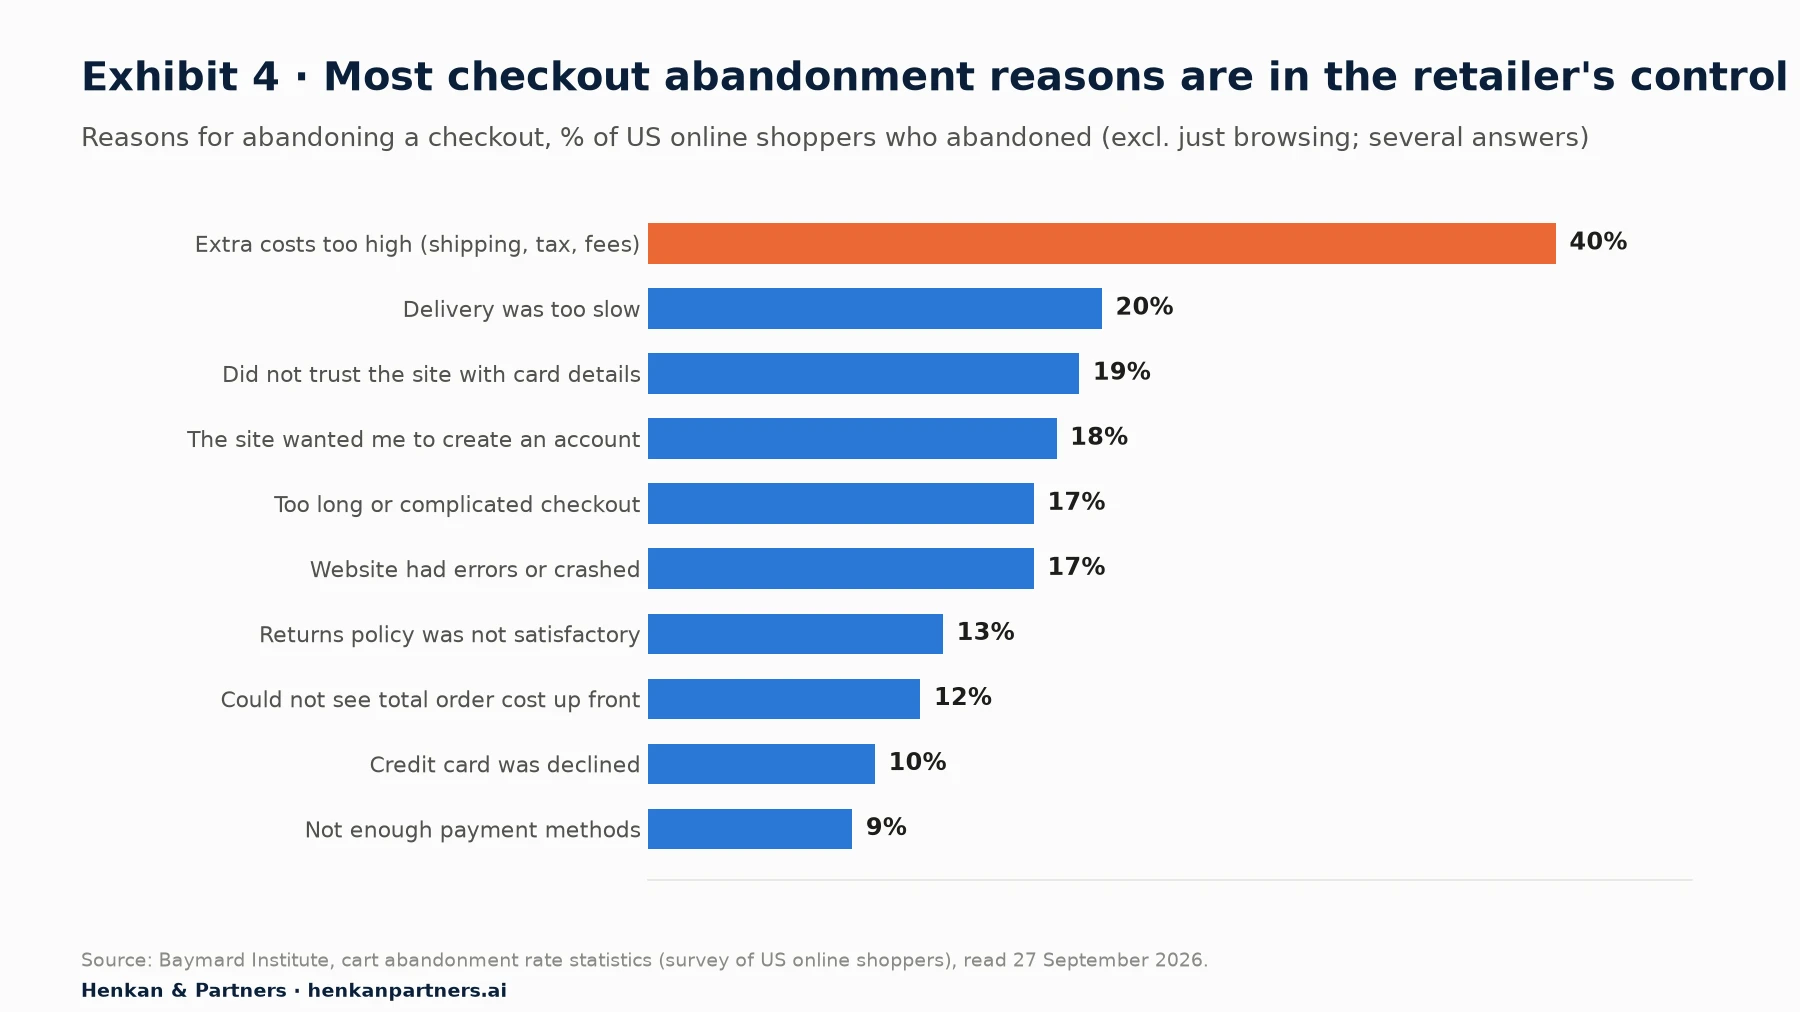
What this shows. The largest single reason is cost that appears too late. Showing delivery costs and taxes early, offering guest checkout and the payment methods your customers expect, and making the returns policy clear are among the cheapest ways to raise the conversion term. Each fix should still be tested, because the effect differs from one shop to another.
For marketers. Break conversion rate into funnel steps (product view, add to cart, checkout start, purchase) by device. The step with the biggest drop against your own history, not against a benchmark, is usually where to start. Our Essential Guide to A/B Testing explains how to measure the effect of each change.
Section 5 · Order value and price
Price is the most powerful lever in the equation, and discounts are the most expensive
Average order value has two parts: how many items a customer buys and the price of each. Bundles, recommendations and delivery thresholds raise the first. Pricing and discounting set the second, and they matter disproportionately for profit because a price change goes straight to margin while volume changes bring their costs with them.
McKinsey's classic analysis of the average income statement of an S&P 1500 company found that "a price rise of 1 percent, if volumes remained stable, would generate an 8 percent increase in operating profits", an effect nearly 50% greater than a 1% cut in variable costs and more than three times greater than a 1% increase in volume. The same arithmetic works against discounts: a 10% discount has to bring much more than 10% extra volume to leave profit unchanged.
In practice, few online shops can raise prices freely, because comparison is one click away. But many give away margin they do not need to, through site-wide promotions, automatic voucher codes or free delivery on every order. Testing price and promotion rules on a share of traffic, and judging them on contribution per session rather than conversion rate, protects the most valuable term of the equation.
For leaders. Ask what share of orders used a discount code last quarter, and what the average discount cost was as a share of revenue. If nobody knows, the price term of your equation is being managed by habit rather than by decision.
Section 6 · From revenue to profit
Returns, delivery, payment fees and marketing take a large share of every order before it earns anything
The session view of the equation stops at revenue. The profit view continues. Four costs sit between the order and the contribution it makes to the business.
- Returns. The NRF and Happy Returns estimate that 19.3% of US online sales would be returned in 2025, against 15.8% for retail as a whole. Returned items reduce revenue and add handling, transport and sometimes write-offs.
- Cost of goods. Across US listed companies, Aswath Damodaran's January 2026 data put the gross margin of general retail at 33.2% and of speciality retail at 35.3%, with pre-tax operating margins of about 7% to 8%.
- Delivery and payment. Each order must be picked, packed and shipped, and paid for. Stripe's standard price for European cards, for example, is 1.5% + €0.25 per transaction, and 2.9% + 30 cents for US cards. Smaller baskets make these costs weigh more.
- Marketing. Gartner's 2025 survey found that marketing budgets across industries averaged 7.7% of company revenue, with paid media at 2.4%. For new customers acquired through paid channels, the cost per order is often much higher.
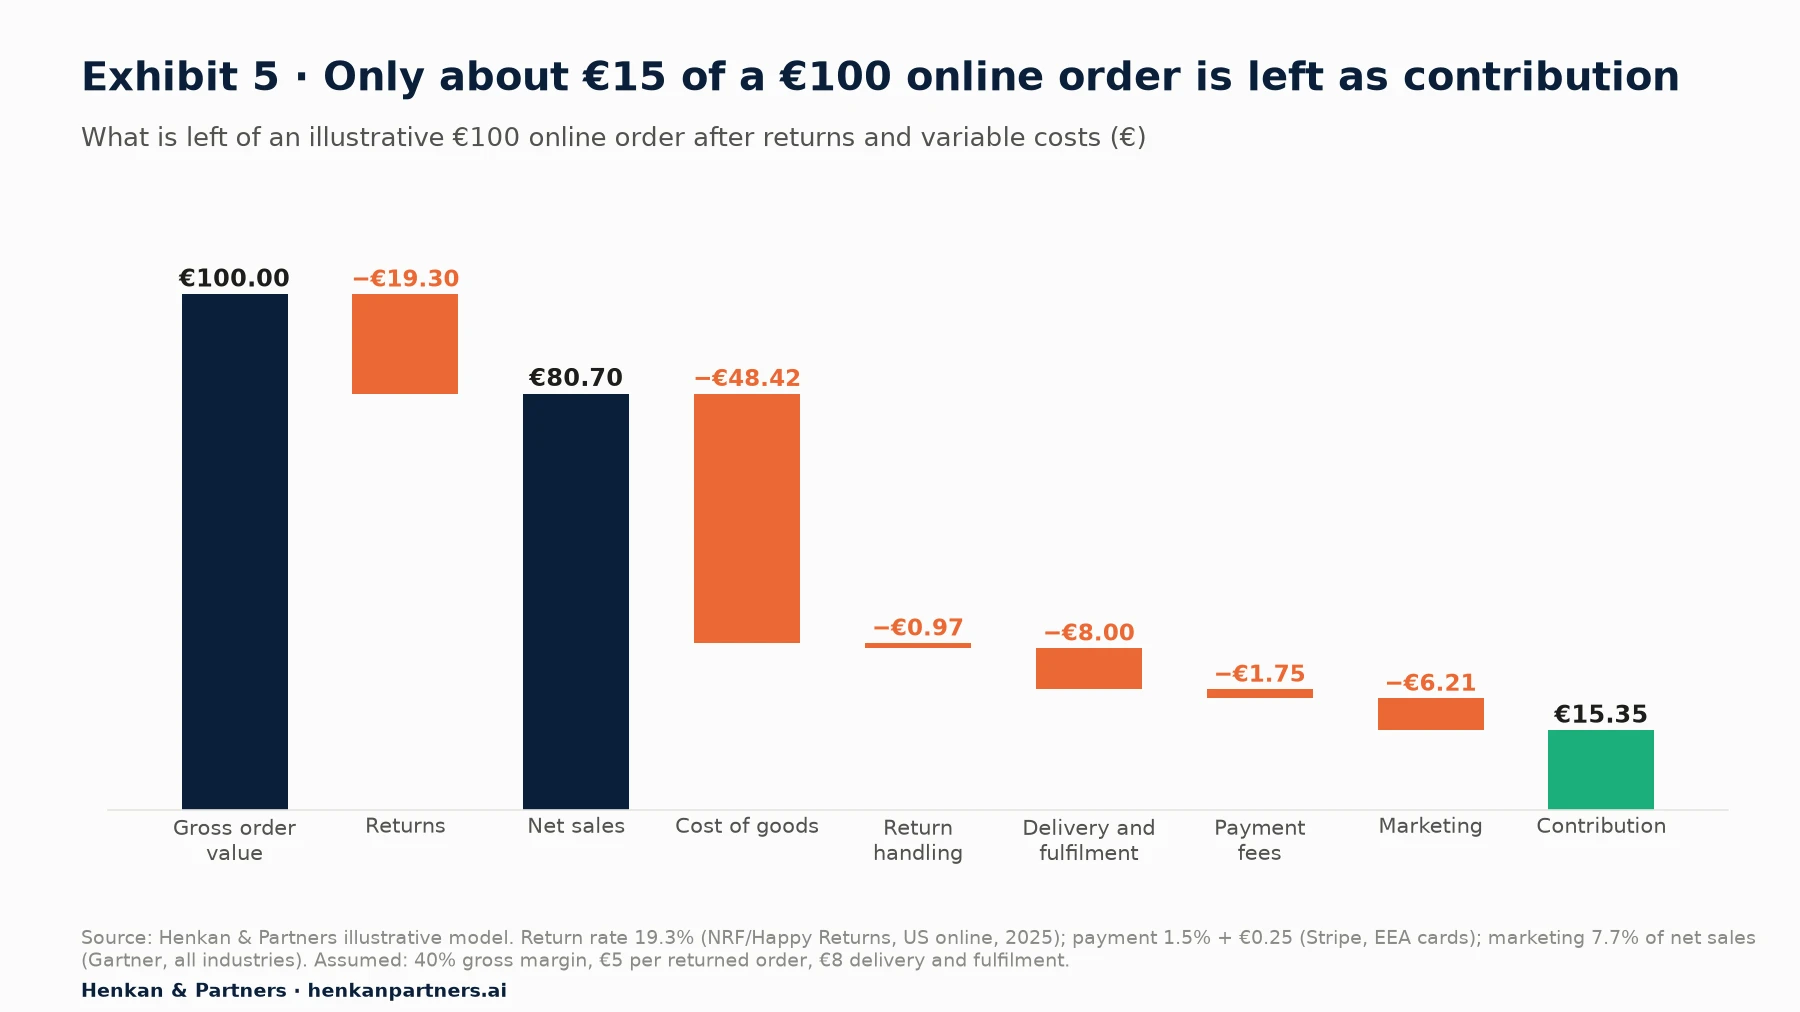
What this shows. In this example, about €15 of a €100 order is left to pay for staff, technology, rent and profit. Returns alone remove almost a fifth of gross revenue. The exact numbers vary widely by category and business model, but the shape is typical: the costs between revenue and contribution are large, and most of them move with the number of orders, not only with revenue.
Section 7 · Sensitivity
Price and returns move profit far more than traffic
Putting the profit view into a model shows which lever matters most. Using the illustrative €100 order above, we changed one term at a time by 1% and measured the change in contribution.
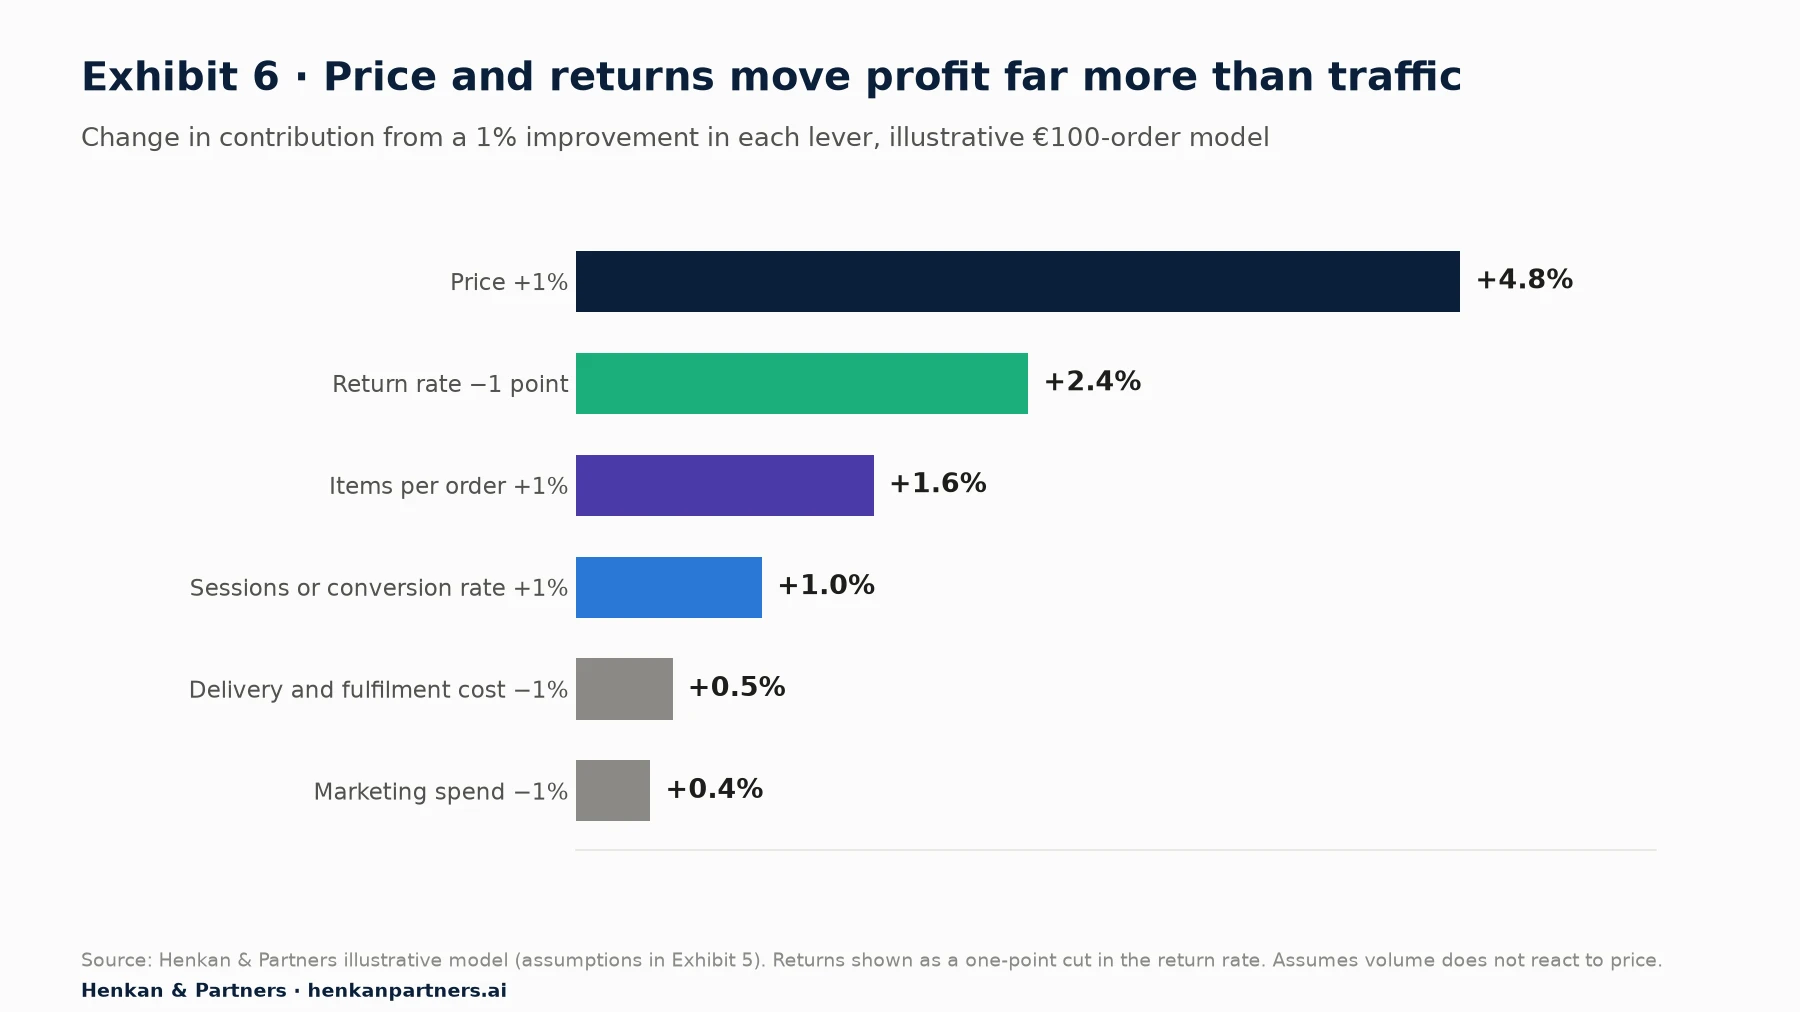
What this shows. A 1% price rise at stable volume lifts contribution almost five times as much as 1% more traffic or conversion, because it adds revenue without adding cost. Reducing returns is the second most powerful lever. More items per order beat more orders, because delivery and payment are paid once per order. These results assume volume does not react to price, which is exactly what a price test should check.
This does not mean traffic and conversion do not matter; they are the terms a business can usually move by more than 1%. It means that plans should be compared on contribution, and that return reduction and pricing discipline deserve a place on the roadmap next to acquisition and conversion work.
For leaders. Build this model with your own numbers: order value, return rate, gross margin, delivery, payment and marketing cost per order. It takes a few hours in a spreadsheet and changes budget discussions, because it shows what each initiative must deliver to pay for itself.
Section 8 · Customers
The customer version of the equation shows why repeat purchase is the cheapest growth
Written by customer, the equation becomes: revenue = customers × orders per customer × average order value. It separates two very different sources of revenue. New customers usually cost marketing money to win; returning customers can be reached through email, app or the brand itself at much lower cost.
The difference is large. Gorgias, using data from its merchants, reports that repeat customers account for 21% of customers but generate 44% of revenue and 46% of orders. A vendor study by SimplicityDX found that merchants lost on average $29 for every new customer acquired in 2022, against $9 in 2013, while the profit from a repeat sale rose from $28 to $39. The first order often loses money; the relationship makes it.
Customer lifetime value = contribution per order × orders per customer over their lifetime
The acquisition is worth it when customer lifetime value > customer acquisition cost
| Term | New customers | Returning customers |
|---|---|---|
| How they arrive | Mostly paid search, social, marketplaces, affiliates | Email, SMS, app, direct and brand search |
| Conversion rate | Lower (1.7% for new visitors in Contentsquare's benchmark) | Higher (2.9% for returning visitors) |
| Marketing cost per order | High: includes acquisition cost | Low: mostly owned channels |
| Main lever | Traffic quality and first-visit experience | Delivery, returns, service and relevant follow-up |
For marketers. Split every term of the equation by new and returning customers. A falling conversion rate with a rising share of new visitors is often good news; a falling repeat rate is rarely good news, whatever revenue says.
Section 9 · What to do next
Five steps turn the equation into a management tool, whatever the size of your team
| Team | Start with | Then add |
|---|---|---|
| One or two people | A monthly sheet with sessions, conversion rate, order value, returns and contribution per order, split by device | Revenue per session by channel; repeat purchase rate by month of first order |
| Growing e-commerce team | A shared equation dashboard by device, channel and new versus returning customers; one owner per term | An order-economics model with real costs; tests judged on contribution per session |
| Multi-brand or international retailer | The equation by country and brand, with market share where data exists | Price and promotion testing; return reduction programmes; CLV-based acquisition budgets |
1. Write down your equation
Put sessions, conversion rate, average order value, orders per customer, return rate and contribution per order on one page, with last year's values. Most teams discover that nobody owned at least one of the terms.
2. Split every term
By device, channel and new versus returning customers. Averages hide mix effects that explain most unexplained changes.
3. Build the profit view
Add returns, cost of goods, delivery, payment and marketing per order. Use it to judge campaigns, promotions and tests on contribution rather than revenue.
4. Pick the levers with the best return
Use a sensitivity model like Exhibit 6 with your own numbers. Price discipline, return reduction and basket size often deserve more attention than they get.
5. Test before you roll out
Every change to price, promotion, checkout or delivery rules moves more than one term. A controlled test shows the net effect on contribution per session, which is the number that matters.
FAQ
Frequently asked questions about the e-commerce market equation
Frequently asked questions
What is the e-commerce revenue formula?
The basic formula is revenue = sessions × conversion rate × average order value. A customer version, revenue = customers × orders per customer × average order value, shows the role of retention. To see profit, subtract returns, cost of goods, delivery, payment fees and marketing from revenue.
Which lever of the e-commerce equation has the most impact on profit?
Usually price. McKinsey estimated that a 1% price rise at stable volume raises operating profit by 8% for an average S&P 1500 company. In our illustrative e-commerce model, a 1% price rise lifts contribution by about 4.8%, against 1% for 1% more traffic or conversion. Reducing returns is often the second most powerful lever.
What is a good conversion rate for an online shop?
It depends on your mix of devices, channels and new versus returning visitors. Contentsquare's 2026 benchmark found 2.9% for returning visitors and 1.7% for new ones, and IRP Commerce reported 2.23% for independent and mid-sized UK and Irish retailers in August 2026. Compare your own rate over time and by segment rather than with a single benchmark.
How much of retail is online?
It varies by country and definition. E-commerce was 17.1% of US retail sales in the second quarter of 2026 (US Census Bureau), internet sales were 28.8% of retail in Great Britain in August 2026 (ONS), and online physical goods were 26.1% of China's retail sales of consumer goods in 2025.
Why is revenue per session useful?
Revenue per session equals conversion rate × average order value, so it captures both in one number. It is the fairest way to compare channels, pages or test variants, because a change that raises conversion but lowers order value, or the reverse, shows up correctly.
How do returns affect e-commerce profitability?
Returns reduce revenue and add handling and transport costs. The NRF and Happy Returns estimated that 19.3% of US online sales would be returned in 2025. In our illustrative model, cutting the return rate by one percentage point raises contribution by about 2.4%.
Key terms
- Session
- A visit to your site or app. Sessions measure how much traffic you attract, but not its quality.
- Conversion rate
- Orders divided by sessions. It shows how well the site turns visits into purchases, and it depends heavily on who the visitors are.
- Average order value (AOV)
- Revenue divided by orders. It moves with prices, the number of items per order, discounts and delivery thresholds.
- Revenue per session
- Revenue divided by sessions, or conversion rate × AOV. The best single number for comparing channels, pages or test variants.
- Orders per customer
- How many times a customer buys in a period. The retention term of the equation.
- Return rate
- The share of sales value that customers send back. It reduces revenue and adds handling cost, so it belongs in the equation.
- Gross margin
- Net sales minus the cost of the goods sold, as a share of net sales. It sets how much of each euro of revenue is available to pay for everything else.
- Contribution margin
- What is left from an order after cost of goods, returns, delivery, payment fees and marketing. It pays for fixed costs and profit.
- Customer acquisition cost (CAC)
- Marketing spend divided by the number of new customers. It must be covered by the contribution those customers bring over time.
- Customer lifetime value (CLV)
- The contribution a customer brings over their whole relationship with you. It sets how much you can pay to acquire one.
- Price elasticity
- How much demand changes when price changes. It decides whether a price rise or a discount increases profit.
- Online penetration
- The share of a market's retail sales made online. It shows how much room the channel still has to grow.
Sources
Methodology. This focus was researched in September 2026 from official statistics (US Census Bureau, ONS, Eurostat, the National Bureau of Statistics of China), industry bodies (FEVAD, Ecommerce Europe and EuroCommerce, NRF), published research (McKinsey, Aswath Damodaran) and vendor benchmarks, which are labelled as such. Every source was opened and checked on 27 September 2026. Exhibits 3, 5 and 6 are Henkan & Partners calculations; the order-economics model uses sourced rates where they exist and stated assumptions elsewhere.
- US Census Bureau, Quarterly Retail E-Commerce Sales, 2nd Quarter 2026
- FRED, E-Commerce Retail Sales as a Percent of Total Sales (ECOMPCTSA)
- ONS, Retail sales, Great Britain: August 2026
- National Bureau of Statistics of China, Retail sales in 2025
- FEVAD, Bilan du e-commerce en France 2025
- Ecommerce Europe and EuroCommerce, European E-commerce Report 2025, executive summary
- Eurostat, E-commerce statistics for individuals
- Contentsquare, How digital traffic is changing in 2026
- Contentsquare, Conversion rates in 2026
- Meta, Second Quarter 2026 Results
- IRP Commerce, Ecommerce market data, August 2026
- Baymard Institute, Cart abandonment rate statistics
- Marn, Roegner and Zawada, The power of pricing, McKinsey Quarterly, 2003
- NRF and Happy Returns, 2025 Retail Returns Landscape
- NRF, Consumers expected to return nearly $850 billion in merchandise in 2025
- Aswath Damodaran, Operating and net margins by industry, January 2026
- Stripe, Pricing
- Stripe, Tarifs (Europe)
- Gartner, 2025 CMO Spend Survey
- Gorgias, Repeat customer rate
- SimplicityDX, Brands losing a record $29 for each new customer acquired
- Henkan & Partners, The Essential Guide to E-commerce Acquisition and Retention Channels
- Henkan & Partners, The Essential Guide to A/B Testing