Focus
The E-commerce Personalisation Playbook: 25 Use Cases by Journey Stage
Alexandre Suon · 2026-09-28
E-commerce personalisation works best as a library of small, testable plays, each tied to a clear signal and a clear moment in the journey. This playbook sets out 25 personalisation use cases across arrival, browse and search, product page, cart and checkout, and post-purchase, with the data each one needs, the effort, the typical risk and how to test it. It also shows which plays to launch first, what the published evidence says, and what you should never personalise under EU and French rules.
Executive summary
- Personalisation pays when it answers a shopper's question, not when it shows off data. McKinsey reports a typical revenue lift of 10–15% (5–25% by company), and 71% of consumers expect personalised interactions. Most of the value comes from a small set of proven plays, not from a big platform switch.
- Thirteen of the 25 plays need only session data. Campaign parameters, referrer, device, country, language and what is in the cart are available instantly, with no login and no customer data platform (CDP). GA4 audiences take 24–48 hours to fill, so they suit email and ads better than in-session changes.
- The cart is where personalisation earns its keep. Baymard puts average cart abandonment at 70.22%, and 40% of shoppers who abandon at checkout (excluding those just browsing) blame extra costs. Showing distance to free delivery, a delivery date for the shopper's location, the right payment methods and express checkout for returning customers address five of the top ten reasons.
- Eight plays are quick wins: high impact for low effort. Campaign message match, 'continue where you left off', delivery date by location, back-in-stock alerts, a free-delivery progress bar, cart and browse abandonment reminders and replenishment reminders should come before AI-driven search or loyalty-tier experiences.
- Every play needs a control group, because benchmarks describe senders, not uplift. Visits with a recommendation click are 7% of visits but 26% of revenue in Salesforce data, and top abandoned-cart flows earn $28.89 per recipient in Klaviyo data, but engaged shoppers would buy more anyway. Only an A/B test or a holdout measures what the play adds.
- Some things must not be personalised. Under EU and French law, a price personalised by automated profiling must be disclosed, prices cannot differ by nationality or residence unless the same offer is open to everyone in that territory, sensitive traits are off limits and tracking needs consent. Covert data use also backfires: in one study, personalisation raised click intent by 64% when data was collected openly and had no significant effect when it was collected covertly.
Section 1 · Definitions
A personalisation use case is a signal, a change and a test, not a feature
An e-commerce personalisation use case (or 'play') is a specific change to the shopping experience, shown only to shoppers who share a signal such as their traffic source, location, browsing history or purchase history, and designed to answer a question those shoppers have at that moment. A good use case names the signal, the change, the data it needs, the metric it should move and the test that will prove it.
Personalisation means showing different content, products, messages or offers to different people. Our Essential Guide to Personalisation explains the strategy and operating model, and the Essential Guide to Web Personalisation covers the on-site mechanics. This playbook is the practical companion: a library of 25 plays you can pick from, organised by the five stages of the shopping journey.
Teams often start from the tool ('we bought a recommendation engine, where do we put it?'). Starting from the journey works better. At each stage the shopper has a small number of questions: is this the right site, where is the thing I want, will it fit and when will it arrive, how much will it really cost, and what now? A personalisation play is worth building only if it answers one of those questions better for one group than the default page does for everyone.
The five parts of every play
- Signal or segment. What you know about the visitor at that moment: the campaign they clicked, their country, the category they browsed, their loyalty tier.
- Change. What they see differently: a headline, a product order, a delivery message, an email.
- Data needed. Where the signal comes from: the current session, GA4 audiences, first-party customer records or a CDP profile.
- Metric. The one number the play should move (conversion rate, average order value, repeat purchase rate), plus guardrails such as returns or unsubscribes.
- Test. How you will prove it: an A/B test within the segment, a holdout group or, for short-lived content, a bandit.
A simple formula helps you size a play before you build it. It is deliberately rough: its job is to stop you spending weeks on a segment that is too small to matter.
Expected monthly value of a play =
  visitors in the segment per month
  × baseline conversion rate of the segment
  × expected relative lift
  × average order value
  − monthly cost to build, run and maintain the play
For marketers. Write every idea as 'For [segment], when [signal], show [change] so that [metric] improves'. If you cannot fill in the brackets, it is not a play yet.
For leaders. Ask for a library of plays with a control group each, not a platform roadmap. The platform question is easier once you know which plays need which data.
Section 2 · The evidence
The evidence supports personalisation, but most published figures show correlation, not causation
The broadest evidence comes from McKinsey's 2021 Next in Personalization research. It found that 71% of consumers expect companies to deliver personalised interactions and 76% get frustrated when this does not happen. McKinsey reports that personalisation most often drives a 10–15% revenue lift, with company-specific lift ranging from 5% to 25%, and that faster-growing companies drive 40% more of their revenue from personalisation than slower-growing ones.
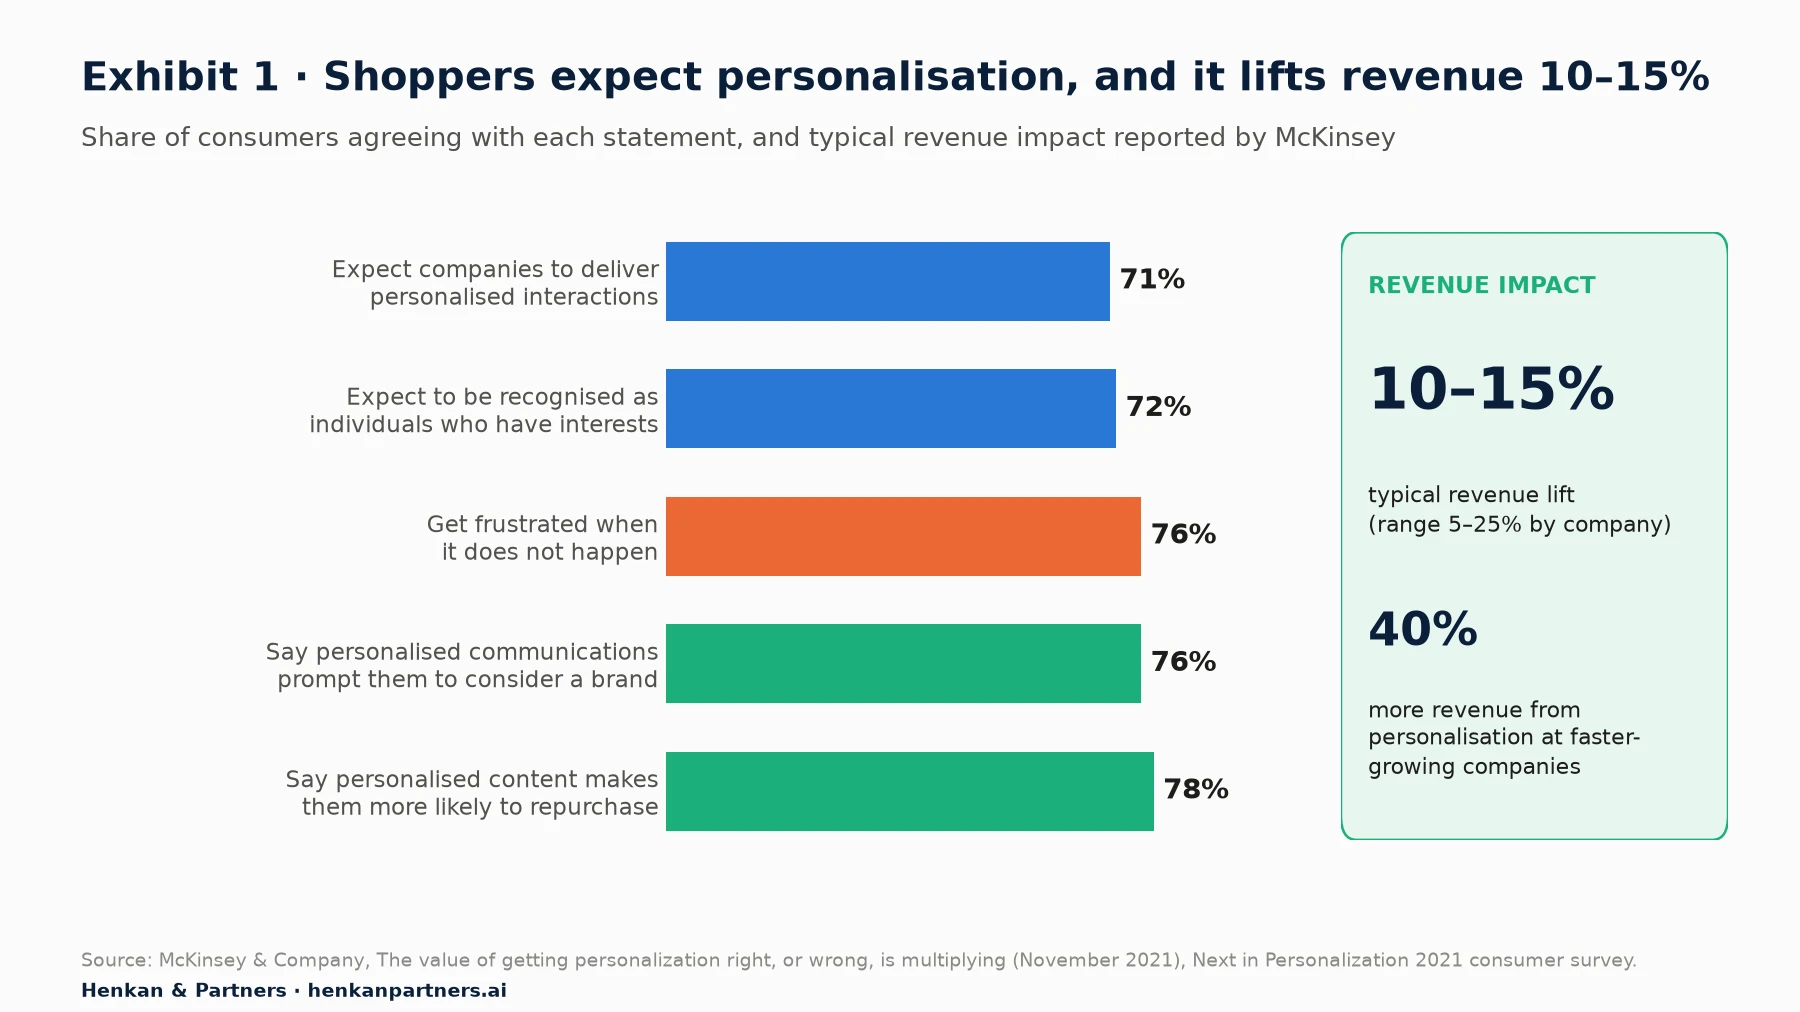
What this shows. Expectations are high and fairly uniform: between 71% and 78% of consumers agree with each statement. The revenue range is wide, from 5% to 25%, which tells you execution matters more than intent. McKinsey also notes that thoughtful touchpoints such as a post-purchase check-in, a how-to video or a review request build positive perceptions, which is why several of our plays sit after the sale.
Vendor data points in the same direction but needs more care. In Salesforce's 2017 analysis of more than 150 million shoppers and 250 million visits, visits in which the shopper clicked a product recommendation made up 7% of visits but 24% of orders and 26% of revenue (vendor data). A widely quoted 2013 McKinsey article estimated that 35% of what consumers purchase on Amazon comes from product recommendations.
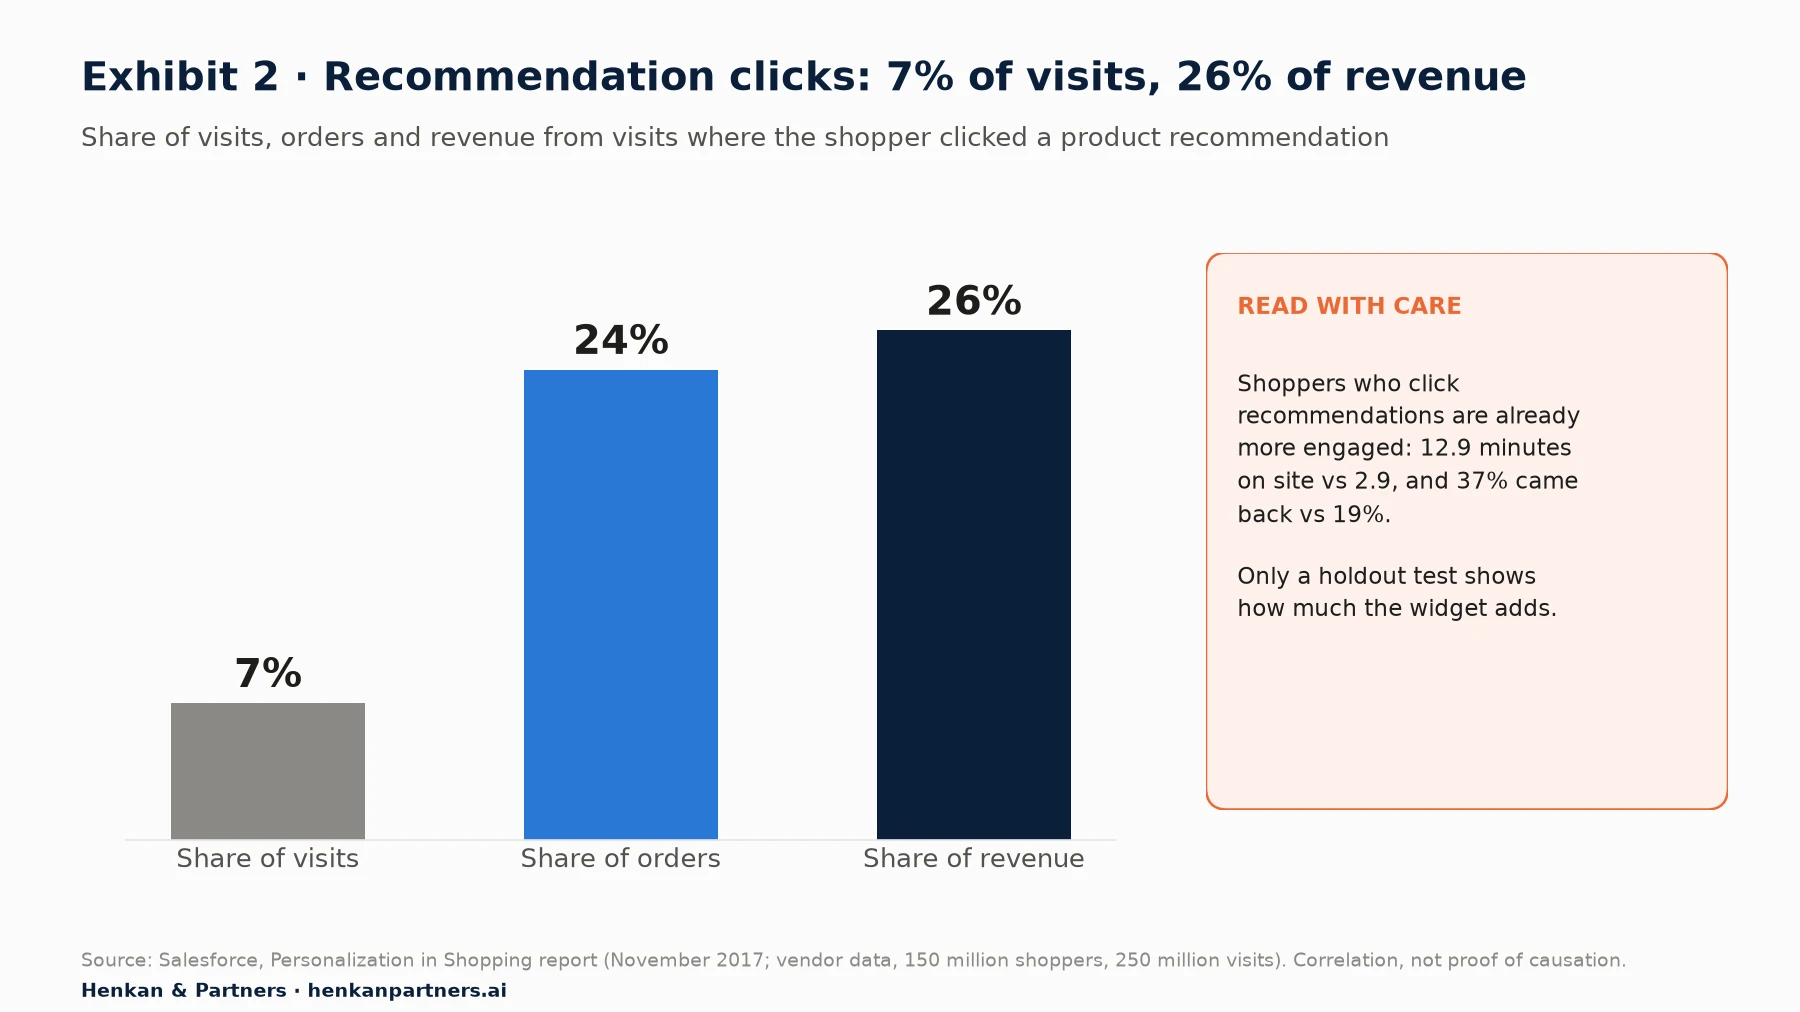
What this shows. The gap between 7% and 26% looks like proof that recommendations work, but it mostly shows who clicks them. The same report found clickers spent 12.9 minutes on site against 2.9 minutes, and 37% came back after a first visit against 19%. Engaged shoppers would buy more with or without the widget, so treat these figures as a sign of where to look, not as the uplift you will get.
How to read personalisation benchmarks
- Ask what the comparison group is. 'Shoppers who clicked' versus 'shoppers who did not' is a self-selected comparison. Only a randomised control tells you what the play adds.
- Separate senders from effects. Email benchmarks describe how flows perform on average, not how much revenue they create that would not have happened anyway.
- Check the date and the base. A 2013 Amazon figure says little about a mid-sized fashion site in 2026.
- Label vendor data. Vendors sell the tools they measure. Their numbers can be accurate and still unrepresentative.
Our view. The evidence is strong enough to justify a personalisation programme and weak enough that you should measure every play yourself. In our experience, the teams that get the most from personalisation are not those with the most segments but those that keep a control group for everything.
Section 3 · Data
Most high-value plays run on session data, so you can start before you buy a CDP
It is tempting to believe personalisation starts with a unified customer profile. In practice, most of what you need to know about a visitor is already in the page request: the campaign they clicked (UTM parameters, the tags added to a link to identify the campaign), the site that referred them, their device, their approximate country from the IP address, their browser language, and what they have viewed or added to the cart in this visit. That data is available instantly, needs no login and, for most uses, no stored profile.
We group personalisation data into four tiers. Each tier adds reach and precision, and each adds cost, delay and privacy obligations.
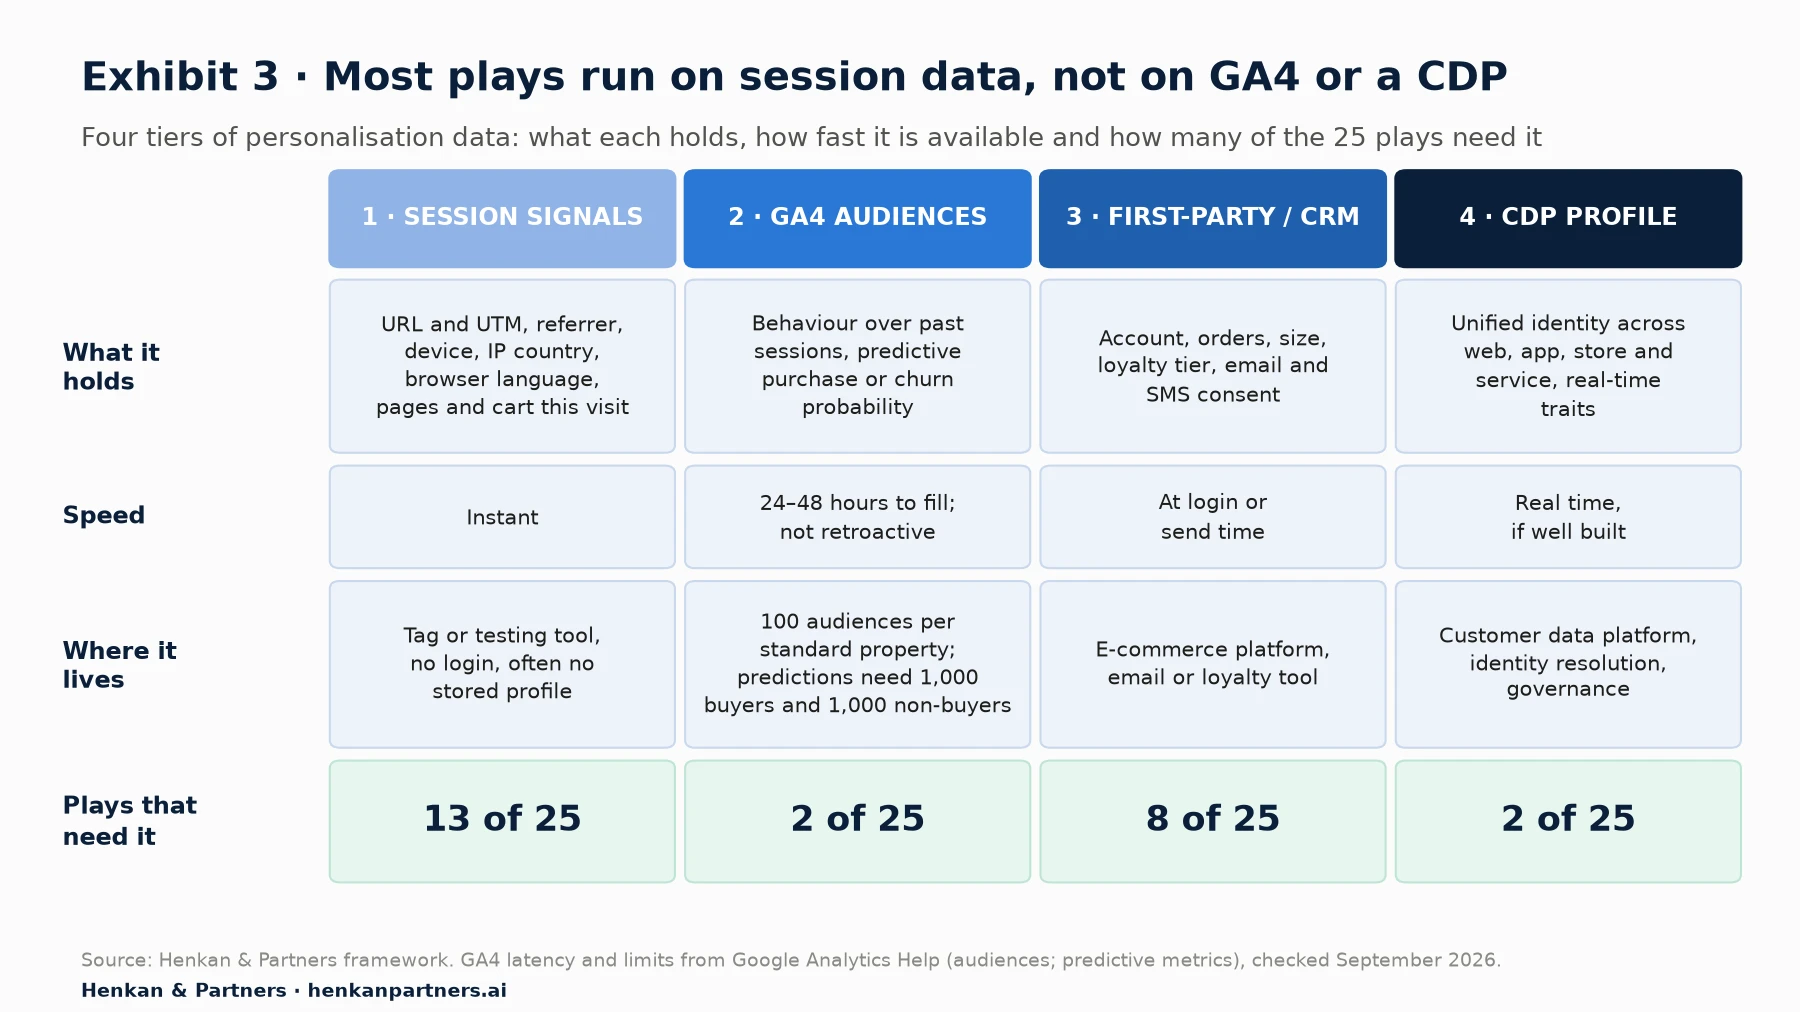
What this shows. Half the library runs on the cheapest tier. GA4 audiences are useful but slow: Google says new audiences take 24–48 hours to accumulate users and only include users from the moment they are created, so they are better suited to email, ads and next-visit changes than to changing the page a visitor is on. A CDP earns its cost when you need the same identity across web, app, store and customer service, which only a few plays require.
What GA4 can and cannot do for personalisation
GA4 is often the first place teams look for segments, and it has real strengths: it already holds behaviour across sessions, and its predictive metrics estimate purchase probability, churn probability and predicted revenue. But the limits matter. A standard property can hold up to 100 audiences (400 on GA4 360). Predictive metrics need at least 1,000 returning users who triggered the predicted event and 1,000 who did not, within a seven-day period over the last 28 days, plus purchase events with value and currency. And GA4 audiences are shared natively with Google's advertising products, not with your website, so on-site use depends on your testing or personalisation tool's own integration. Our guide to GA4 segments for personalisation covers how to build and export them.
| Data tier | Typical sources | Available | Best for | Watch out for |
|---|---|---|---|---|
| 1. Session signals | URL and UTM parameters, referrer, device, IP country, browser language, pages and cart in this visit | Instantly | Landing pages, delivery messages, cart nudges | Consent may still be needed if you store a profile across visits |
| 2. GA4 audiences | Behaviour over past sessions, predictive audiences | After 24–48 hours | Remarketing, email, next-visit experiences | 100-audience limit; predictive thresholds; not retroactive |
| 3. First-party / CRM | E-commerce platform, email and SMS tool, loyalty programme | At login or send time | Size, order history, replenishment, loyalty | Only covers logged-in or identified shoppers |
| 4. CDP profile | Customer data platform joining web, app, store and service | Near real time, if well built | Cross-channel search ranking, tier-aware journeys | Cost, identity resolution errors, governance |
Whatever the tier, storing or reading information on a visitor's device for personalisation usually requires consent in the EU. We cover the exceptions in Section 10 and the full picture in User Consent in E-commerce: Everything to Know Before 2027.
Section 4 · Arrival and landing
Arrival plays win by keeping the promise that brought the visitor in
The first seconds of a visit decide whether the shopper believes they are in the right place. Paid media makes this explicit: Google Ads defines landing page experience as how relevant and useful your landing page is to people who click your ad, and uses it as one of the components of Quality Score. The simplest arrival play is therefore message match: the landing page repeats the promise of the ad, email or post the visitor clicked.
Language and location are the other strong arrival signals. In CSA Research's 2020 survey of 8,709 consumers in 29 countries, 76% preferred to buy products with information in their own language and 40% said they never buy from websites in other languages. Showing the right language, currency, delivery costs and returns rules for the shopper's country is personalisation in its most useful form, and it needs nothing more than the browser language and IP country, with a visible switch so the shopper stays in control.
| Play | Signal or segment | Data needed | Effort | Typical risk | How to test |
|---|---|---|---|---|---|
| 1. Campaign message match | UTM campaign or ad group, email or social post clicked | Session (URL parameters) | Low | Headline promises what the range cannot deliver; too many variants to maintain | A/B test within paid traffic; primary metric conversion rate, guardrail bounce rate |
| 2. Language, currency and delivery localisation | Browser language, IP country | Session | Medium | Wrong guess for travellers and VPN users; geo-blocking rules (Section 10) | A/B test by country; always offer a visible switch |
| 3. Continue where you left off | Recently viewed products or category from the last visit | Session plus first-party storage | Low | Feels intrusive on shared devices; needs consent to store history | A/B test on returning visitors; metric product views per session and conversion |
| 4. New visitor reassurance | First visit, no cookie | Session | Low | Discount-first messages train shoppers to wait for codes | A/B test reassurance (delivery, returns, reviews) vs a first-order discount |
| 5. Partner and creator arrivals | Referrer or code from an affiliate, comparison site or creator | Session | Low | Code shown to visitors who did not earn it; affiliate commission rules | A/B test on that referrer only; watch margin, not just conversion |
Worked example: campaign message match (illustrative)
A home-goods retailer (illustrative) runs a paid search campaign on 'linen bedding' that lands on the generic bedding category. Play 1 changes the category hero and the first row of products for visitors whose URL carries `utm_campaign=linen`: the headline repeats 'Linen bedding, washed for softness', and linen sets move to the top. The play reads one URL parameter, needs no stored data and can be built in a testing tool in a few hours. The test splits linen-campaign visitors 50/50 between the generic and the matched page, with conversion rate as the primary metric and bounce rate and returns as guardrails. If the campaign brings 20,000 visitors a month at a 2% baseline conversion rate and a €120 average order, a 10% relative lift would be worth about 40 extra orders, or roughly €4,800 a month, before costs. That is the kind of arithmetic that should precede every build.
Section 5 · Browse and search
Browse and search plays should shorten the path, not narrow the choice
Once shoppers are browsing, the job is to help them find the product they want faster. Some of the best plays here are so simple that teams forget they count as personalisation. Baymard Institute found that 96% of e-commerce sites do not highlight products already in the user's cart within product lists, which makes it harder for shoppers to compare and to find related items. Baymard also describes 'contextual list item information': showing, in the product list, the attributes a shopper has just filtered or sorted by, because a user rarely filters by an attribute they do not care about. Both reuse data the site already has.
The risk at this stage is narrowing choice too far. Pre-applying a remembered size or re-ranking by inferred taste helps only if the shopper can see why the list looks the way it does and can undo it. We recommend a visible, removable chip ('Showing your size: M') for every inferred filter.
| Play | Signal or segment | Data needed | Effort | Typical risk | How to test |
|---|---|---|---|---|---|
| 6. Category affinity ordering | Categories browsed across recent sessions | GA4 audience or testing-tool profile | Medium | Locks shoppers into past interests; hides new ranges | A/B test among returning visitors; guardrail category diversity of purchases |
| 7. Contextual list information | Filters and sort order applied in this session | Session | Medium | Clutters product tiles if too many attributes show | A/B test on filtered lists; metric list-to-product click-through |
| 8. Highlight items in cart or already viewed | Cart contents and viewed products this session | Session | Low | Minimal; visual clutter on small screens | A/B test sitewide; metric add-to-cart of related items |
| 9. Personalised search ranking | Past purchases, brand and size affinity, current query | CDP profile plus search engine | High | Filter bubble; hard to debug; poor results for new visitors | A/B test through the search vendor with a non-personalised control; metric search conversion |
| 10. Remembered size and fit filters | Size chosen or bought before | First-party (account or stored preference) | Low to medium | Wrong size for gift buyers; must be visible and removable | A/B test on returning buyers; guardrail return rate |
For marketers. Plays 7 and 8 need no new data and help every shopper. They are good first tests for a team that is new to personalisation.
For leaders. Personalised search (play 9) is a strategic bet. Budget for it only once simpler plays are proven and your search data is clean.
Section 6 · Product page
On the product page, personalise the answers to 'will it fit, when will it arrive and what goes with it'
The product page is where shoppers decide, so the most valuable plays answer the questions that block a decision. Delivery is the clearest example. Baymard found that 41% of e-commerce sites show shipping speed ('2–3 business days') instead of an estimated delivery date, which forces users to work out processing times, weekends and cut-offs. A delivery date calculated for the shopper's location ('Arrives Thursday if you order in the next 3 hours') removes that effort, and it depends only on the country or postcode and your stock and carrier data.
Recommendations are the other big product-page play. Match the type of recommendation to the visitor's intent: similar items for someone still comparing, complementary items for someone who has already chosen, and nothing at all when the shopper is close to adding to the cart and a carousel would distract. Our Product Page and Checkout Optimisation playbook covers the non-personalised fundamentals that should come first.
| Play | Signal or segment | Data needed | Effort | Typical risk | How to test |
|---|---|---|---|---|---|
| 11. Recommendations by intent | Products viewed and added this session, browsing depth | Session plus recommendation engine | Medium to high | Widget cannibalises the main product; generic 'bestsellers' for everyone | Holdout: 10–20% of traffic sees no widget; metric revenue per visitor |
| 12. Delivery date and cost by location | IP country or postcode, time of day, stock location | Session plus stock and carrier data | Medium | Wrong promise if carrier data is stale | A/B test; guardrail late-delivery complaints |
| 13. Reviews and fit feedback from similar shoppers | Size, height or use case chosen by the shopper | First-party review data with reviewer attributes | Medium | Cherry-picking reviews is misleading; show all on request | A/B test on products with enough reviews; metric conversion and return rate |
| 14. Back-in-stock and low-stock alerts | Out-of-stock variant viewed | First-party (email or SMS consent) | Low | Fake scarcity is a dark pattern; alerts only when true | A/B test the opt-in module; measure alert-driven orders with a holdout |
| 15. Stock in a store near you | IP location or chosen store | Session plus store inventory feed | High | Inventory errors send shoppers to empty shelves | Geo split or A/B test in regions with stores |
Section 7 · Cart and checkout
In the cart, personalise costs, delivery and payment: the reasons people actually leave
Baymard Institute puts the average documented cart abandonment rate at 70.22%, based on 50 studies. Many shoppers were never going to buy: in Baymard's survey of US online shoppers, 42% of those who abandoned said they were just browsing. Among the rest, the reasons are practical, and several depend on who and where the shopper is. That makes the cart the stage where personalisation most directly removes friction.
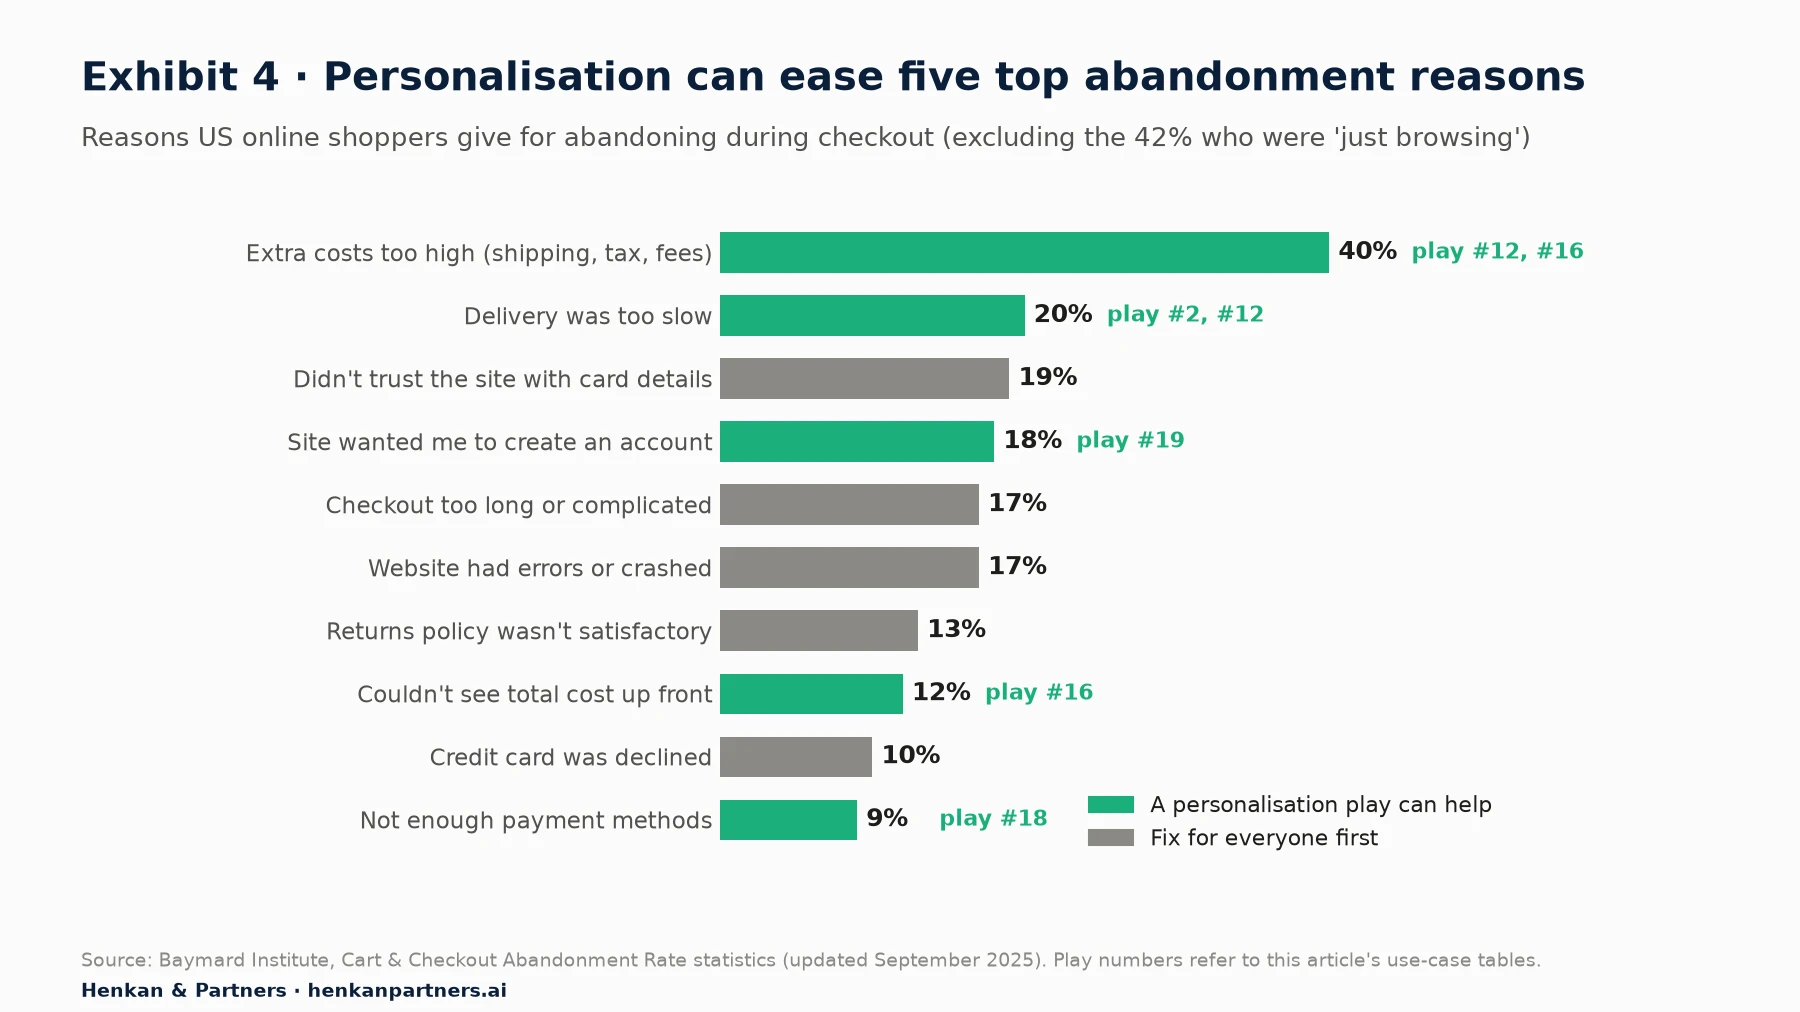
What this shows. Extra costs dominate at 40%. Personalisation cannot remove shipping fees, but it can show each shopper how far they are from free delivery and what delivery will cost to their address before checkout. Slow delivery (20%), forced account creation (18%), hidden totals (12%) and missing payment methods (9%) also respond to plays that adapt to location, device or customer status. Trust, errors and a long checkout should be fixed for everyone first.
Baymard also recommends putting free-shipping information near the buy section rather than only in a site-wide banner: 32% of sites rely on banners alone, and in testing 27% of users missed such banners. A free-delivery progress bar in the cart and mini-cart, calculated for the shopper's basket and country, is the personalised version of that advice.
| Play | Signal or segment | Data needed | Effort | Typical risk | How to test |
|---|---|---|---|---|---|
| 16. Free-delivery progress bar | Cart value and country | Session | Low | Pushes low-margin add-ons; threshold must be stated clearly | A/B test; metric average order value and conversion; guardrail margin |
| 17. Threshold-filling add-ons | Gap to free delivery, cart contents | Session plus catalogue rules | Medium | Irrelevant cheap items; returns of add-ons | A/B test; metric order value net of returns |
| 18. Payment methods by country and device | IP country, operating system, browser | Session | Medium | Hiding a method a shopper expects; payment provider fees | A/B test by country; metric checkout completion |
| 19. Express checkout for returning customers | Logged-in or recognised customer | First-party account data | High | Security and fraud checks; stale addresses | A/B test on recognised customers; guardrail fraud and payment failures |
| 20. Cart abandonment reminders | Identified shopper left items in cart | First-party (email or SMS consent) | Low | Over-messaging; discounts that train shoppers to abandon | Holdout: 10% get no reminder; metric incremental orders |
Cart abandonment reminders (play 20) are the best-documented play in e-commerce. Klaviyo's analysis of more than 143,000 abandoned-cart flows sent in 2023 found an average placed-order rate of 3.33% and revenue per recipient of $3.65, rising to 7.69% and $28.89 for the top 10% of senders (vendor data).
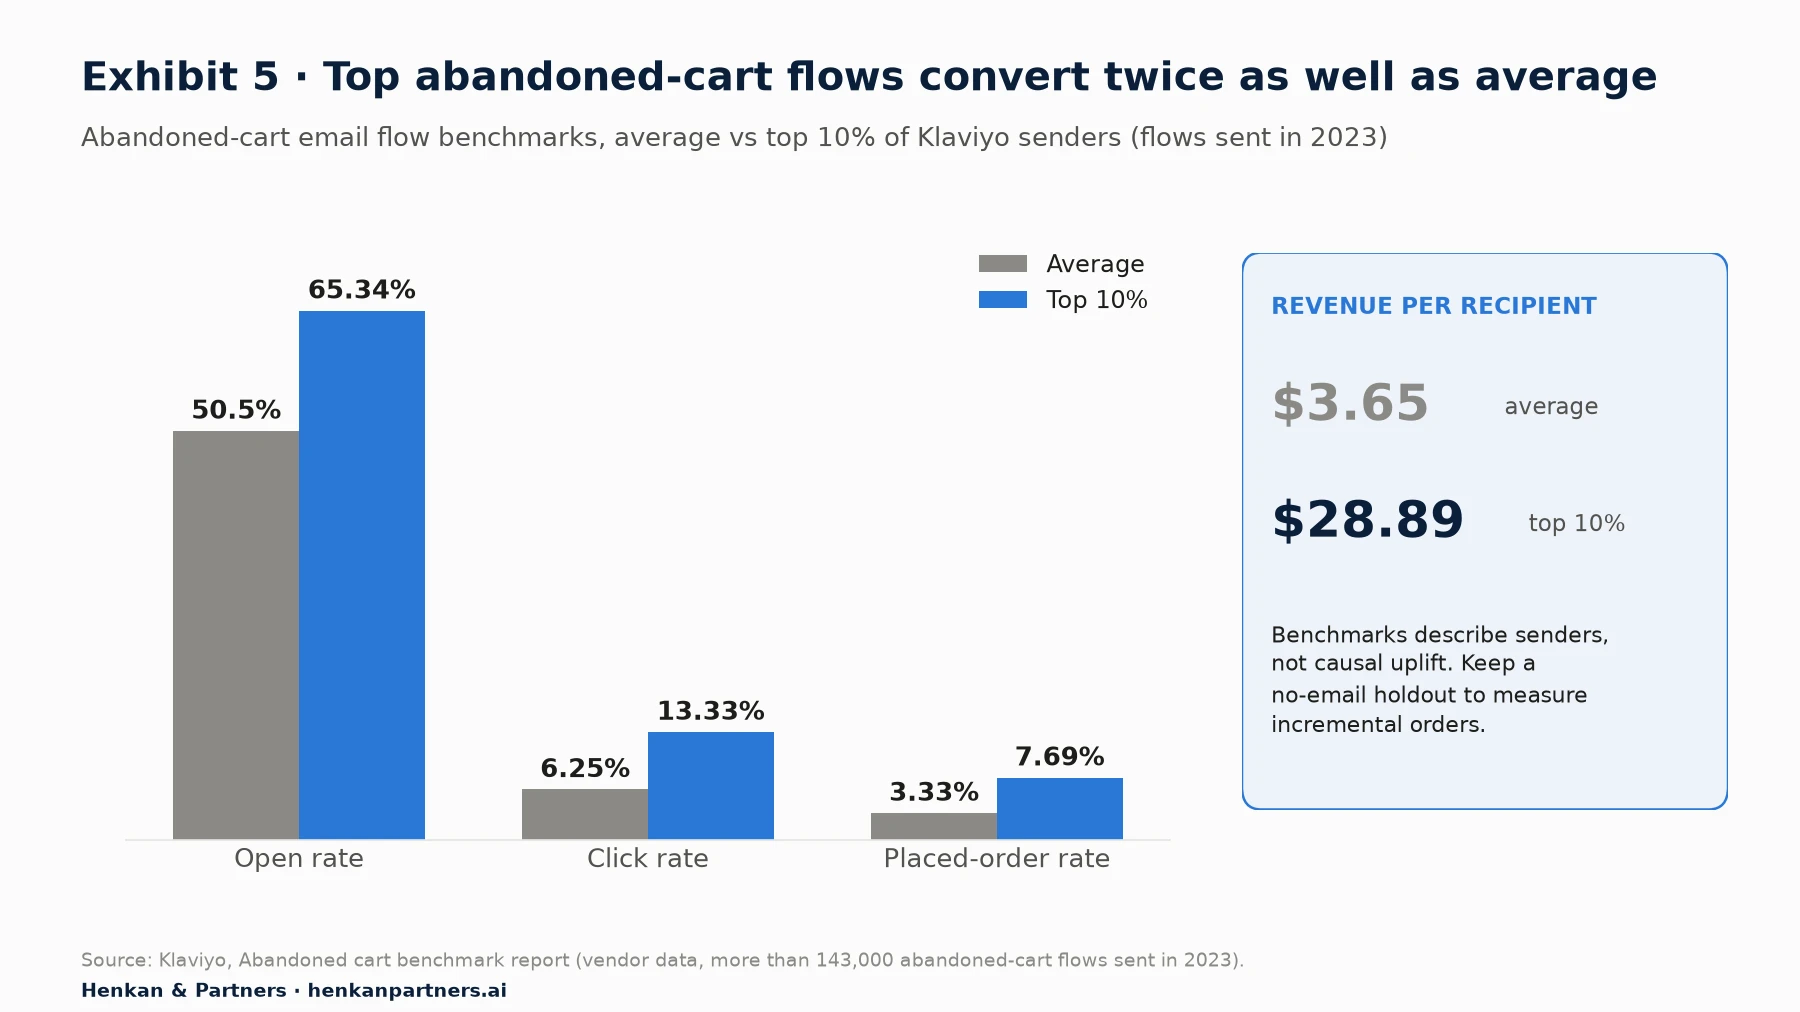
What this shows. The best senders convert more than twice as well as the average, which suggests timing, content and product imagery matter. But these are descriptions of senders, not of uplift: some of those orders would have happened anyway when the shopper came back on their own. A no-email holdout of around 10% tells you how many orders the flow actually adds and whether a discount in the second or third message is worth its cost.
Section 8 · Post-purchase and retention
After the purchase, relevance and timing matter more than cleverness
After the first order you know far more about the customer: what they bought, when, how much they spent and whether they agreed to hear from you. That makes post-purchase plays some of the most accurate you can run, and most of them run in email and SMS tools rather than on the website. Our guide to acquisition and retention channels explains how these channels fit together.
The evidence points to usefulness over volume. McKinsey found that thoughtful touchpoints such as checking in after the purchase, sending a how-to video or asking for a review generate positive brand perceptions. In loyalty, McKinsey's research found that members of paid loyalty programmes were 60% more likely to spend more on the brand after subscribing, compared with 30% for free programmes, and that members who redeem rewards spend 25% more than enrolled but inactive members. Klaviyo's benchmarks show browse abandonment emails reaching a 5.48% click rate, among the highest of its automated flows, and Klaviyo reports that automations generate up to 30 times more revenue per recipient than one-off campaigns (vendor data).
| Play | Signal or segment | Data needed | Effort | Typical risk | How to test |
|---|---|---|---|---|---|
| 21. Post-purchase onboarding | Product bought, first order | First-party order data | Low | Generic 'thank you' content adds nothing | Holdout; metric repeat purchase and return rate at 90 days |
| 22. Replenishment reminders | Consumable bought, typical usage cycle | First-party order data | Low to medium | Wrong timing annoys; needs product-level cycle data | Holdout; test reminder timing with an A/B test |
| 23. Browse abandonment reminders | Identified shopper viewed products without adding to cart | First-party (email consent plus onsite identity) | Low | Feels like surveillance if too soon or too specific | Holdout; test delay and product detail level |
| 24. Loyalty tier experiences | Tier, points balance, member status | CDP or loyalty platform | High | Tier-based prices must be transparent; complexity for staff | A/B test within each tier; metric purchase frequency |
| 25. Win-back for lapsed customers | Recency and frequency (RFM) or GA4 churn probability | GA4 predictive audience or CRM | Medium | Discounts to customers who would have returned anyway | Holdout; metric incremental reactivation and margin |
For marketers. Use RFM (recency, frequency and monetary value, a way of scoring customers on past orders) to decide who gets a win-back offer, and keep a holdout in every segment.
For leaders. Retention plays are cheap to run and easy to over-send. Set a contact-pressure limit per customer per week before you add new flows.
Section 9 · Prioritise and test
Launch the quick wins first and prove every play against a control
With 25 plays on the table, the hardest decision is the order. We score each play on expected impact (segment size, how much the change can move the metric, strength of evidence) and effort (data, build, content and maintenance). The matrix below shows our indicative scores. Your scores will differ with your traffic, catalogue and stack, so treat it as a starting point for your own workshop.
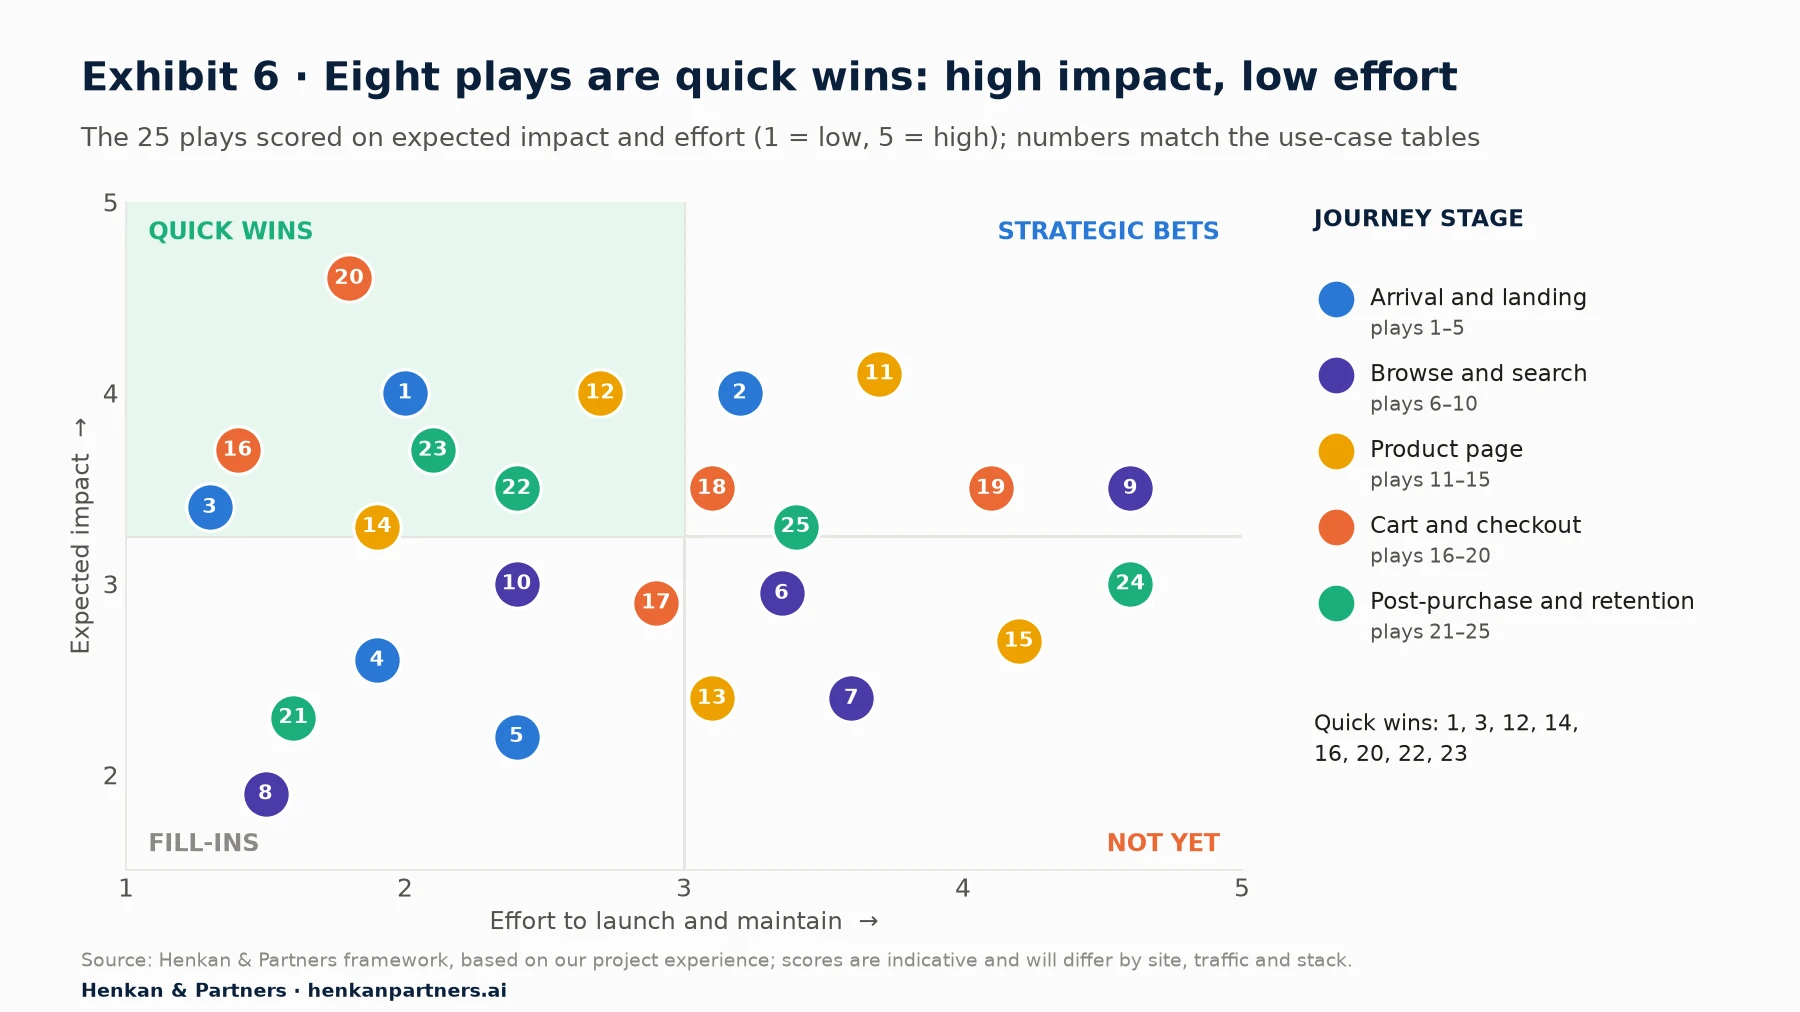
What this shows. Eight plays combine high impact with low effort, and all of them run on session data or your email tool, which you probably already have. Localisation (2), recommendations by intent (11), payment methods (18) and express checkout (19) are strategic bets: valuable, but they need more build and data work. Personalised search (9) and loyalty tier experiences (24) sit furthest right and should wait until the basics are proven.
Match the test to the play
| Test design | How it works | Best for | Limits |
|---|---|---|---|
| A/B test within the segment | Split the segment's visitors randomly between the default and the personalised experience | On-site plays 1–19 | Small segments take weeks to reach a reliable result |
| Holdout group | Keep a random share (often 5–20%) of eligible customers out of the play | Emails, recommendations, always-on plays 11, 20–25 | Needs enough volume in the holdout; must be kept clean |
| Global holdout | Keep a small share of all traffic out of all personalisation | Measuring the programme as a whole | Costs some revenue; hard to maintain across tools |
| Multi-armed bandit | Shift traffic automatically towards the best-performing variant | Short-lived content such as promotions and headlines | Weaker evidence; not suited to decisions you need to defend |
| Geo split | Compare regions with and without the play | Store-related plays such as 15 | Regions differ; needs careful matching |
Our article on segments, bandits and A/B tests explains the statistics in detail, including why small segments need long tests and how bandits trade evidence for earnings. Two rules of thumb apply to every play: decide the segment and the metric before the test starts, and check guardrails such as returns, unsubscribes and margin, not just conversion.
Where AI helps, and where it should not decide alone
AI changes the cost of personalisation more than its logic. Generative models can draft the ten headline variants a message-match play needs, write product-specific replenishment emails and summarise reviews by fit. Agents connected through the Model Context Protocol (MCP), an open standard that lets AI assistants call tools and data sources, can now read analytics and act in marketing tools: Google's official Google Analytics MCP server gives read-only access to reports and real-time data, and Klaviyo's MCP server lets an AI client review flow performance and create email campaigns.
That makes it easy to launch plays faster than you can check them. Keep a human approval step for anything customers see, keep the control group even when an AI tool proposes the change, and log every play with its segment, metric and result so that the AI and the team learn from the same record. Never let a model infer sensitive traits or set prices by profile, for the reasons in the next section.
Disclosure: Henkan & Partners designs and runs personalisation and experimentation programmes for e-commerce brands and works with several of the tool vendors mentioned in this article.
Section 10 · Limits
Do not personalise price by profile, sensitive traits or anything the shopper cannot see coming
Personalisation that feels covert undermines itself. In a study published in the Journal of Retailing in 2015, Aguirre and colleagues found that more personalised ads raised click-through intentions when the data had been collected openly, but had no significant effect when it had been collected covertly, because shoppers felt more vulnerable. In a field test on Facebook, the click-through rate of a financial-services ad fell from 0.077% at moderate personalisation to 0.032% at high personalisation.
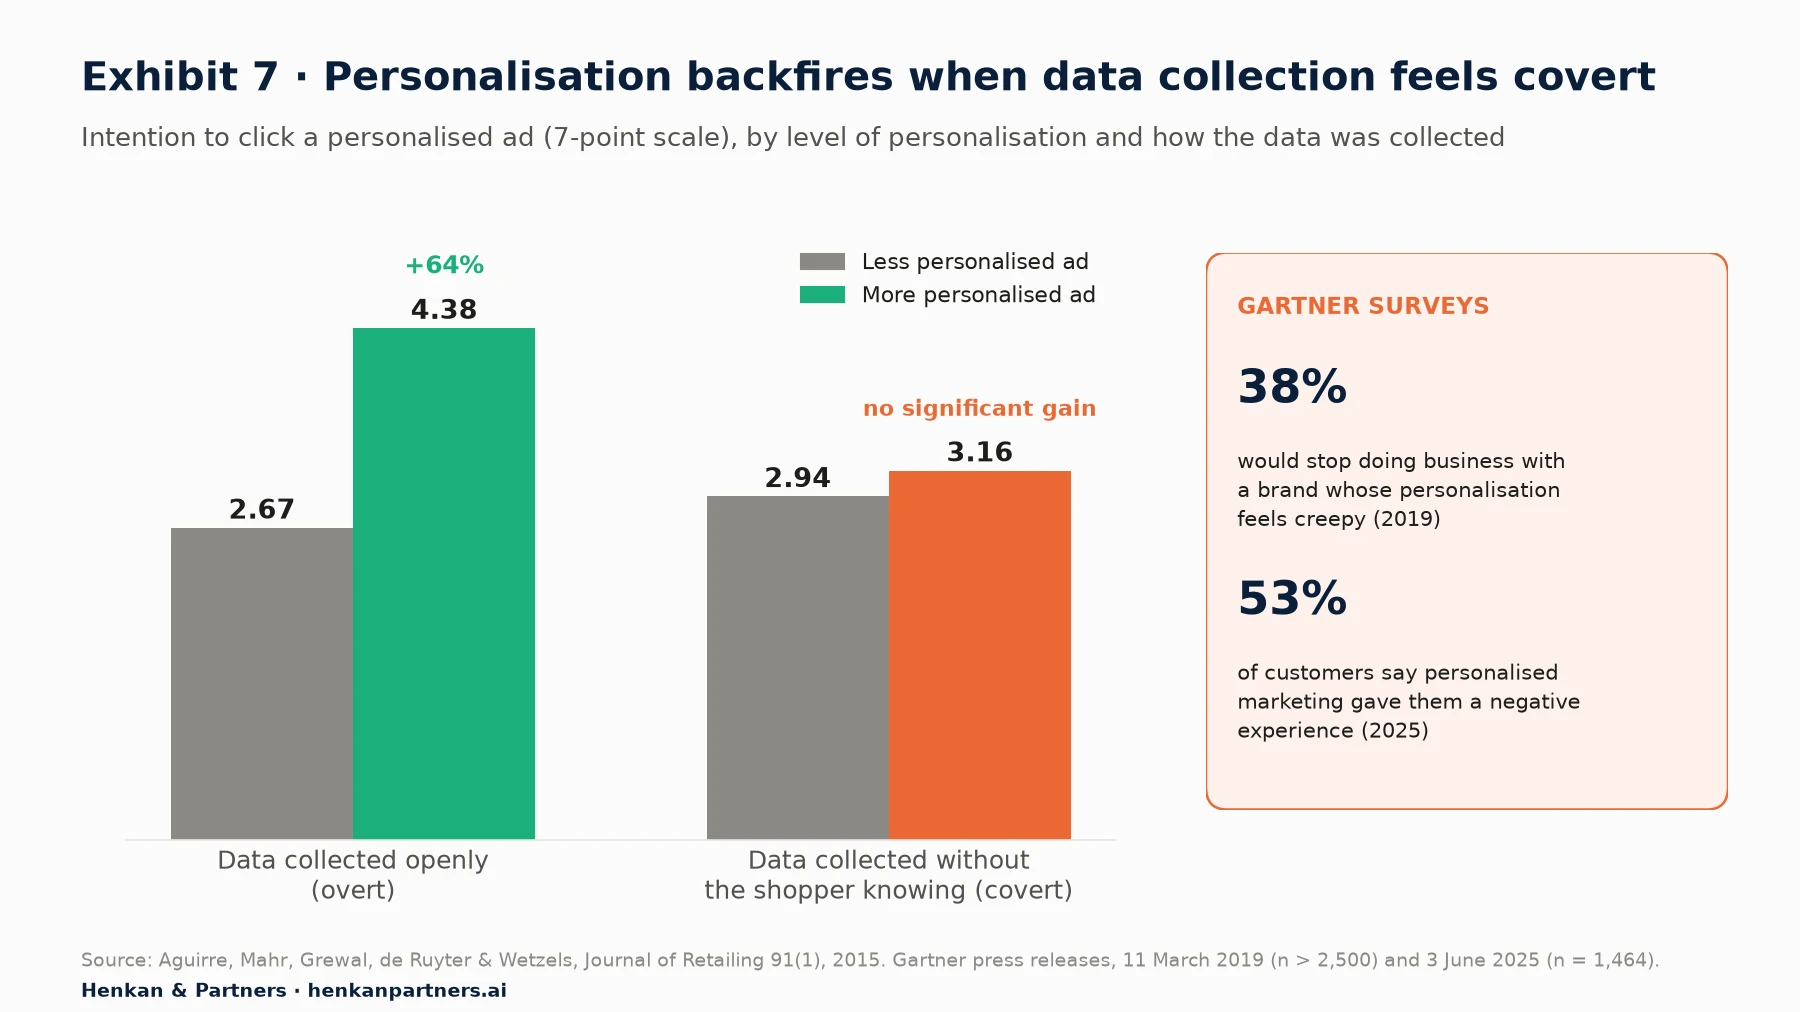
What this shows. The same personalisation that lifts intent by 64% when shoppers know how their data is used does nothing measurable when they do not. Gartner's surveys add the commercial risk: in 2019, 38% of customers said they would stop doing business with a company whose personalisation felt creepy, and in 2025 Gartner found personalised marketing generated negative experiences for 53% of customers. Transparency ('Because you viewed…', 'Showing your size') is part of the design, not a legal footnote.
Pricing and consent rules in the EU and France
The rules below are the ones we see matter most for e-commerce personalisation in Europe. This is a summary, not legal advice; check any pricing or data play with your legal team.
| Rule | What it says | What it means for personalisation |
|---|---|---|
| Personalised pricing disclosure (Consumer Rights Directive Art. 6(1)(ea), added by the Omnibus Directive; in France, Code de la consommation Art. L221-5) | Since 28 May 2022, traders must tell consumers when a price has been personalised on the basis of automated decision-making | If a profile changes the price someone sees, you must say so before purchase. Dynamic pricing based on market demand is not covered by this rule |
| Geo-blocking Regulation (EU) 2018/302 | Traders may not apply different general conditions of access, including prices, for reasons related to a customer's nationality, place of residence or place of establishment; different conditions offered to all customers in a territory on a non-discriminatory basis remain possible | Country-level price lists are allowed; showing a higher price to a visitor because of their residence while blocking the lower one is not |
| GDPR Art. 9 and Art. 22 | Special categories of data (health, religion, sexual orientation and others) need explicit grounds; people have the right not to be subject to solely automated decisions with legal or similarly significant effects | Never infer or target on sensitive traits; keep a human or clear rules in decisions that significantly affect people |
| ePrivacy and CNIL guidance | Trackers need consent unless exempt; CNIL exempts trackers that keep a shopping cart and those that personalise the user interface, such as language choice; personalised advertising trackers need consent | Cart and language plays can run without consent; storing browsing history for recommendations or retargeting usually needs it |
| Digital Services Act Art. 25, 26(3) and 28(2) | Online platforms must not use dark patterns, show ads based on profiling with special categories of data, or show profiling-based ads to users they know are minors | Applies to platforms and marketplaces; brand sites should follow the same standard |
| Unfair commercial practices | In a 2023 EU sweep of 399 online shops, 148 used at least one manipulative practice, including 42 with fake countdown timers | Scarcity and urgency messages must be true; personalising fake urgency is a legal and trust risk |
The European Commission's Work Programme 2026 schedules a Digital Fairness Act for the fourth quarter of 2026, aimed at dark patterns, addictive design and unfair personalisation practices that exploit consumer vulnerabilities. Build your plays so they would survive stricter rules: transparent, reversible and based on data the shopper expects you to have.
- Do not personalise prices by individual profile unless you disclose it and can defend it; prefer offers that everyone in a segment can see, such as a loyalty price.
- Do not use sensitive traits, inferred or declared, such as health, religion or sexual orientation, for targeting.
- Do not fake scarcity or urgency, and do not personalise countdowns.
- Do not surprise people with data they did not knowingly give, such as naming a product they viewed on a shared device in a subject line.
- Do not trap shoppers in a personalised view: every inferred filter and ranking needs a visible way out.
Section 11 · What to do next
What to do next: build a library of 25 plays and prove them one by one
1. Audit the signals you already have
List what you can read in a session today (UTM parameters, referrer, country, language, device, cart) and what you hold in your e-commerce platform and email tool. Check what your consent banner allows. Most teams find they can run half the library without new data.
2. Score the 25 plays for your site
Use the formula in Section 1 and the matrix in Section 9 to rescore each play with your own traffic, conversion rates and stack. Remove plays whose segment is too small to test within eight weeks.
3. Launch three quick wins with a control group
Start with one arrival play (message match), one cart play (free-delivery progress bar or delivery date) and one retention play (abandoned-cart reminders with a holdout). Define the metric and guardrails before launch.
4. Set a global holdout and a play log
Keep a small share of traffic out of all personalisation to measure the programme as a whole, and record every play with its segment, metric, result and decision. The log is what makes AI tools useful later.
5. Review pricing, consent and trust rules before scaling
Before adding price, loyalty or AI-driven plays, run them past legal and customer service, and make every personalised element explainable to the shopper. If you want help building your library of plays, Talk to us.
FAQ
Frequently asked questions about e-commerce personalization use cases
Frequently asked questions
What is e-commerce personalization?
E-commerce personalisation is showing different content, products, messages or offers to different shoppers based on signals such as their traffic source, location, browsing or purchase history, so that each one sees a more relevant experience. It works best as a set of specific, testable use cases rather than a single platform.
What are the best personalization use cases for e-commerce?
The plays with the best balance of impact and effort are usually campaign message match on landing pages, 'continue where you left off' for returning visitors, delivery dates by location, back-in-stock alerts, a free-delivery progress bar, cart and browse abandonment reminders and replenishment reminders. All of them use data most shops already have.
Do I need a CDP to personalise my website?
No. In our library, 13 of 25 plays need only session data such as UTM parameters, referrer, country, language and cart contents, and 8 more use your e-commerce platform or email tool. A customer data platform becomes useful when you need one identity across web, app, store and customer service.
Can I use GA4 audiences for website personalisation?
Partly. GA4 audiences take 24 to 48 hours to fill, are not retroactive and are shared natively with Google's advertising products, not your website. They suit remarketing, email and next-visit experiences; on-site use depends on your testing or personalisation tool's GA4 integration.
How much revenue does personalization add?
McKinsey reports that personalisation most often drives a 10–15% revenue lift, with company-specific results from 5% to 25%. Your result depends on which plays you run and how well; only A/B tests and holdouts show what your plays add.
How do you test a personalization use case?
Split the eligible shoppers randomly between the personalised experience and the default, decide the metric and guardrails in advance, and run until you reach the planned sample size. For emails and always-on plays, keep a holdout group that never receives the play.
Is personalised pricing legal in the EU and France?
It is not banned outright, but since 28 May 2022 traders must tell consumers when a price has been personalised by automated decision-making (Consumer Rights Directive, and Article L221-5 of the French Code de la consommation). Prices also cannot differ by nationality or residence without a non-discriminatory basis under the Geo-blocking Regulation. Check with your legal team.
Does personalization need cookie consent?
Usually yes when it stores or reads data on the visitor's device to build a profile. The CNIL exempts trackers that keep a shopping cart and those that personalise the interface, such as language choice, while personalised advertising trackers need consent.
How do I avoid creepy personalization?
Use data shoppers expect you to have, explain why they see something ('Because you viewed…'), give them a way to undo inferred filters, and never use sensitive traits. Research by Aguirre and colleagues found personalisation lost its effect when data collection felt covert.
Key terms
- Personalisation play
- A specific change shown to shoppers who share a signal, with a defined metric and test. Thinking in plays keeps personalisation measurable and easy to prioritise.
- Signal
- A piece of information about the visitor at a given moment, such as traffic source, country or cart value. Signals decide who sees a play and how quickly it can react.
- Message match
- Aligning a landing page with the ad, email or post that brought the visitor. It keeps the promise that earned the click and affects paid-search landing page experience.
- UTM parameters
- Tags added to a link that identify the campaign, source and medium of a visit. They are the cheapest and fastest signal for arrival plays.
- GA4 audience
- A group of users defined in Google Analytics 4 by behaviour or predictions. Audiences are useful for ads and email but fill with a 24 to 48 hour delay.
- Predictive audience
- A GA4 audience based on predicted purchase or churn probability. It needs enough buyers and non-buyers before Google trains the model.
- Customer data platform (CDP)
- Software that joins customer data from many channels into one profile. It matters when plays need the same identity across web, app and stores.
- RFM
- Recency, frequency and monetary value, a way of scoring customers on past orders. It is a simple, reliable basis for retention and win-back plays.
- Holdout group
- A random share of eligible customers kept out of a play. It is the only way to measure what always-on plays such as emails really add.
- Global holdout
- A small share of all traffic that sees no personalisation at all. It measures the combined value of the programme.
- Multi-armed bandit
- A test that shifts traffic towards the best-performing variant while it runs. It earns more during the test but gives weaker evidence.
- Personalised pricing
- Setting prices for specific consumers based on automated profiling. In the EU it must be disclosed, and it carries high trust and legal risk.
- Dark pattern
- A design that pushes users into choices they would not otherwise make, such as fake countdown timers. It is banned on online platforms and a target of EU enforcement.
- Model Context Protocol (MCP)
- An open standard that lets AI assistants call tools and data sources. It allows agents to read analytics and draft campaigns, which makes human approval steps important.
Sources
All sources were checked in September 2026. Figures from Salesforce and Klaviyo are vendor data, drawn from their own customers, and describe correlations rather than causal uplift. Exhibits 3 and 6, the use-case tables' effort and risk ratings, the testing designs table and the worked example are Henkan & Partners frameworks or illustrations based on our project experience. The legal summary is not legal advice.
- McKinsey & Company (2021). The value of getting personalization right, or wrong, is multiplying.
- McKinsey & Company (2013). How retailers can keep up with consumers.
- McKinsey & Company (2020). Coping with the big switch: How paid loyalty programs can help bring consumers back to your brand.
- McKinsey & Company (2021). Next in loyalty: Eight levers to turn customers into fans.
- Salesforce (2017). Personalized Product Recommendations Drive Just 7% of Visits but 26% of Revenue.
- Baymard Institute (2025). Cart & Checkout Abandonment Rate Statistics.
- Baymard Institute (2023). Use 'Delivery Date' Not 'Shipping Speed'.
- Baymard Institute (2016). Highlight Items Already in the User's Cart.
- Baymard Institute (2015). Contextual List Item Information.
- Baymard Institute (2017). 'Free Shipping' Should Not Only Be in a Site-Wide Banner.
- Klaviyo (2024). Abandoned Cart Benchmark Report.
- Klaviyo (2025). Email marketing automation examples.
- CSA Research (2020). Consumers Prefer their Own Language.
- Google Ads Help. About landing page experience.
- Google Analytics Help. Predictive metrics.
- Google Analytics Help. Audiences: limits and membership.
- Google Analytics (2025). Google Analytics MCP server.
- Klaviyo Developers. Klaviyo MCP server.
- Aguirre, E., Mahr, D., Grewal, D., de Ruyter, K. & Wetzels, M. (2015). Unraveling the personalization paradox, Journal of Retailing 91(1).
- Gartner (2019). Gartner Survey Shows Brands Risk Losing 38 Percent of Customers Because of Poor Marketing Personalization Efforts.
- Gartner (2025). Gartner Survey Reveals Personalization Can Triple the Likelihood of Customer Regret at Key Journey Points.
- European Parliament (2022). Personalised pricing, study for the IMCO Committee734008_EN.pdf).
- EUR-Lex (2018). Regulation (EU) 2018/302 on unjustified geo-blocking.
- CMS France (2025). Cartographie de la tarification dynamique dans l'univers juridique.
- CNIL. Cookies et traceurs : que dit la loi ?.
- European Commission (2023). Consumer protection: manipulative online practices found on 148 out of 399 online shops screened.
- European Parliament. Digital Fairness Act, Legislative Train Schedule.