Focus
Product Recommendations That Actually Add Revenue: Types, Placement and How to Measure Them
Alexandre Suon · 2026-09-28
E-commerce product recommendations can add real revenue, but far less than most dashboards claim. This guide explains the main recommendation types, how the algorithms work in plain language, where to place each widget, how to add margin and stock rules, and how to measure incremental revenue with a holdout test instead of trusting click-attributed influenced revenue.
Executive summary
- Recommendations work, but the honest effect is modest. Randomised field experiments at retailers found a 5.9% lift in conversion rate, an 11% lift in total sales of a product and its recommended alternatives, and a 12.4% lift in purchase likelihood. A review of published studies found that most direct revenue effects sit between 1% and 5%.
- Six widget types cover most needs. Best sellers, similar items, frequently bought together, recently viewed, personalised "for you" and complementary cross-sells each answer a different shopper question. The page decides which question matters, so placement matters as much as the algorithm.
- The 2003 idea still does much of the work. Item-to-item collaborative filtering, published by Amazon engineers in 2003, remains the backbone of "bought together" and "viewed together" widgets. Sequence models, embeddings and large language models help most with fresh catalogues, sparse data and conversational discovery.
- Plan for cold start and business rules from day one. Some models need no behavioural data (Algolia's image-based model, Google's Similar Items), while collaborative models need thousands of events. Rules for margin, stock and returns turn relevance into profit, but too many rules stop the model learning.
- Vendor "influenced revenue" is not incremental revenue. Vendors credit a click for anything from one session to 30 days. A study of 2.1 million Amazon users estimated that at least 75% of recommendation click-throughs would likely have happened without the recommendations.
- Only a holdout test proves the business case. Keep a random group of visitors without recommendations and compare revenue per visitor. In our illustrative example, the true effect was about a quarter of the dashboard figure, and proving a 3% lift with a 90/10 split needed about 3.5 million sessions.
Section 1 · Definitions
A recommendation only has value if it changes what the shopper buys
E-commerce product recommendations are automated suggestions of products, shown to a shopper on a website, app or email, that are chosen by an algorithm or a set of rules based on the catalogue, the behaviour of other shoppers and, when available, the shopper's own behaviour. Typical examples are "customers also bought", "similar items", "recently viewed" and "recommended for you" widgets.
A recommendation engine (the software that picks the products) is one of the oldest forms of personalisation. Our Essential Guide to Personalisation places it alongside content, offer and search personalisation, and our market report on personalisation since 2000 traces how recommendation vendors grew into today's personalisation suites.
The useful test for any widget is simple: would the shopper have bought less, or bought something worse for you, without it? A widget that shows a product the shopper was about to find through search anyway gets clicked, but it does not add revenue. A widget that surfaces a charger the shopper forgot, or a better-fitting alternative that prevents a return, does. Everything in this article follows from that distinction between being clicked and causing a purchase.
Three terms come up throughout. The anchor is the product or context a widget is based on (the product being viewed, the cart, the visitor). Click-through rate (CTR) is the share of widget impressions that get a click. Incremental revenue is the extra revenue that exists only because the widget was shown, measured against a comparable group that did not see it.
For e-commerce managers. Judge every widget by the revenue it adds, not the clicks or the revenue it touches. Clicks are a diagnostic, not a result.
For leaders. Ask for one number from any recommendation programme: incremental revenue per visitor against a holdout group. If nobody can produce it, you do not yet know what the programme is worth.
Section 2 · Recommendation types
Six widget types cover most needs, and each answers a different shopper question
Vendors use different names, but the same six families appear in almost every platform. Google Cloud's AI Commerce Search, for example, offers Others You May Like, Frequently Bought Together, Recommended for You, Similar Items, Buy it Again, On-sale and Recently Viewed models. Salesforce Einstein Recommendations groups them as Products in All Categories, Product to Product, Complete the Set, Products in a Category and Recently Viewed. Nosto documents more than 20 recommendation types, from best sellers to replenishment and visually similar items.
| Type | Shopper question | How it picks products | Data it needs | Where it earns its place |
|---|---|---|---|---|
| Best sellers / trending | "What is popular right now?" | Ranks products by recent views, purchases or revenue, globally or within a category | Order or view counts only | Home page, empty category states, 404 pages, first visits |
| Similar items (alternatives) | "Is there a better one for me?" | Products with similar attributes, images or viewing patterns | Catalogue attributes or images; behaviour improves it | Product page, out-of-stock pages |
| Frequently bought together | "What goes with this?" | Products that appear in the same orders more often than chance | Hundreds to thousands of multi-item orders | Product page, add-to-cart layer, cart |
| Recently viewed | "Where was that thing I saw?" | The visitor's own browsing history | Session or visitor history only | Home page, category pages, cart, email |
| Personalised "for you" | "What would I like?" | Models that combine the visitor's behaviour with patterns across all shoppers | Enough history per visitor and across the site | Home page, logged-in areas, app, email |
| Complementary / cross-sell | "Have I got everything?" | Accessories, refills and add-ons, often from co-purchase data plus merchant rules | Co-purchase data or a curated compatibility list | Cart, post-purchase page, order confirmation email |
Two distinctions matter more than the names. The first is alternatives versus complements. Similar items help a shopper choose, while complements help a shopper complete a purchase. Baymard Institute's product page research found that shoppers benefit from both kinds of suggestion, yet only 42% of 50 top e-commerce sites offered both types on the product page; the rest offered one kind or mixed them in the same element (research published in 2014, so the share today may differ).
The second is item-based versus visitor-based. Item-based widgets (similar, bought together) depend on the anchor product and work for anonymous visitors. Visitor-based widgets (recently viewed, for you) depend on who is browsing and get better as you recognise more returning shoppers. Our guide to building GA4 segments for personalisation covers how to identify those visitors in the first place.
Section 3 · Algorithms
Recommendations rest on five ideas, and the simplest often win
You do not need to build a recommender to buy one well, but you do need to know what is under the hood, because each method fails in a predictable way.
Popularity: rank what sells
Popularity models rank products by views, purchases or revenue over a recent window. They are cheap, robust and hard to beat for new visitors. Their weakness is that they show everyone the same thing and reinforce what already sells. In one news field test summarised by Jannach and Jugovac (2019), even a random recommender achieved a higher click-through rate than a "most popular" list.
Content-based: match attributes
Content-based models recommend products that share attributes with the anchor: category, brand, colour, material, price band, description or image. They need no behavioural data, so they work for new products and small sites. Their quality is only as good as the catalogue data. Google's documentation says its Similar Items model works best when product descriptions average at least 10 words, which gives a sense of how much text these models need.
Item-to-item collaborative filtering: "customers who bought this also bought"
Collaborative filtering uses the behaviour of many shoppers rather than product attributes. In 2003, Greg Linden, Brent Smith and Jeremy York of Amazon published Amazon.com Recommendations: Item-to-Item Collaborative Filtering in IEEE Internet Computing. Instead of finding similar customers (the approach most research then used), it finds related items: product B is related to product A if buyers of A are unusually likely to buy B compared with the average customer. Because item relationships can be computed in advance, it scales to huge catalogues and responds instantly.
According to Amazon Science, the algorithm had been in production for about six years before the paper was published, and in 2017 the journal named it the paper from its 20-year history that best withstood the test of time. Most "bought together" and "viewed together" widgets in today's platforms are descendants of this idea. Its weakness is cold start: it cannot relate a product nobody has bought yet.
Sequence and embedding models: predict the next click
Since the mid-2010s, deep learning has added two ideas. Embeddings represent each product and each visitor as a list of numbers, so that similar things sit close together; Google's 2016 paper on deep neural networks for YouTube recommendations is the best-known example. Sequence models read the order of a visitor's actions to predict the next item; SASRec (Kang and McAuley, 2018) applied the self-attention mechanism behind today's language models to this task. These models capture short-term intent better, which helps sites with many anonymous, single-session visitors.
LLM-based recommendations: language as the interface
Large language models (LLMs) are now used in three ways: to read product text and images so that new products get good embeddings, to generate explanations, and to power conversational discovery. A survey by Zhao et al., first released in 2023 and published in IEEE Transactions on Knowledge and Data Engineering in 2024, maps these approaches. In commerce products, Bloomreach states that its default Frequently Bought Together model for new integrations since April 2024 is a vector- and LLM-based approach, and Dynamic Yield's Shopping Muse pairs a recommendation engine with a natural-language assistant.
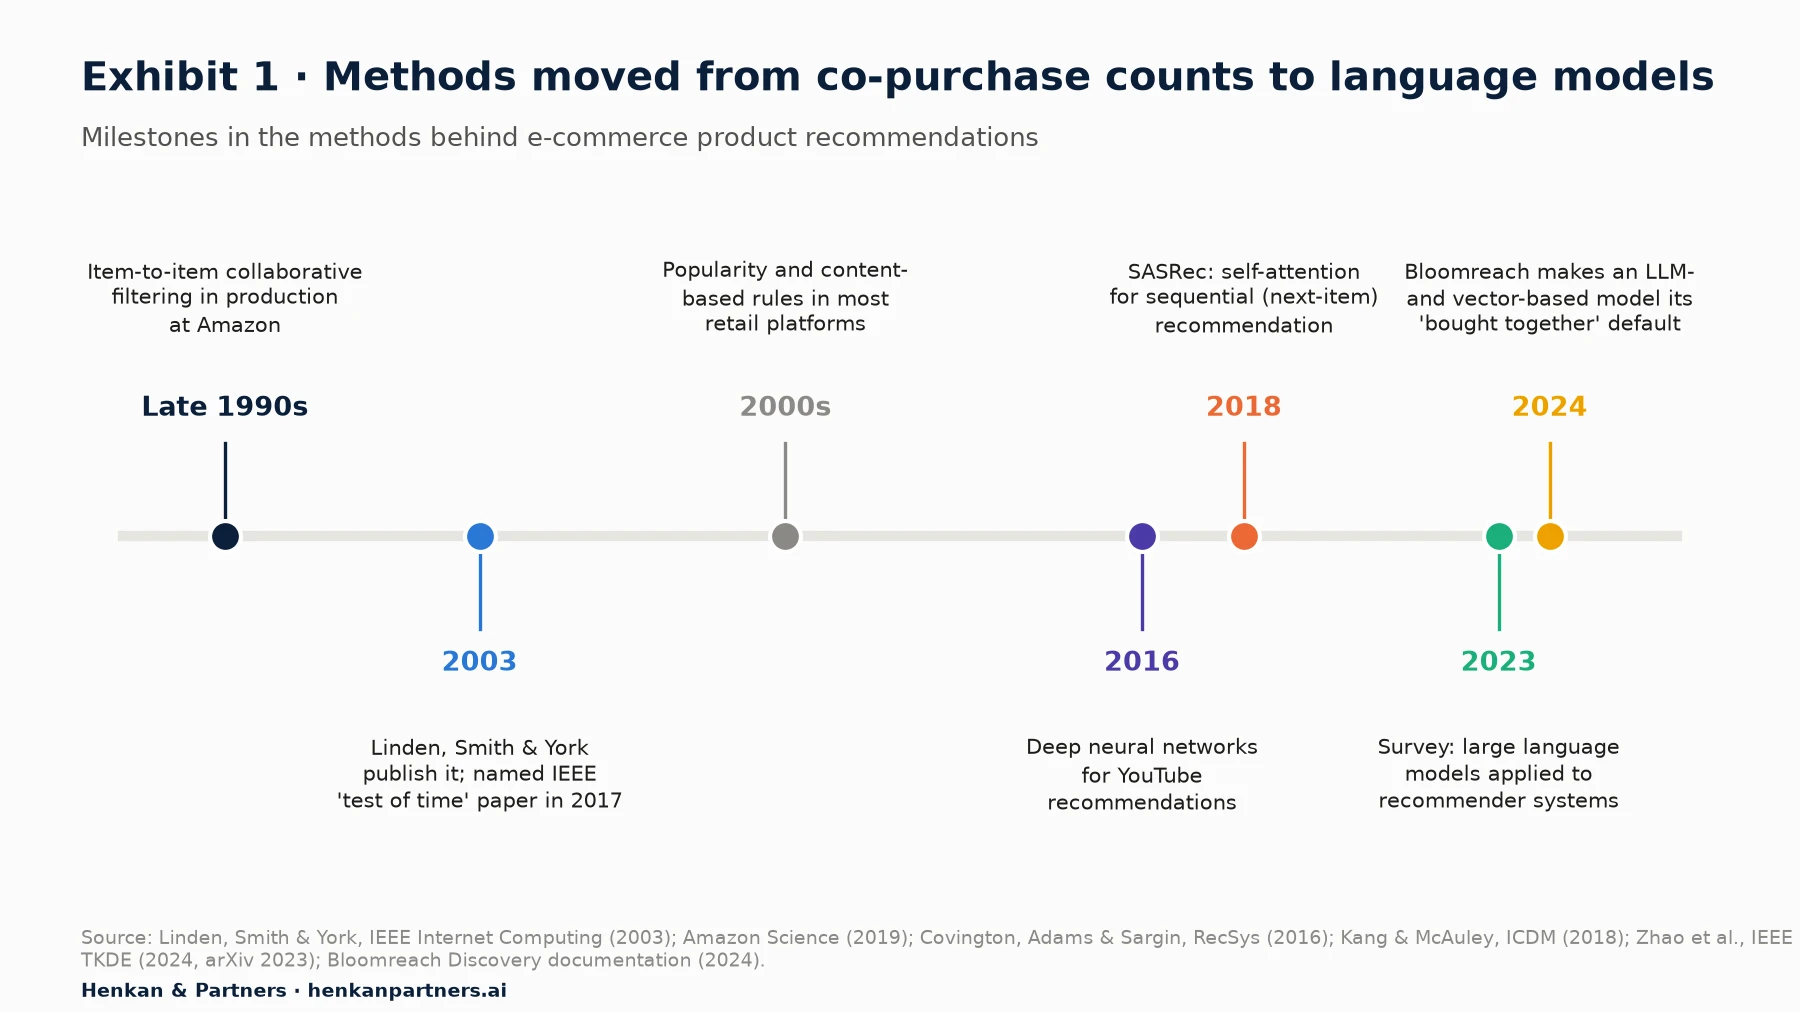
What this shows. Each new method was added to the toolbox; none replaced the others. For a mid-sized retailer, item-to-item filtering plus a popularity fallback still covers most widgets. Newer models earn their cost where catalogues change fast, visitors are anonymous or shoppers describe what they want in words.
Our view. A better algorithm is rarely the biggest lever. Netflix's Gomez-Uribe and Hunt wrote in 2015 that offline accuracy tests were not "as highly predictive of A/B test outcomes as we would like", and Jannach and Jugovac report a field study where changing the widget's position and size doubled CTR, against a 35% gain from a better algorithm. Test placement and rules before you pay for a new model.
Section 4 · Cold start
Cold start is a data problem, so design fallbacks before you launch
Cold start is the situation where a model has too little data to make good recommendations. It comes in three forms: a new site with little traffic, a new product nobody has bought, and a new visitor with no history. Each has a different cure, and vendors are explicit about the data they need.
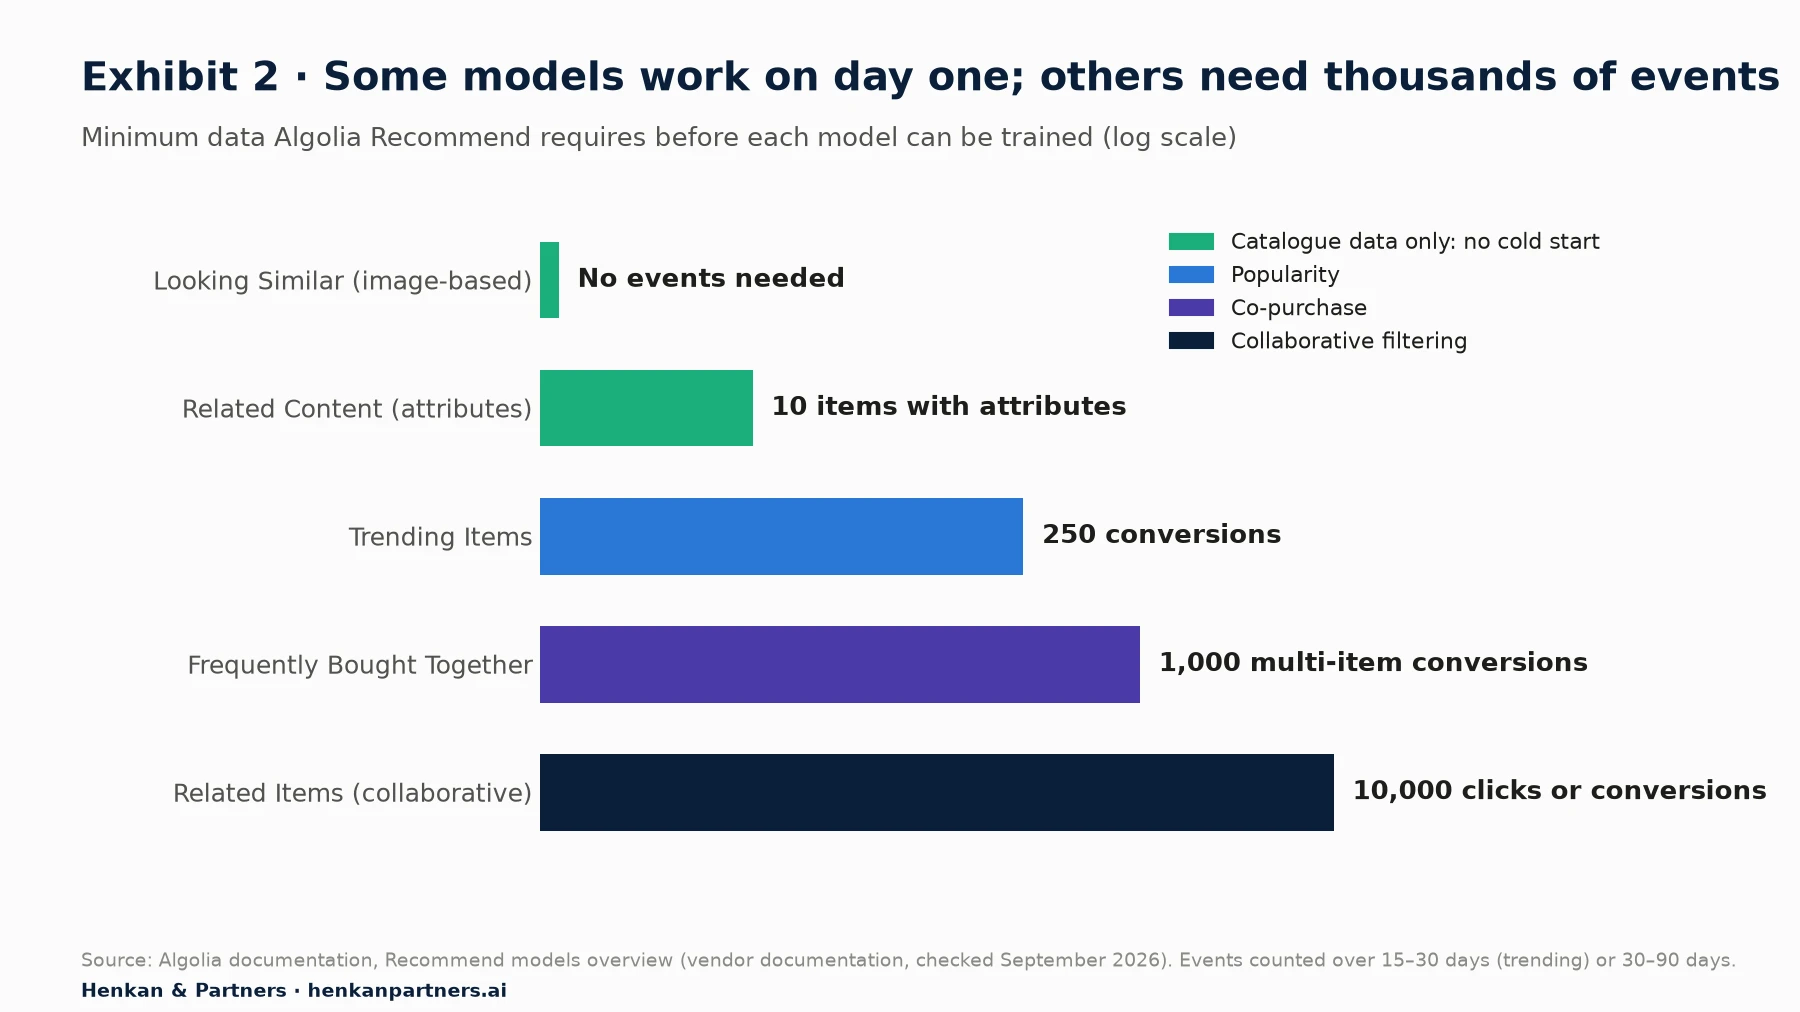
What this shows. The gap between models is three to four orders of magnitude. A shop with 300 multi-item orders a month cannot run a reliable collaborative "bought together" model on 30 days of data, but it can run image or attribute similarity from launch. The data you have should choose the model, not the other way round.
Other vendors show the same pattern. Google states that its Similar Items model "requires only information from the product catalog; no user events are required". Salesforce notes that its Recently Viewed and Products in All Categories recommenders need no anchor product, which makes them useful for empty carts and first visits.
Build a fallback chain
Every widget should have an ordered list of strategies it falls back to when the first one returns too few products. A typical chain, in our experience:
- Primary model, for example collaborative "bought together" for the anchor product.
- Content-based similarity on category, brand and price band when the product is new or rarely bought.
- Trending in the same category when attributes are thin.
- Site-wide best sellers as the last resort, filtered for stock.
- Hide the widget if even the fallback returns fewer items than the layout needs. An empty or padded carousel costs attention and trust.
Log which level of the chain served each impression. When you later analyse results, you will often find that a large share of "personalised" impressions were really best sellers, which changes how you read the numbers.
Section 5 · Placement
Placement matters as much as the algorithm, so match each page to its job
A shopper on a home page is exploring; on a product page they are evaluating; in the cart they are finishing. The same widget helps on one page and distracts on another. Exhibit 3 maps the widget types to page types.
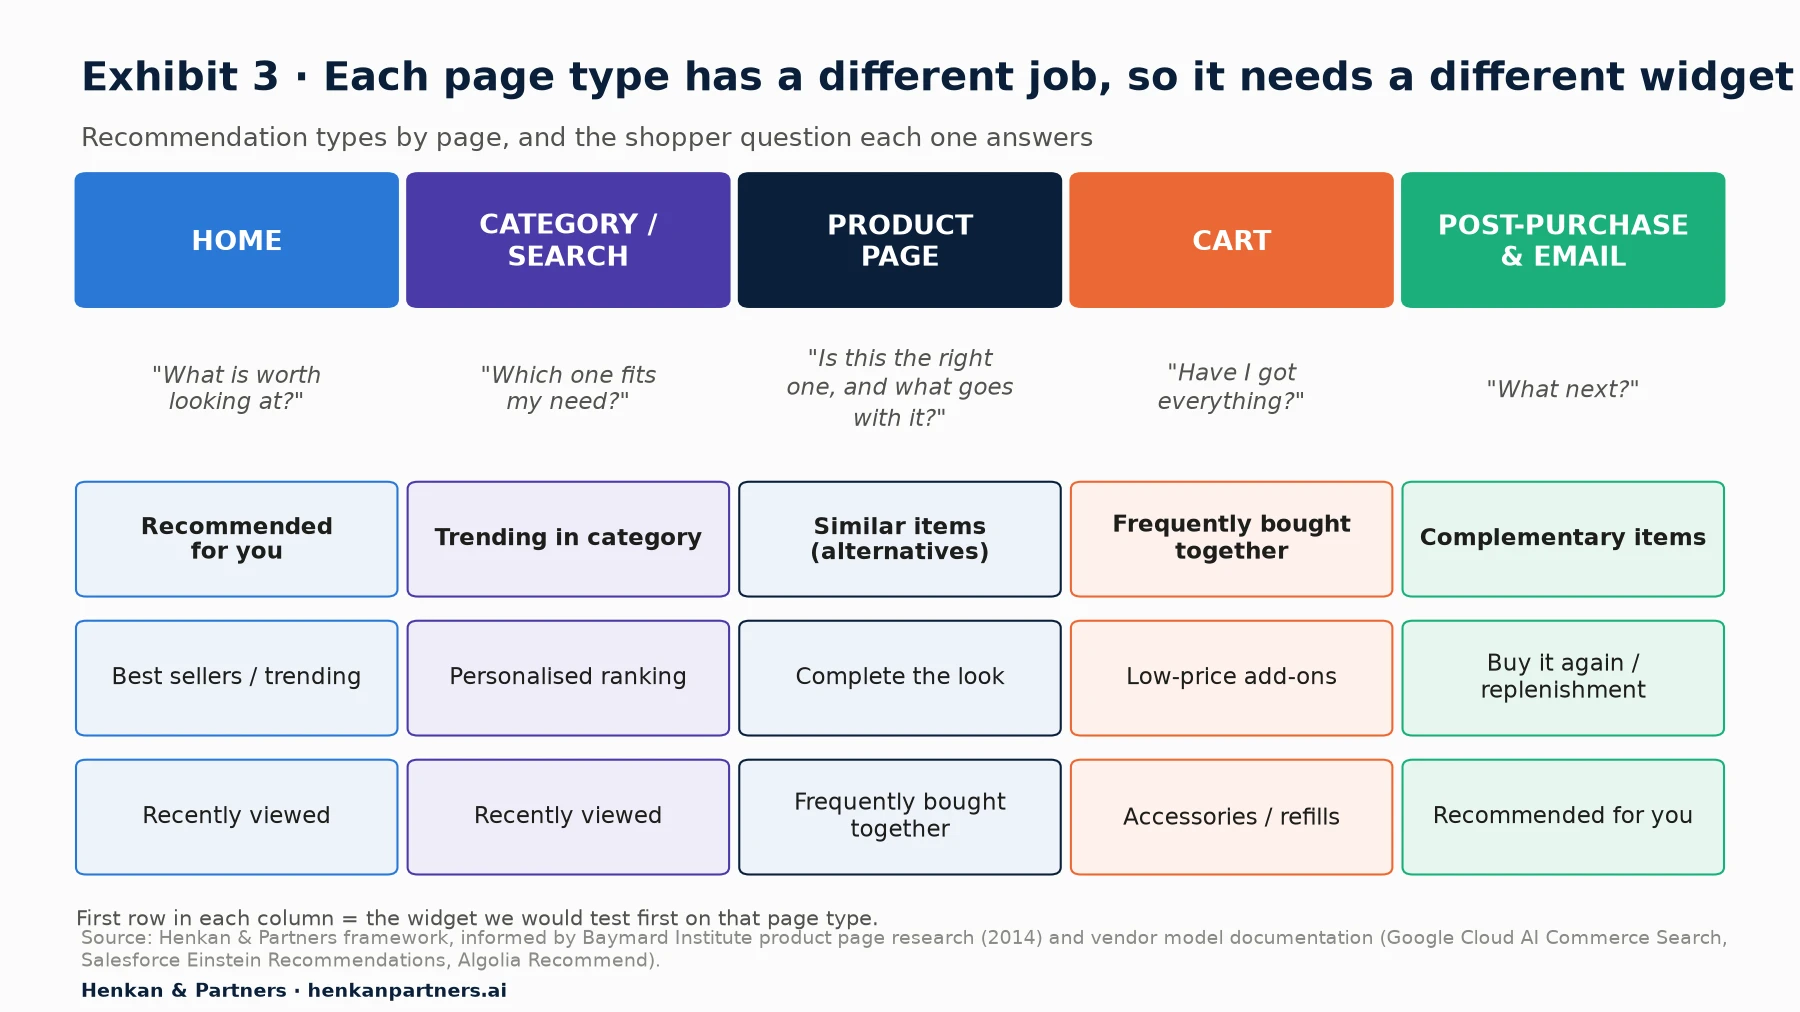
What this shows. The shopper's question changes along the journey, from "what is worth looking at?" to "have I got everything?". Alternatives belong where the shopper is still choosing, and complements where they have chosen. Putting similar items in the cart invites the shopper to reopen a decision they had already made.
Page-by-page guidance
- Home page. For returning visitors, recently viewed and "for you" usually beat generic best sellers. For new visitors, trending items are a fair default. Keep one widget above the fold at most; the home page has many jobs.
- Category and search results. Here, personalisation usually works better inside the ranking of the product grid than as a separate carousel. A "trending in this category" strip helps when the grid is long.
- Product page. Show alternatives near the product information, so a shopper who is not convinced has somewhere to go other than the back button, and complements near the add-to-cart button. Baymard's research recommends keeping the two types separate. See our product page and checkout optimisation guide for the wider page.
- Cart. Only complements, preferably low-price and low-risk. Do not push the shopper away from checkout; an add-to-cart button on each card is essential.
- Post-purchase and email. Complements to what was just bought, replenishment for consumables and "for you" for the next visit. These placements carry no risk to the current order.
For marketers. Before changing algorithms, audit your widgets: page, position, number of cards, card content (price, rating, add-to-cart), fallback strategy and whether each widget is in a holdout. That audit usually surfaces the quick wins.
For product teams. Load widgets without shifting the layout. A carousel that pushes the add-to-cart button down after the page renders can cost more than it earns.
Section 6 · Business rules
Business rules turn relevance into profit, but too many rules stop the model learning
An algorithm optimises what you tell it to: usually clicks or conversions. Your business cares about margin, stock, returns and brand. Merchandising rules are the constraints you put on top of the model. Dynamic Yield, for example, describes three kinds: include rules (only show products from a subset), exclude rules (never show a subset) and pin rules (force a chosen product into a given slot). Most platforms offer boosting (raise a product's rank) as well.
| Constraint | Typical rule | Why it matters | Watch out for |
|---|---|---|---|
| Stock | Exclude out-of-stock items and variants with few sizes left | A recommendation for an unavailable product is a dead end | Feed latency: stock must update at least as often as it sells out |
| Margin | Boost higher-margin items among equally relevant ones | Revenue lift at low margin can destroy profit | Boosting weak-margin items away can reduce relevance and conversion |
| Price | Keep cross-sells below a share of the anchor price | Cheap add-ons are easy decisions in the cart | Upsells on the product page can backfire if they reframe the price |
| Returns | Exclude or demote products with high return rates | Sold-then-returned items cost more than they earn | Needs return data joined to the catalogue |
| Brand and compliance | Exclude competing brands, restricted or age-gated items | Protects partners and legal obligations | Rules pile up; review them quarterly |
| Diversity | Cap the number of items from one brand or category | Avoids a wall of near-identical products | Too much diversity reduces relevance |
Two findings from field experiments should shape your rules. First, price changes the effect. Lee and Hosanagar's experiment at a large North American retailer (top five worldwide by e-commerce revenue) found that the conversion benefit of recommendations fell as product price rose, and was stronger for hedonic products (bought for pleasure) than for utilitarian ones. Second, recommendations shift demand between products, not only add to it. Kumar and Hosanagar's experiment at a fashion retailer found that adding recommendation links raised views of a product by about 7.5%, but once a shopper was on a product page, outgoing recommendation links reduced that product's own sales by 1.9%, while the recommended alternatives gained 9%. The net effect was positive (11% across the product and its recommendations), but part of the "recommendation revenue" was taken from products the shopper would otherwise have bought.
A third finding concerns your catalogue. Lee and Hosanagar's study of more than 1.1 million users found that collaborative filters decreased aggregate sales diversity: individual shoppers discovered more, but similar shoppers discovered the same things, so best sellers gained share. If long-tail or new products matter to your strategy, add explicit rules for them.
Our view. Keep rules few and documented. Every rule you add is a hypothesis about profit; test the important ones (margin boosting, price caps) against the unconstrained model rather than assuming they help.
Section 7 · Evidence
Controlled studies show real gains, usually in single digits, not the figures in vendor decks
The strongest evidence comes from randomised field experiments, where some shoppers see recommendations and a comparable group does not. Exhibit 4 collects the published results we could verify.
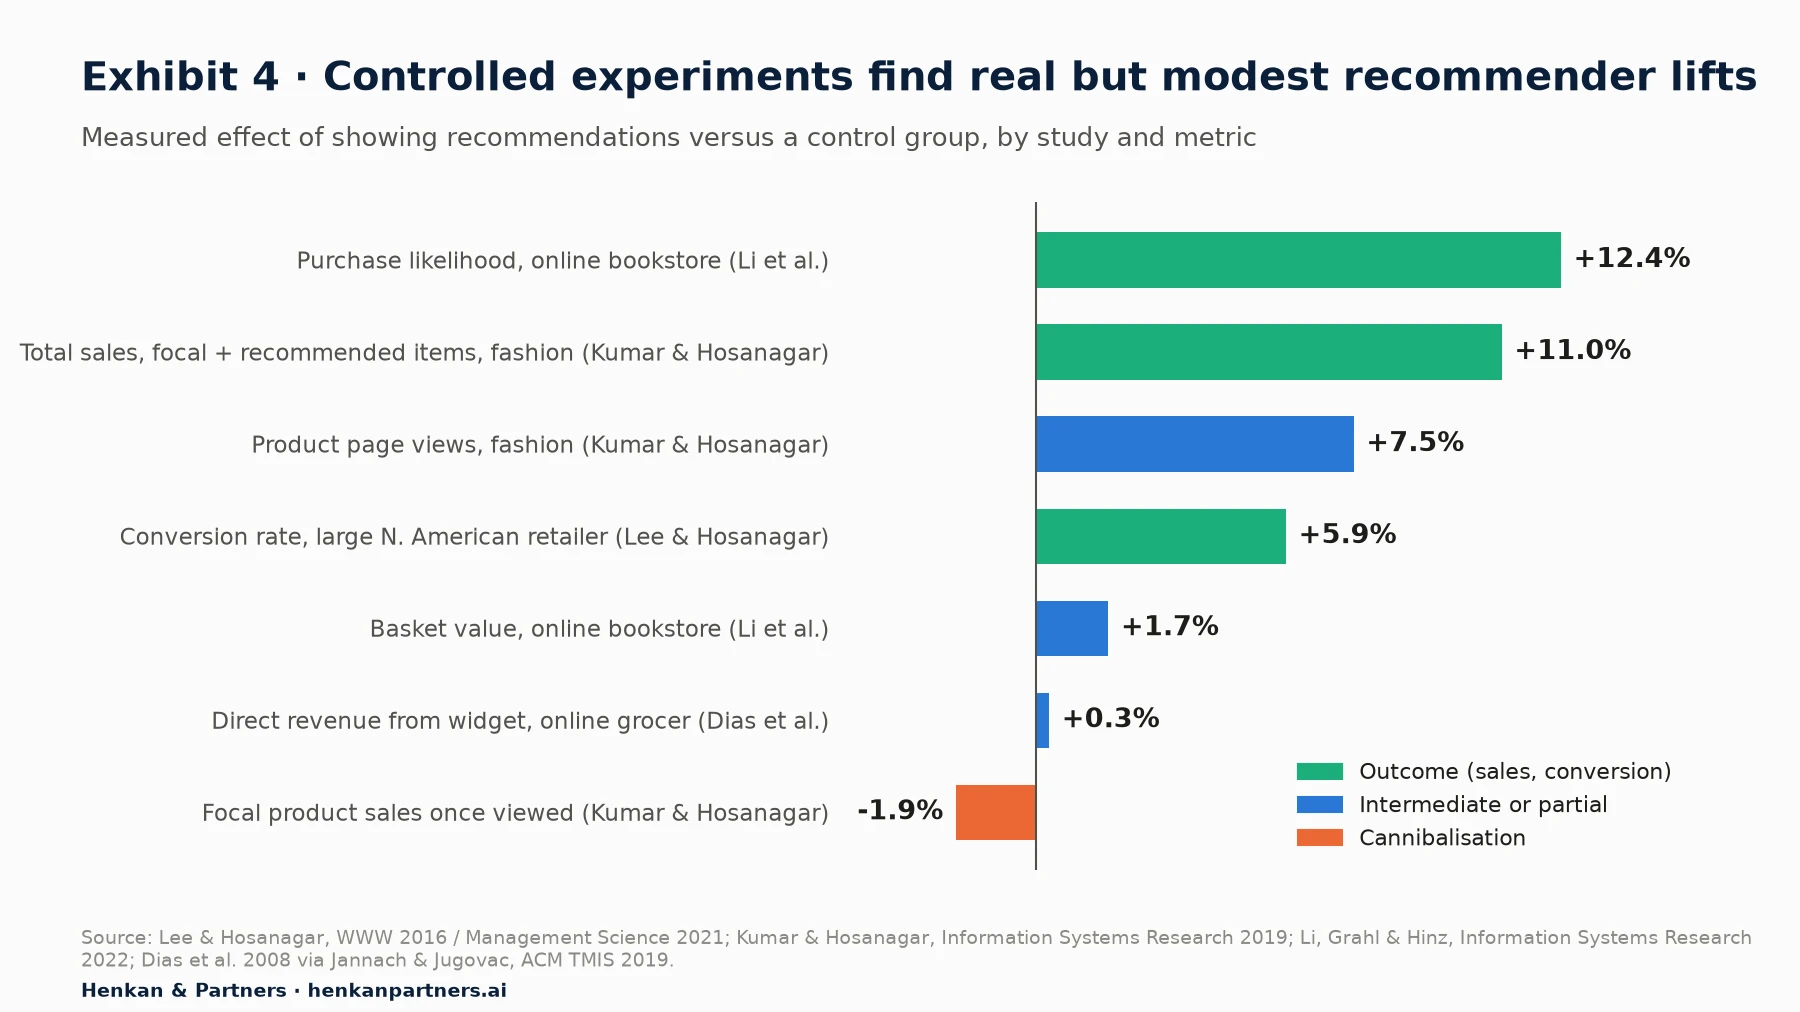
What this shows. Recommendations reliably change behaviour, but the size depends on what is measured. Effects on views and purchase likelihood are larger than effects on basket value or direct revenue. The grocer study is a useful warning: direct revenue from the widget rose only 0.3%, while the authors found much larger indirect effects on other categories, which a click-based metric would miss.
Three details matter when reading these studies. Lee and Hosanagar's experiment involved 184,375 users over two weeks and used a standard "people who purchased this item also purchased" collaborative filter, not a cutting-edge model. Li, Grahl and Hinz found that the gain came mostly from widening the set of products shoppers considered, rather than from deeper engagement with each one. And Jannach and Jugovac's review of the literature concludes that most studies measuring direct sales report increases of between one and five percent.
What about Netflix and Amazon?
Two figures are quoted in almost every vendor deck. The Netflix figure has a primary source: Gomez-Uribe and Hunt, Netflix executives, wrote in 2015 that recommendations influence choice for about 80% of hours streamed, and that the combined effect of personalisation and recommendations saves the company more than $1 billion a year, mostly by reducing subscriber churn. That is a subscription video business, where the home screen is the product; it does not transfer to a retailer's product page.
The Amazon figure, that 35% of sales come from recommendations, is harder to trace. Jannach and Jugovac note that it is often reported in online media, citing a McKinsey article, as a 2006 statement by Amazon's CEO that about 35% of sales come from cross-sales; we found no published source that explains how it was measured. We do not use it, and we suggest you do not either.
For leaders. Plan a business case on low single-digit incremental revenue from a well-run recommendation programme, then let a holdout test prove more. Headline figures in vendor case studies are usually attributed revenue, measured without a control group.
Section 8 · Attribution
Vendor "influenced revenue" is not incremental revenue, because recommendation clickers were buying anyway
Most recommendation dashboards report attributed revenue (often called influenced, assisted or recommendation revenue): revenue from purchases that followed a click on a widget. It is easy to compute and it always looks large. It is not the same as the revenue the widget caused.
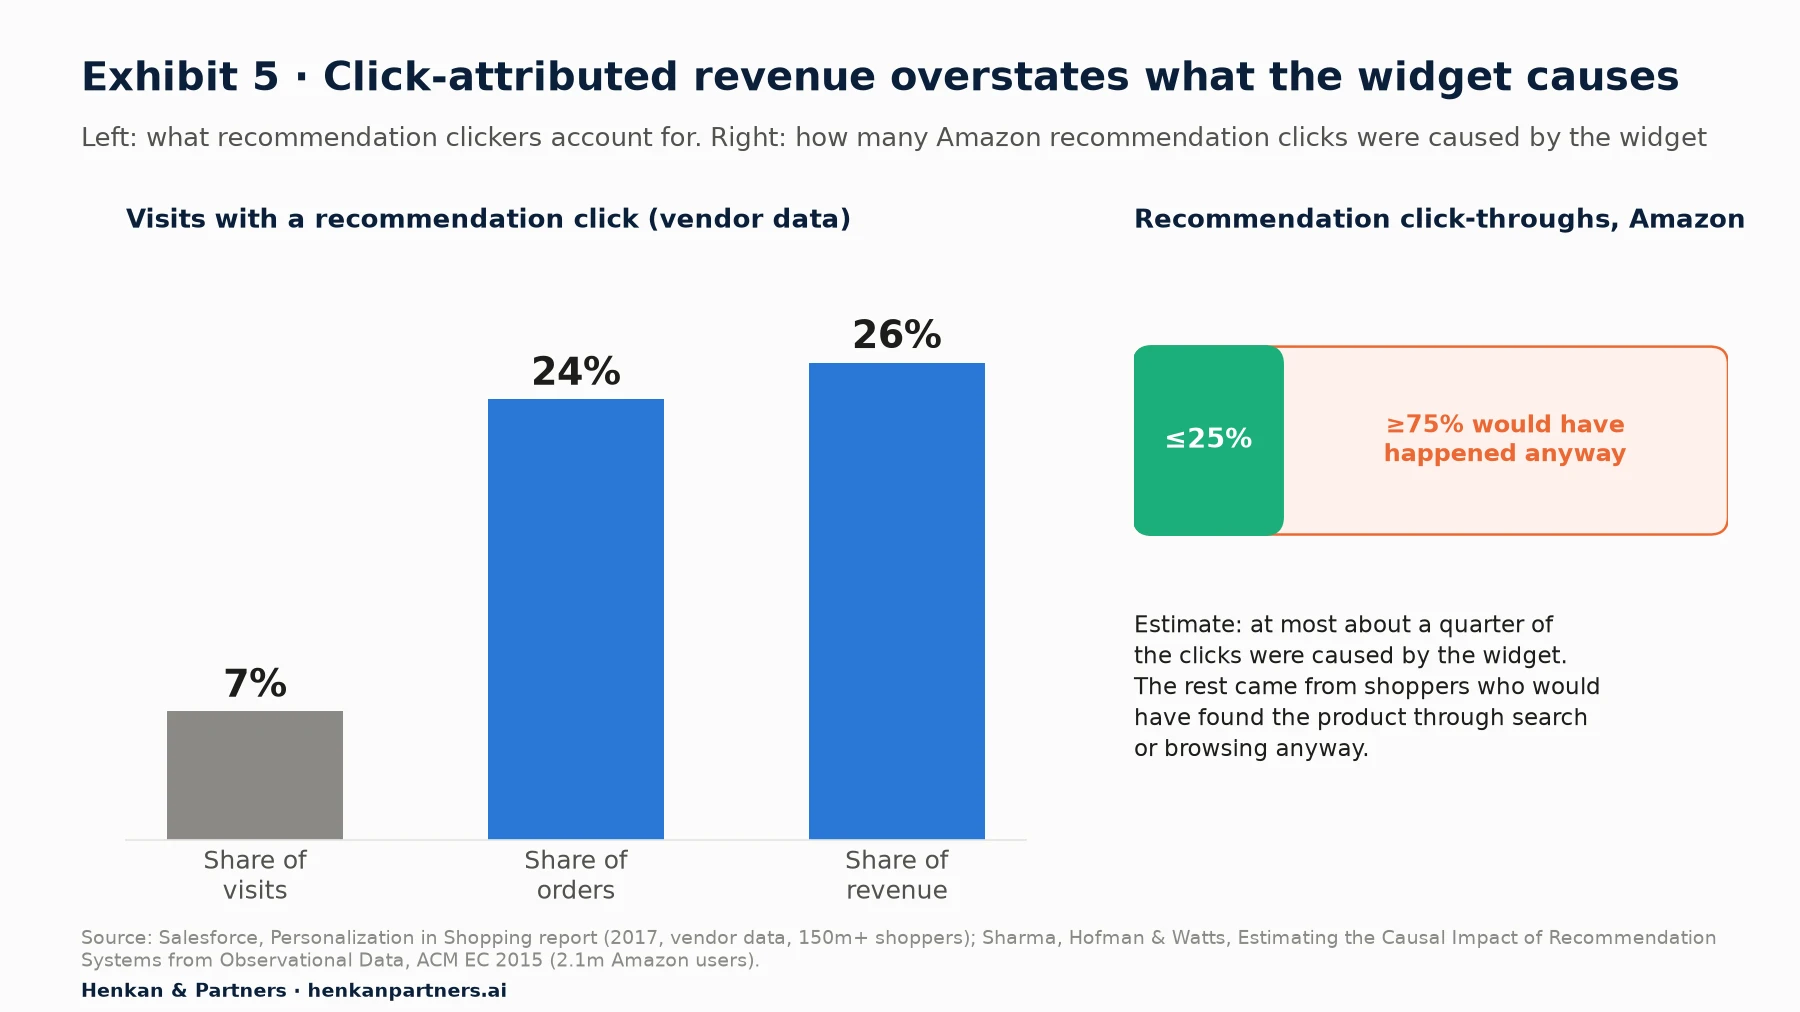
What this shows. The left panel is true but misleading: shoppers who click recommendations are the most engaged and most likely to buy, so their visits would carry a large share of revenue with or without widgets. The right panel estimates how much of the clicking was actually caused by the recommendations. Put together, attributed revenue can overstate impact several times over.
Salesforce's study of more than 150 million shoppers (vendor data) found that visits with a recommendation click were 7% of visits but produced 24% of orders and 26% of revenue, and that recommendation clickers spent 12.9 minutes on site against 2.9 minutes for others. That describes who clicks, not what the widget does. Sharma, Hofman and Watts used a natural experiment in Amazon browsing data from 2.1 million users and more than 4,000 products and estimated that at least 75% of recommendation click-throughs would likely have occurred without the recommendations, through search or browsing.
Attribution windows differ by vendor
Even among vendors that require a click, the rules differ widely, so figures from two tools are not comparable.
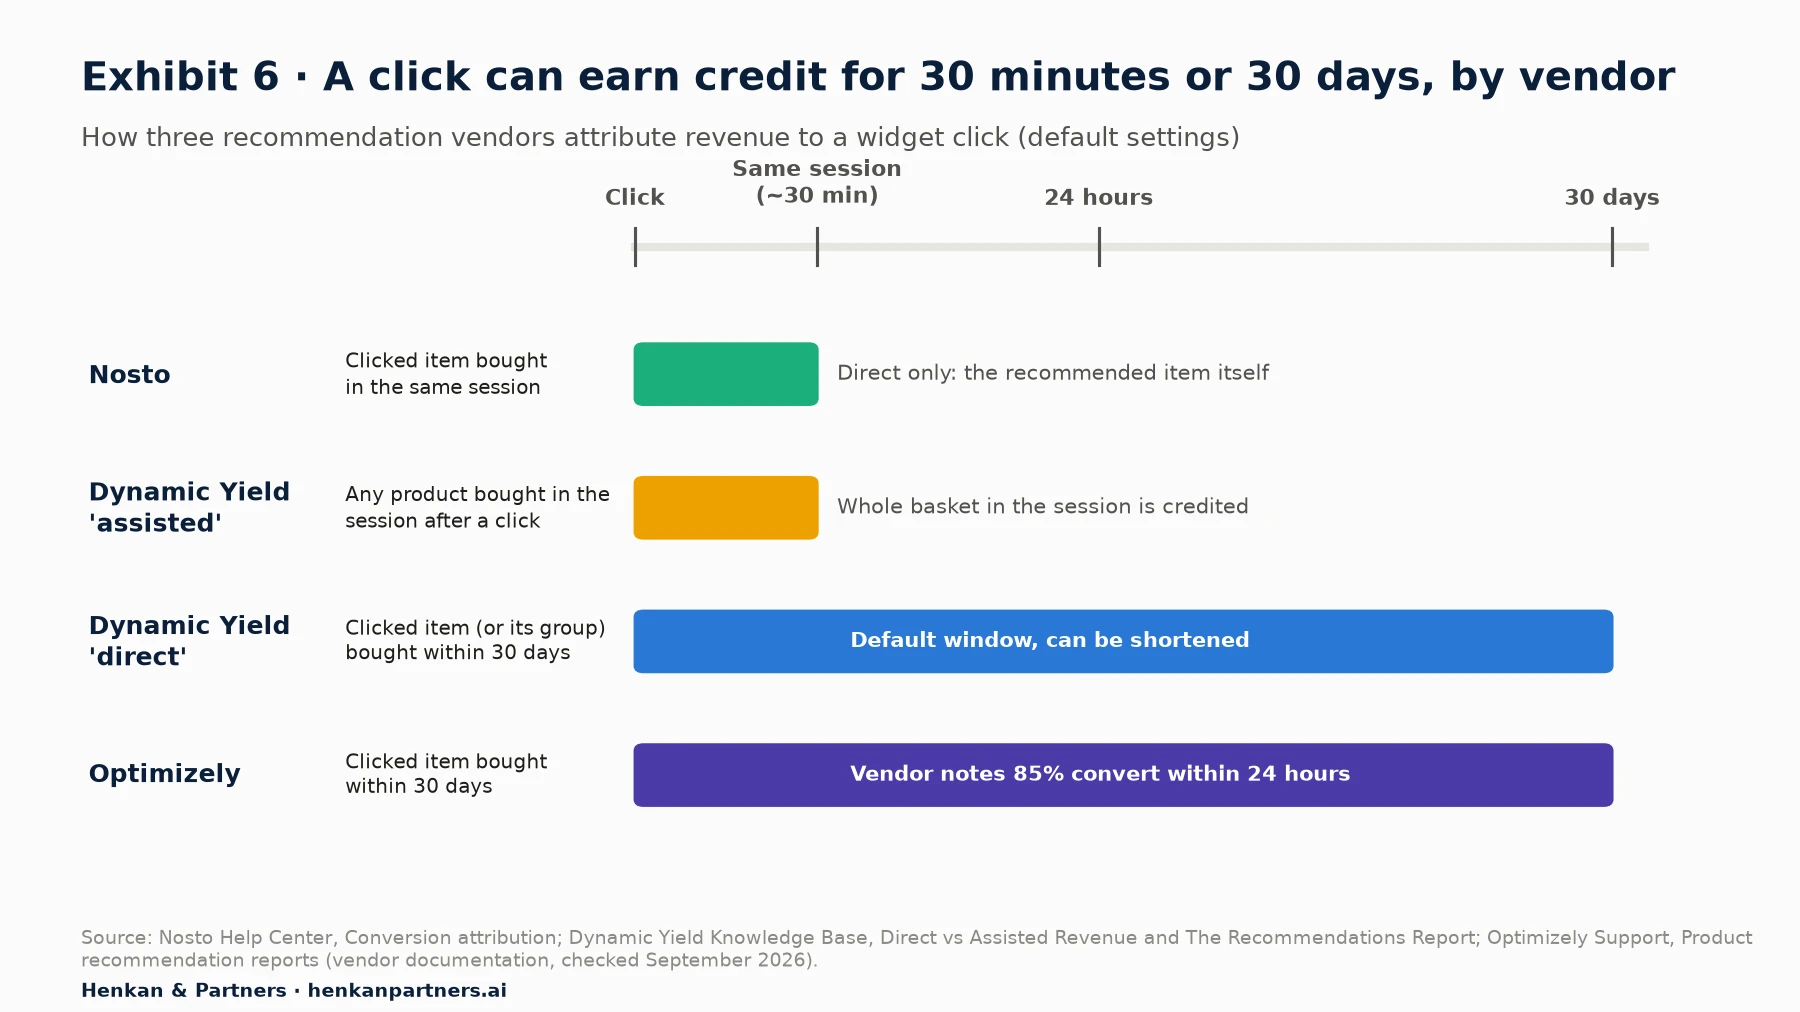
What this shows. Nosto's session rule is the strictest; Dynamic Yield's assisted revenue is the broadest, crediting any product bought in the session after a widget click. None of these definitions is wrong, but none measures incremental revenue. Use them to compare widgets within one tool, never to justify the programme.
| Vendor metric | What gets credited | Window | What it misses |
|---|---|---|---|
| Nosto sales through recommendations | Only the recommended item, clicked and bought | Same session | Purchases that would have happened via search; later purchases |
| Dynamic Yield direct revenue | The clicked item (or its group ID) | 30 days by default | Whether the click changed anything |
| Dynamic Yield assisted revenue | Any product bought in the session after a click | Same session | Whole baskets are credited to one click |
| Optimizely product recommendations | The clicked and purchased recommended items | 30 days | Whether the click changed anything |
The same logic applies to GA4. Tagging widget clicks with an item list name lets you see which widgets get used, but GA4 cannot tell you what would have happened without them. We cover the wider measurement problem in how to measure personalisation ROI.
Section 9 · Holdout testing
Only a holdout test proves incremental revenue, and it needs more traffic than most teams expect
A holdout test randomly assigns a share of visitors to a version of the site without recommendations (or with a simple baseline such as best sellers), and compares revenue per visitor between the groups. Because assignment is random, the groups are alike in everything except the widgets, so the difference is the widgets' effect.
Incremental revenue per visitor = RPV(recommendations) − RPV(holdout)
Incremental lift = Incremental RPV ÷ RPV(holdout)
Incremental revenue = Incremental RPV × visitors exposed to recommendations
Ratio to check = Incremental revenue ÷ vendor-attributed revenue
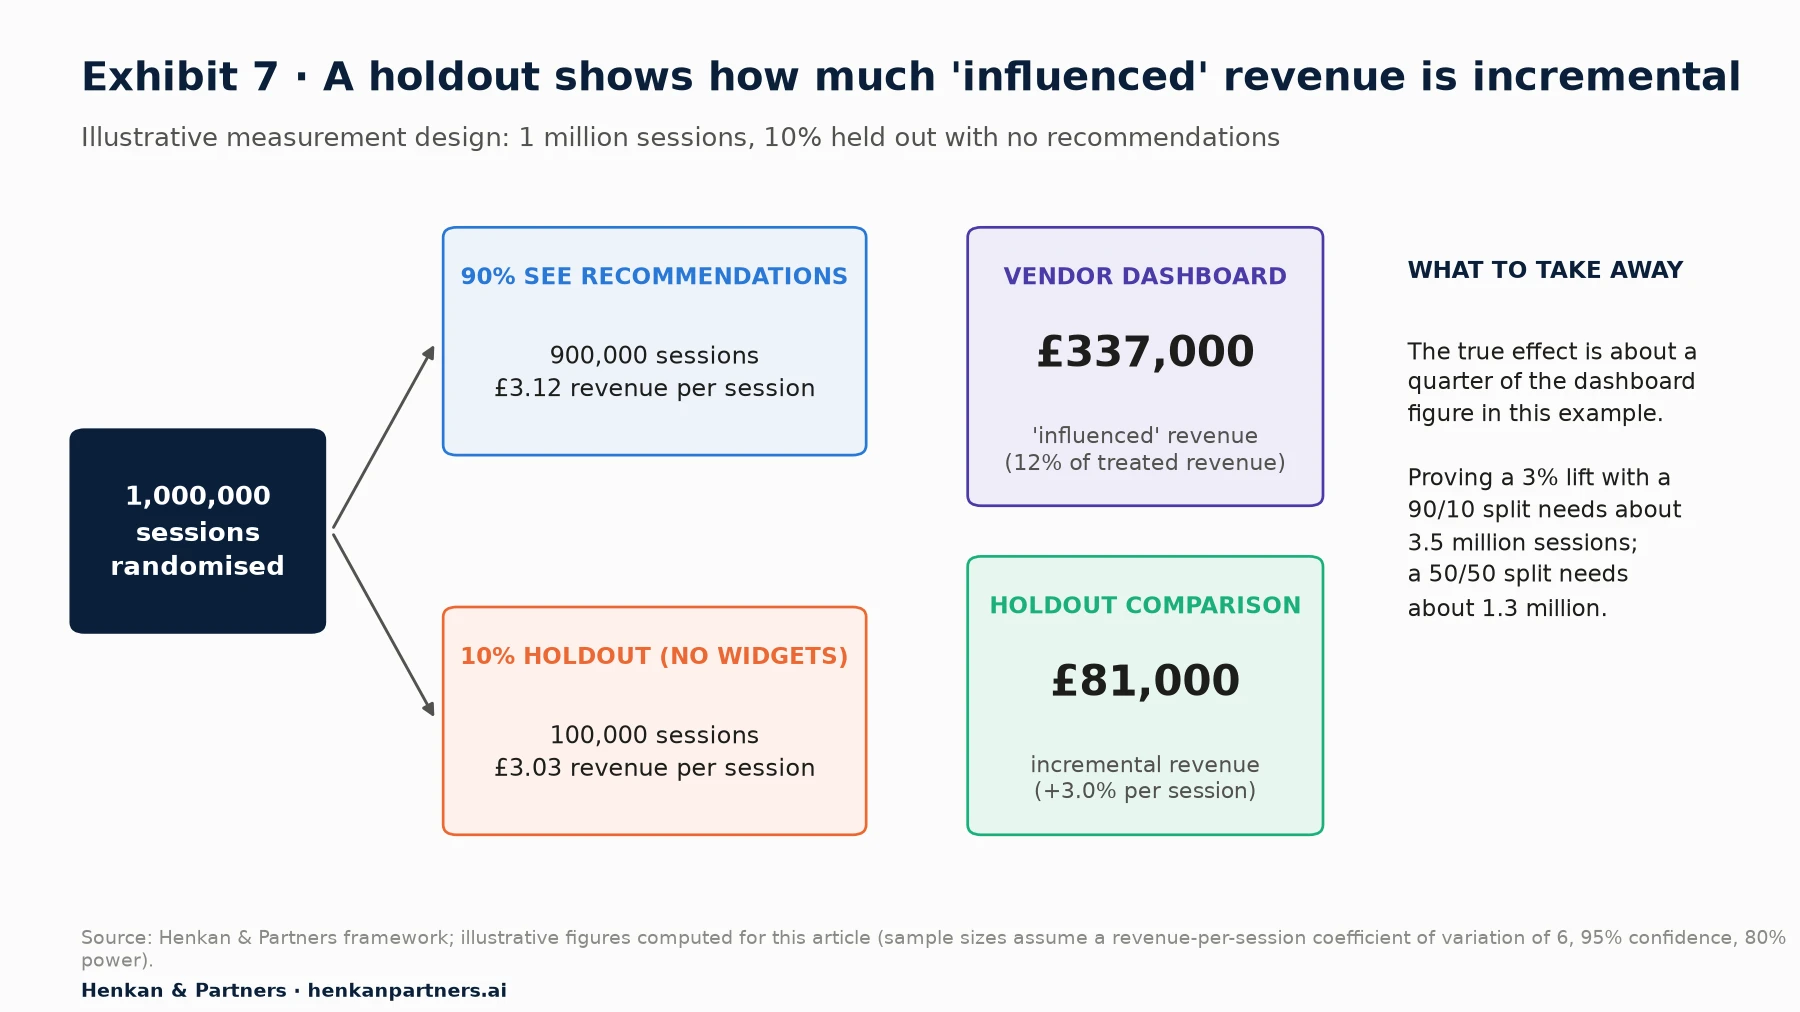
What this shows. In this illustrative example, the dashboard credits £337,000 to recommendations while the holdout shows £81,000 of extra revenue, about a quarter. That ratio is invented for the example, but it is in line with the Amazon estimate in Exhibit 5. The sample-size note is the practical catch: small holdouts take a long time to prove small lifts.
Worked example (illustrative)
Take a retailer with 1 million sessions over the test period and a 10% holdout. Sessions with recommendations generate £3.12 of revenue each; holdout sessions generate £3.03. The incremental revenue per session is £0.09, a lift of 3.0%. Across the 900,000 exposed sessions, that is £81,000 of incremental revenue. If the vendor dashboard attributes 12% of the exposed group's £2.81 million revenue to recommendations, it reports about £337,000. The widgets are profitable if £81,000, at your gross margin, exceeds what they cost; the £337,000 figure is irrelevant to that decision.
Now the traffic question. Revenue per session is noisy: most sessions spend nothing and a few spend a lot. Assuming a coefficient of variation of 6 (standard deviation six times the mean, plausible for many retailers but check your own), 95% confidence and 80% power, detecting a 3% lift needs about 3.5 million sessions with a 90/10 split and about 1.3 million with a 50/50 split. A 5% lift needs about 1.3 million sessions at 90/10. Our A/B testing guide explains the underlying calculation.
Design rules for a trustworthy holdout
- Randomise visitors, not sessions or page views, so a returning shopper always has the same experience. Use a logged-in ID where you can.
- Choose the right counterfactual. "No recommendations" measures the whole programme. "Best sellers" measures the value of personalisation over a cheap baseline. Both are legitimate; say which one you ran.
- Measure revenue per visitor and margin per visitor, not CTR. Add guardrails: returns rate, average order value and page speed.
- Run for full weeks and long enough for repeat visits, usually four weeks or more, because much of the value of "recently viewed" and email recommendations appears on later visits.
- Keep a small, permanent global holdout once the programme is live, so you can report the cumulative effect every quarter and catch decay. Our article on segments, bandits and A/B tests covers global holdouts and adaptive allocation in more detail.
- Test widgets one at a time when choosing algorithms or placements, using ordinary A/B tests on widget variants, and keep the global holdout for the programme-level answer.
For analysts. If traffic is too low for a revenue holdout, use conversion rate or add-to-cart rate as the primary metric, which is less noisy, and report revenue as a secondary estimate with its confidence interval. Do not fall back to attributed revenue.
For leaders. Budget for the opportunity cost of the holdout. In the example above, keeping 10% of traffic without widgets costs about 3% of that group's revenue while the test runs. That is the price of knowing.
Section 10 · Vendors and AI
Choose a recommendation engine for data fit and measurability, not for the demo
Most platforms can show a convincing carousel. The differences that matter are the data each one needs, the control it gives merchandisers, and whether it lets you run a clean holdout.
| Vendor | Recommendation offer (as documented) | Notable for | Check before buying |
|---|---|---|---|
| Algolia Recommend | Frequently Bought Together, Related Items, Related Content, Trending Items, Trending Facets, Looking Similar (image-based) | Published data thresholds per model; daily retraining; up to 30 recommendations per model | Whether your event volume meets the thresholds |
| Mastercard Dynamic Yield | Strategies such as Similarity and Bought Together, with include, exclude and pin rules; Shopping Muse conversational assistant | Merchandising control; direct and assisted revenue reports | How assisted revenue is used in reporting; holdout setup |
| Nosto | 20+ recommendation types, including best sellers, personalised, cross-sell, cart-based, replenishment and visually similar | Strict same-session attribution | Fit with your platform; testing options |
| Bloomreach Discovery | Frequently Bought Together (Standard model is vector- and LLM-based), Frequently Viewed Together, Similar Products, Recently Viewed, Visual Recommendations | Search and recommendations on one data layer | Pixel quality: add-to-cart and conversion tracking |
| Salesforce Einstein Recommendations | Products in All Categories, Product to Product, Complete the Set, Products in a Category, Recently Viewed | Native to Salesforce B2C Commerce | Whether you are on Commerce Cloud |
| Google Cloud AI Commerce Search | Others You May Like, Frequently Bought Together, Recommended for You, Similar Items, Buy it Again, On-sale, Recently Viewed, page-level optimisation | Choice of objective per model (CTR, conversion or revenue per session) | Engineering capacity: it is an API, not a merchandising tool |
Disclosure: Henkan & Partners sells personalisation and experimentation services, including recommendation audits and holdout testing. Vendors are named to illustrate the market, not as endorsements.
AI, agents and MCP
Two changes are worth tracking. First, conversational discovery: assistants such as Dynamic Yield's Shopping Muse let shoppers describe what they want, with an LLM generating the dialogue and a recommendation engine picking products. Dynamic Yield notes that the language model has no access to product data, so it cannot, for example, wrongly claim that a product is free, which is the right design. Second, AI agents: Algolia now offers hosted Model Context Protocol (MCP) servers, a standard way for AI assistants to call tools, which expose search and Recommend models to agents in read-only mode. As shopping agents grow, your recommendations may be consumed by software as well as people.
The risks are familiar ones in a new form. LLM-generated descriptions or explanations can be wrong, so keep facts (price, stock, compatibility) coming from your catalogue, not from the model. Conversational widgets are hard to attribute, so the holdout discipline matters even more. And personal data used to personalise recommendations remains subject to consent rules; our article on user consent in e-commerce covers the constraints.
Section 11 · What to do next
What to do next: audit, fix the basics, then prove the value
| Your situation | Start with | Measure with |
|---|---|---|
| Small catalogue or under 1,000 orders a month | Best sellers, recently viewed and content-based similar items; hand-curated complements | Conversion and add-to-cart tests on widget variants |
| Mid-market retailer on a SaaS platform | Item-to-item bought together and similar items, with stock and margin rules | A/B tests per widget plus a 10% programme holdout |
| Large retailer with in-house data science | Sequence or embedding models, objective per placement, LLM-assisted cold start | Permanent global holdout and quarterly incrementality reports |
1. Audit what you already run
List every widget: page, position, algorithm, fallback, rules, attribution metric and whether it is in any test. In our experience, many sites run more widgets than anyone can explain, and few have any of them in a holdout.
2. Fix placement and data before algorithms
Separate alternatives from complements, remove widgets from pages where they compete with the main action, clean the catalogue attributes and make sure stock updates reach the recommender quickly. These changes are cheap and often worth more than a new model.
3. Set a small number of business rules
Exclude out-of-stock and high-return items, cap cross-sell prices in the cart and decide whether margin boosting is worth testing. Write each rule down with the reason for it.
4. Run a programme holdout
Randomise visitors into recommendations versus no recommendations (or best sellers only) for at least four full weeks, with revenue per visitor and margin per visitor as the decision metrics. Compare the result with the vendor's attributed revenue and keep the ratio; it tells you how to read the dashboard in future.
5. Get a second opinion on the numbers
If you want help auditing your widgets, designing a holdout that your traffic can support or reconciling vendor figures with incremental revenue, talk to us.
FAQ
Frequently asked questions about e-commerce product recommendations
Frequently asked questions
What are e-commerce product recommendations?
They are automated product suggestions shown on a website, app or email, such as "customers also bought", "similar items", "recently viewed" or "recommended for you". An algorithm or a set of rules chooses the products using catalogue data, the behaviour of other shoppers and, where available, the visitor's own history.
How much revenue do product recommendations generate?
Less than most dashboards suggest. Randomised field experiments found lifts such as 5.9% in conversion rate and 11% in total sales of a product and its recommended alternatives, and a review of studies found most direct sales effects between 1% and 5%. Vendor figures such as "26% of revenue" are click-attributed and include purchases that would have happened anyway.
What is the difference between influenced revenue and incremental revenue?
Influenced (or attributed) revenue is revenue from purchases that followed a recommendation click, within a window the vendor defines. Incremental revenue is the extra revenue that exists only because recommendations were shown, measured against a random holdout group that did not see them. Only incremental revenue tells you what the programme is worth.
How do you measure the impact of product recommendations?
Run a holdout test: randomly keep a share of visitors without recommendations (or with a simple baseline) and compare revenue per visitor and margin per visitor between the groups over at least four full weeks. Use A/B tests on widget variants to choose algorithms and placements.
Which recommendation algorithm is best for e-commerce?
It depends on your data. Item-to-item collaborative filtering works well for "bought together" and "viewed together" once you have thousands of events. Content-based and image similarity work from day one. Sequence and embedding models help with anonymous visitors and fast-changing catalogues. Placement and business rules often matter more than the algorithm.
Where should product recommendations be placed?
Match the widget to the page's job: personalised and trending items on the home page, alternatives near the product information and complements near the add-to-cart button on product pages, low-price add-ons in the cart, and complementary or replenishment items after purchase and in email.
What is the cold start problem in recommendations?
Cold start is when a model lacks data: a new site, a new product or a new visitor. Collaborative models need thousands of events, while content-based and image-based models need only catalogue data. The fix is a fallback chain, from the preferred model to content similarity, category trending and best sellers.
Is the claim that 35% of Amazon's sales come from recommendations true?
It cannot be verified. A peer-reviewed review of recommender business value notes that the figure is widely repeated in online media and goes back to a 2006 statement by Amazon's CEO, and we found no published source that explains how it was measured. Netflix's figure (recommendations influence about 80% of hours streamed) does come from a primary source, but it describes a video subscription service, not a retailer.
Do AI and LLMs improve product recommendations?
They help in specific areas: building good representations of new products from text and images, conversational discovery and explanations. Bloomreach, for instance, uses an LLM- and vector-based model for its default bought-together widget. They do not remove the need for clean catalogue data, business rules and holdout measurement, and facts such as price and stock should come from the catalogue, not the model.
Key terms
- Anchor
- The product, cart or visitor a recommendation widget is based on. It matters because item-anchored widgets work for anonymous visitors, while visitor-anchored ones need history.
- Attributed (influenced) revenue
- Revenue from purchases that followed a recommendation click within a vendor-defined window. It matters because it is the figure most dashboards show, and it overstates the widget's causal effect.
- Incremental revenue
- Revenue that exists only because recommendations were shown, measured against a random control group. It matters because it is the only figure that justifies the cost of a programme.
- Holdout group
- A random share of visitors kept without the feature being measured. It matters because it provides the counterfactual needed to measure incremental revenue.
- Item-to-item collaborative filtering
- A method that recommends products bought or viewed by the same shoppers, published by Amazon engineers in 2003. It matters because it still powers most "bought together" widgets.
- Content-based filtering
- A method that recommends products with similar attributes, text or images. It matters because it works without behavioural data, which solves most cold start problems.
- Cold start
- The lack of data for a new site, product or visitor. It matters because it decides which models can run and which fallbacks you need.
- Fallback chain
- An ordered list of strategies a widget uses when its main model returns too few products. It matters because many "personalised" impressions are actually served by fallbacks.
- Embedding
- A numerical representation of a product or visitor, where similar things are close together. It matters because modern and LLM-based recommenders are built on embeddings.
- Sequential recommendation
- Models that use the order of a visitor's actions to predict the next item. It matters for sites where most visitors are anonymous and intent changes within a session.
- Merchandising rules
- Include, exclude, pin and boost rules applied on top of the algorithm. They matter because they align recommendations with margin, stock and brand constraints.
- Cannibalisation
- Sales a recommendation takes from another product the shopper would have bought. It matters because it inflates attributed revenue without adding to total revenue.
- Sales diversity
- How widely sales are spread across the catalogue. It matters because collaborative filters can concentrate sales on best sellers.
- Revenue per visitor (RPV)
- Total revenue divided by visitors in a group. It matters because it is the natural primary metric for a recommendation holdout test.
Sources
Methodology. All sources were checked in September 2026. Figures from Salesforce, Algolia, Nosto, Dynamic Yield, Optimizely, Bloomreach and Google Cloud are vendor data or vendor documentation. Academic results come from peer-reviewed field experiments and reviews; the Dias et al. grocery result is reported as summarised in Jannach and Jugovac (2019). Exhibits 3 and 7 and Exhibits A, B and E are Henkan & Partners frameworks; the figures in Exhibit 7 and the worked example are illustrative and were computed for this article.
- Jannach, D. & Jugovac, M. (2019). Measuring the Business Value of Recommender Systems, ACM Transactions on Management Information Systems.
- Linden, G., Smith, B. & York, J. (2003). Amazon.com Recommendations: Item-to-Item Collaborative Filtering, IEEE Internet Computing.
- Amazon Science (2019). The history of Amazon's recommendation algorithm.
- Sharma, A., Hofman, J. M. & Watts, D. J. (2015). Estimating the Causal Impact of Recommendation Systems from Observational Data, ACM EC 2015.
- Lee, D. & Hosanagar, K. (2016). When do Recommender Systems Work the Best? The Moderating Effects of Product Attributes and Consumer Reviews on Recommender Performance, WWW 2016.
- Lee, D. & Hosanagar, K. (2021). How Do Product Attributes and Reviews Moderate the Impact of Recommender Systems Through Purchase Stages?, Management Science.
- Carnegie Mellon University Tepper School (2020). Effects of Recommender Systems in E-Commerce Vary by Product Attributes and Review Ratings.
- Lee, D. & Hosanagar, K. (2019). How Do Recommender Systems Affect Sales Diversity? A Cross-Category Investigation via Randomized Field Experiment, Information Systems Research.
- Kumar, A. & Hosanagar, K. (2019). Measuring the Value of Recommendation Links on Product Demand, Information Systems Research.
- Li, X., Grahl, J. & Hinz, O. (2022). How Do Recommender Systems Lead to Consumer Purchases? A Causal Mediation Analysis of a Field Experiment, Information Systems Research.
- Gomez-Uribe, C. A. & Hunt, N. (2015). The Netflix Recommender System: Algorithms, Business Value, and Innovation, ACM TMIS.
- Covington, P., Adams, J. & Sargin, E. (2016). Deep Neural Networks for YouTube Recommendations, RecSys 2016.
- Kang, W.-C. & McAuley, J. (2018). Self-Attentive Sequential Recommendation, ICDM 2018.
- Zhao, Z. et al. (2024). Recommender Systems in the Era of Large Language Models (LLMs), IEEE TKDE.
- Baymard Institute (2014). Product Page Usability: Recommend Both Alternative & Supplementary Products.
- Salesforce (2017). Personalized Product Recommendations Drive Just 7% of Visits but 26% of Revenue.
- Algolia (2026). Recommend models overview.
- Algolia (2026). MCP Server (Model Context Protocol).
- Google Cloud (2026). About recommendation models, AI Commerce Search.
- Google Cloud (2026). AI Commerce Search overview.
- Salesforce Developers (2026). Configure and Test Recommenders, Einstein Recommendations.
- Nosto Help Center (2026). Recommendations Glossary.
- Nosto Help Center (2026). Conversion Attribution and Definition.
- Dynamic Yield (2026). Applying merchandising rules to product recommendations.
- Dynamic Yield Knowledge Base (2026). Direct vs. Assisted Revenue.
- Dynamic Yield Knowledge Base (2026). The Recommendations Report.
- Dynamic Yield Knowledge Base (2026). Getting Started with Shopping Muse.
- Optimizely Support (2026). Product recommendation reports.
- Bloomreach (2026). Frequently Bought Together, Bloomreach Discovery documentation.