Point of View
The Experimentation Manifesto: Three Values and 16 Principles for a Test-and-Learn Culture
Alexandre Suon · 2024-09-14
Most experiments do not win, and most experimentation programmes stall long before they change how a company decides. The Experimentation Manifesto sets out three values and 16 principles for building a test-and-learn culture that compounds, and this edition shows how to apply it in 2026, when AI makes tests cheap to launch.
Executive summary
- Most ideas fail when they are tested, so counting tests is the wrong goal. Kohavi and Thomke report that only about 10% to 20% of experiments at Google and Bing generate positive results; at Microsoft as a whole, about one-third work. Optimizely's analysis of 127,000 customer experiments puts the win rate at 12%. A programme judged on the number of tests will produce many flat results and little learning.
- The manifesto sets priorities, not procedures, in the way the Agile Manifesto did for software. It rests on two convictions (experimentation is company culture; experimentation is a strategic process) and three values: high-impact initiatives over numerous disconnected efforts, quality insights over a high volume of data, and collective, long-term effort over individual heroism.
- The 16 guiding principles turn the values into habits that can be checked. We group them under the three values and give, for each one, what good looks like and the warning sign that it is missing. Scored 0 to 2, they form a 32-point self-assessment that places a programme on a five-level maturity scale, from ad hoc to embedded.
- AI makes the first value more important, not less. Tools that generate variants and test ideas raise volume quickly; Optimizely reports that teams using its agents across the workflow run 78.7% more experiments. When only one idea in eight or ten works, more volume without strategic focus means more noise and more false wins.
- The durable advantage is shared memory, not a star analyst. Programmes that document every result, share it widely and store learnings where any team (and any AI assistant) can find them keep improving when people leave. Programmes built on one person usually do not.
- This applies to a two-person team as much as to a large enterprise. The manifesto is about how decisions are made, not about budget. A small team can adopt the three values in a quarter; a large one needs rituals, governance and a platform to make them stick.
Section 1 · Why programmes stall
Most experiments do not win, so programmes that chase test volume produce noise instead of learning
Companies know they should test more. They invest in platforms, hire analysts and data scientists, and run dozens, sometimes hundreds, of experiments a year. Yet the results often underwhelm: too many tests, too little learning. Teams burn out and stakeholders lose trust. The published evidence explains why.
The most cited figures come from Ron Kohavi, who led experimentation at Microsoft and Airbnb, and Stefan Thomke of Harvard Business School. Writing in Harvard Business Review in 2017, they reported that at Google and Bing only about 10% to 20% of experiments generate positive results, and that at Microsoft as a whole about one-third prove effective, one-third are neutral and one-third are negative. In a 2022 paper, Kohavi, Deng and Vermeer collected published success rates: 33% at Microsoft, 15% at Bing, about 10% at Booking.com, Google Ads and Netflix, and 8% for Airbnb search.
Vendor data points the same way. Optimizely's analysis of 127,000 experiments run by its customers found that only 12% produce a statistically significant improvement on the primary metric. The same analysis says the median company runs 34 experiments a year, and that a healthy programme reaches a conclusive result (a clear win or loss) in 35% to 40% of tests.
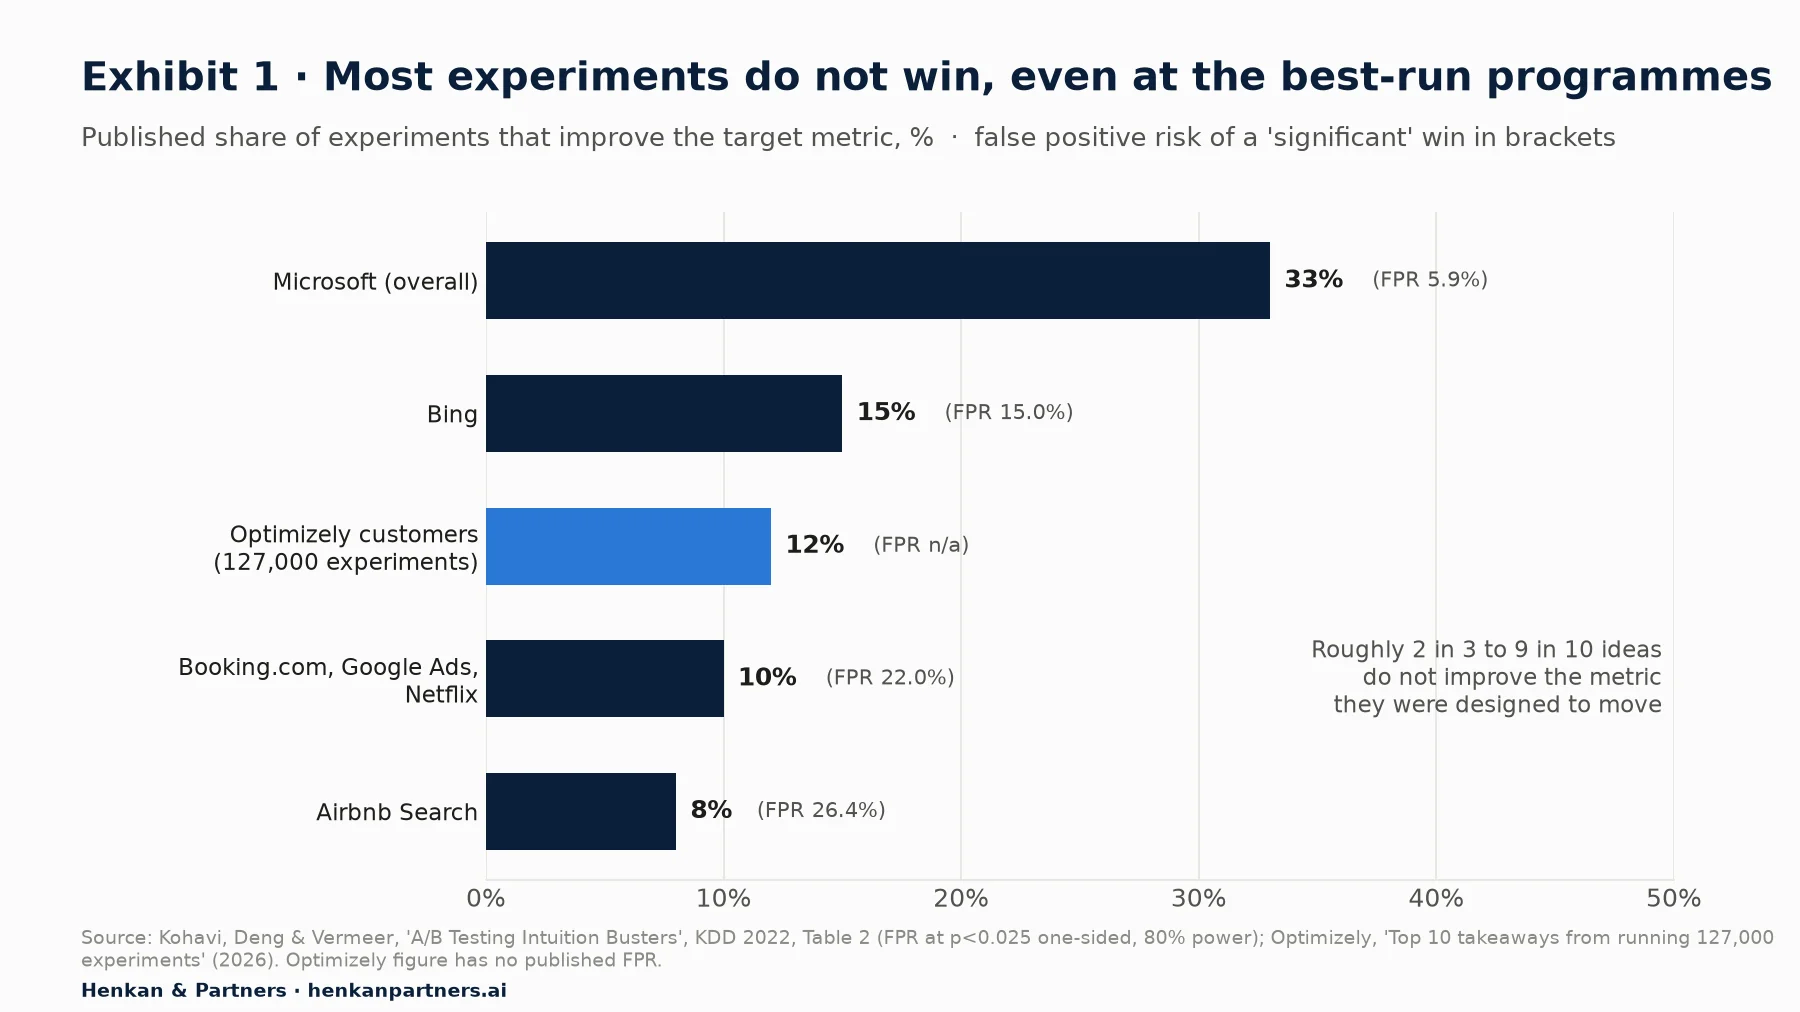
What this shows. Even at companies with world-class platforms, most ideas do not improve the metric they were built to move. When true wins are rare, a larger share of the 'significant' results are false: Kohavi and colleagues estimate a false positive risk of 22% at a 10% success rate and 26.4% at 8%, under standard assumptions. A low win rate is not a failure of the team. It is the normal state of experimentation, and the programme must be designed around it.
Three failure patterns we see in stalled programmes
In Henkan & Partners' experience, stalled programmes show one or more of three patterns, which mirror the manifesto's three values.
- Scattered activity. One product manager tests a checkout flow, another a headline, a third a price, and none of them talk to each other. Each test is small, the wins do not add up, and nobody can say what the programme has learned in a year.
- Data without insight. Dashboards report significance and uplift, but not why the result happened or what it means for customers. Results are hard to reuse, and leaders stop reading them.
- Dependence on one person. The programme runs on one brilliant analyst, one committed product lead or one engineer who cares. When that person leaves, testing slows or stops, and the knowledge leaves too.
The Kohavi and Thomke article also shows the upside that a well-run programme protects. A small change to how Bing displayed ad headlines, left in the backlog for months, raised revenue by 12% when finally tested, worth more than $100 million a year in the United States alone. Big wins exist, but they are rare and hard to predict, which is why the programme must keep running and keep learning between them.
For leaders. Do not judge the programme on test count or on the share of tests that win. Judge it on decisions changed, learnings reused and the quality of the questions being tested. A programme with a 12% win rate and a clear record of what was learned is healthy; one with a 40% win rate on trivial changes probably is not.
Section 2 · The Agile precedent
A one-page manifesto changed software because it set priorities, not procedures
From 11 to 13 February 2001, seventeen software practitioners met at the Snowbird ski resort in the Wasatch mountains of Utah, according to the history published by the Agile Alliance. They represented competing methods, including Extreme Programming, Scrum and DSDM. They did not agree on a method. They agreed on a single page: the Manifesto for Agile Software Development, with four values and twelve principles.
The four values follow a simple pattern: 'Individuals and interactions over processes and tools', 'Working software over comprehensive documentation', 'Customer collaboration over contract negotiation', and 'Responding to change over following a plan'. The closing line is the key to the format: 'while there is value in the items on the right, we value the items on the left more.'
That simplicity was its strength. The Agile Manifesto offered a compass, not a rigid methodology, that teams could interpret and adapt to their own context. It gave them permission to break away from waterfall rigidity, to embrace iteration and to involve customers early and often.
Experimentation faces a similar crossroads today. The statistical methods are well documented, for example in Kohavi, Tang and Xu's Trustworthy Online Controlled Experiments (Cambridge University Press, 2020), and testing tools are widely available. What is missing in most organisations is not method but priorities: what to test, what counts as a good result and who owns the learning. That is why we looked to the Agile Manifesto. Not to copy it, but to learn from its clarity, and to distil experimentation into a few guiding values that are practical, flexible and human.
Section 3 · Two convictions
Experimentation works when it is treated as company culture and as a strategic process
The Experimentation Manifesto rests on two core convictions. They are the foundation for the three values that follow (Exhibit 2).
Conviction 1: Experimentation is company culture
Experimentation is not confined to A/B testing platforms or analytics dashboards. It is a mindset that shapes how teams make decisions, whether in product development, marketing, pricing, operations or HR. It means replacing assumptions with evidence, opinions with data, and fear of failure with curiosity.
Research on leading companies supports this. In 'Building a Culture of Experimentation' (HBR, 2020), Stefan Thomke describes how Booking.com runs some 25,000 tests a year and lists what such a culture requires: curiosity is nurtured, data trumps opinions, any employee can launch tests, all experiments are ethical, and a more democratic model of leadership prevails. He adds that executives must be able to confront the possibility that they are wrong daily. In an HBR podcast, Thomke says Booking.com runs a little more than 1,000 concurrent experiments and that its teams are wrong about nine times out of ten.
Conviction 2: Experimentation is a strategic process
Too many organisations treat experimentation as a series of isolated tests. We see it differently. It is a strategic process: a structured, ongoing effort to surface insights, connect learnings and compound value over time. This manifesto defines how to build that process.
Researchers from Microsoft and Booking.com make a similar point with their 'A/B testing flywheel' (Fabijan, Arai, Dmitriev and Vermeer, 2020): measured value raises interest, interest funds better infrastructure, and a lower cost per test lets more people run tests. They note that lowering the human cost of testing is the step most often missed.
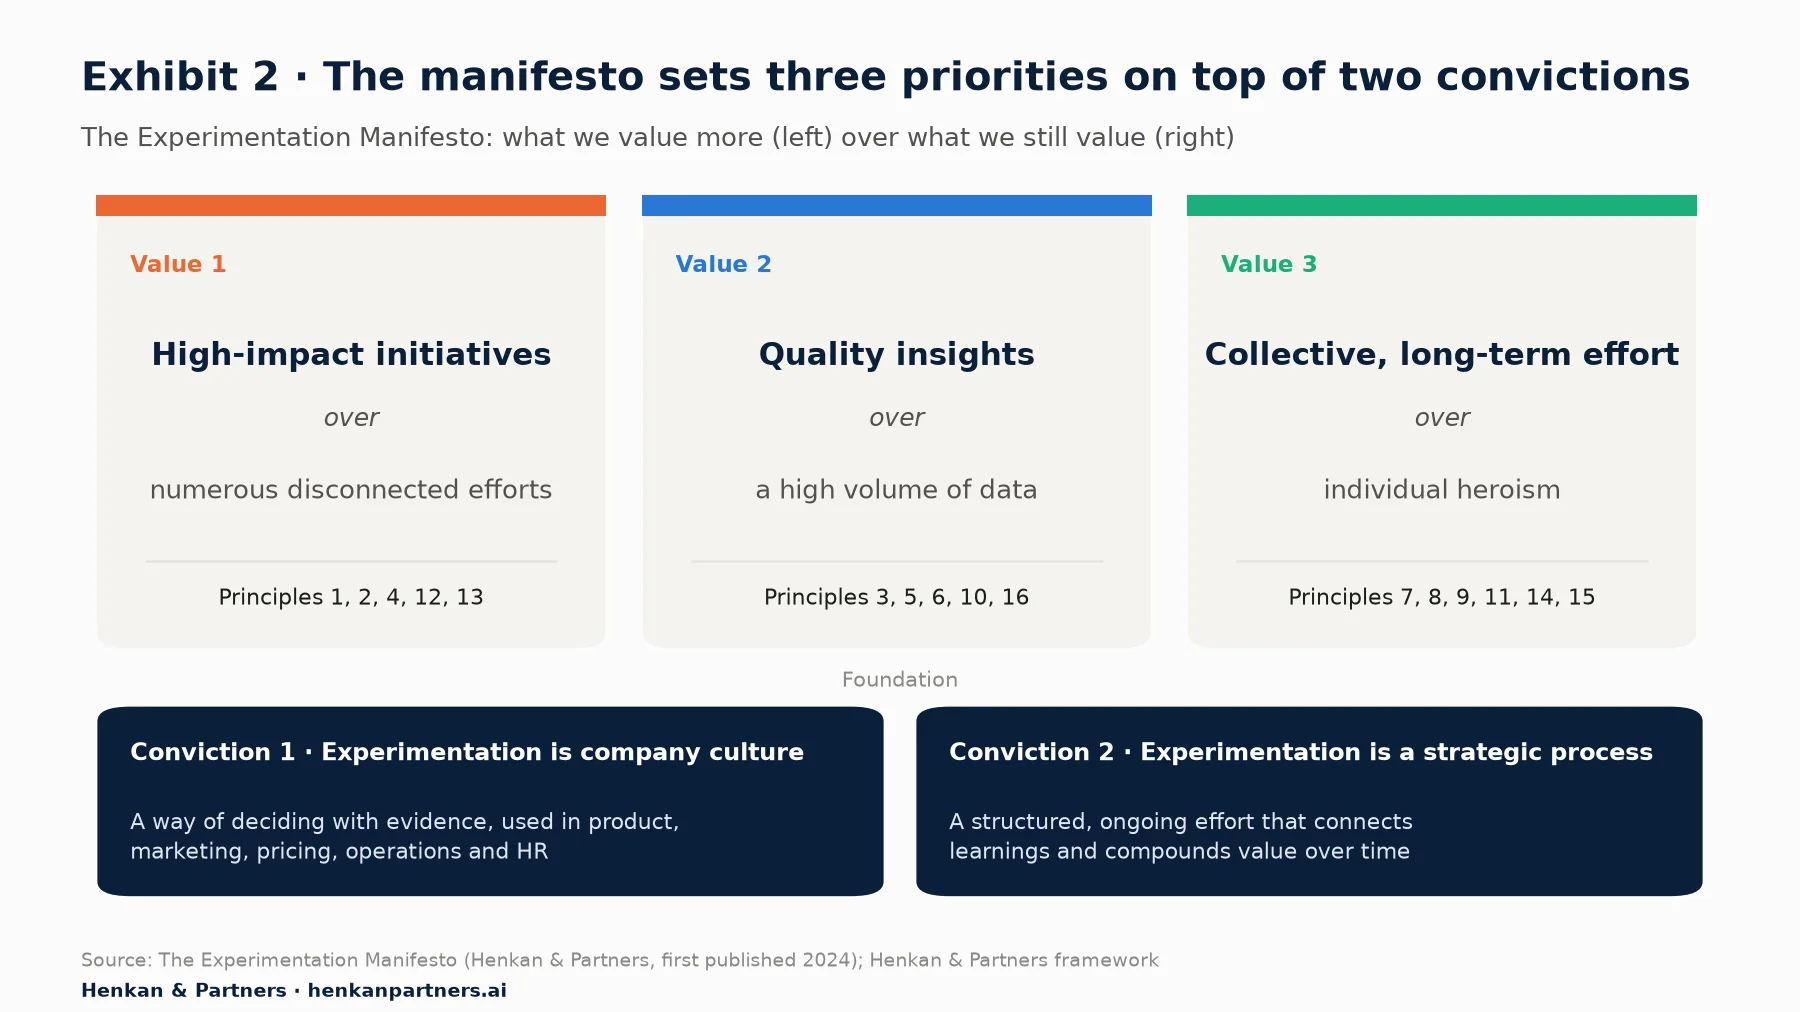
What this shows. Each value contrasts two approaches. The point is not to reject the one on the right, but to show what matters most. Every one of the 16 principles supports one of the three values, so a team that follows the principles is living the values in practice.
We have distilled our approach into these three guiding values. In short: we value high-impact initiatives over numerous disconnected efforts, quality insights over a high volume of data, and collective, long-term effort over individual heroism. This is not a slogan. It is the foundation of the manifesto, and the next three sections explain each value in practice.
Section 4 · Value 1
High-impact initiatives beat numerous disconnected efforts because learning compounds only when tests build on each other
Many organisations measure success by the number of tests they run. But volume alone does not equal value. A hundred small, isolated tests rarely deliver the same impact as ten well-designed initiatives that build on each other.
High impact means three things: aligned with strategic goals, grounded in real customer problems, and designed to uncover reusable insights, not just one-time wins. An initiative is a set of linked tests around one question, such as 'why do first-time visitors hesitate at delivery options?', rather than a list of unrelated ideas.
This does not mean testing less. Optimizely's data suggests that bolder tests perform better: experiments with four variations deliver 3.5 times the expected impact of a typical A/B test, and experiments that combine three or more types of change deliver the strongest gains. High impact means that each test earns its place by answering a question that matters.
| Dimension | Before: numerous disconnected efforts | After: high-impact initiatives |
|---|---|---|
| Where ideas come from | Whoever has an idea and a free slot | Customer research, analytics and strategic goals |
| Unit of work | Single tests on isolated pages | Initiatives: linked tests around one customer problem |
| Success measure | Number of tests launched | Decisions changed and learnings reused |
| Scope of a result | Applies to one button or page | Applies across pages, markets or channels |
| What happens after a loss | Idea dropped, nothing recorded | Hypothesis refined, next test designed from the loss |
| Roadmap | Backlog sorted by ease | Quarterly roadmap tied to business goals |
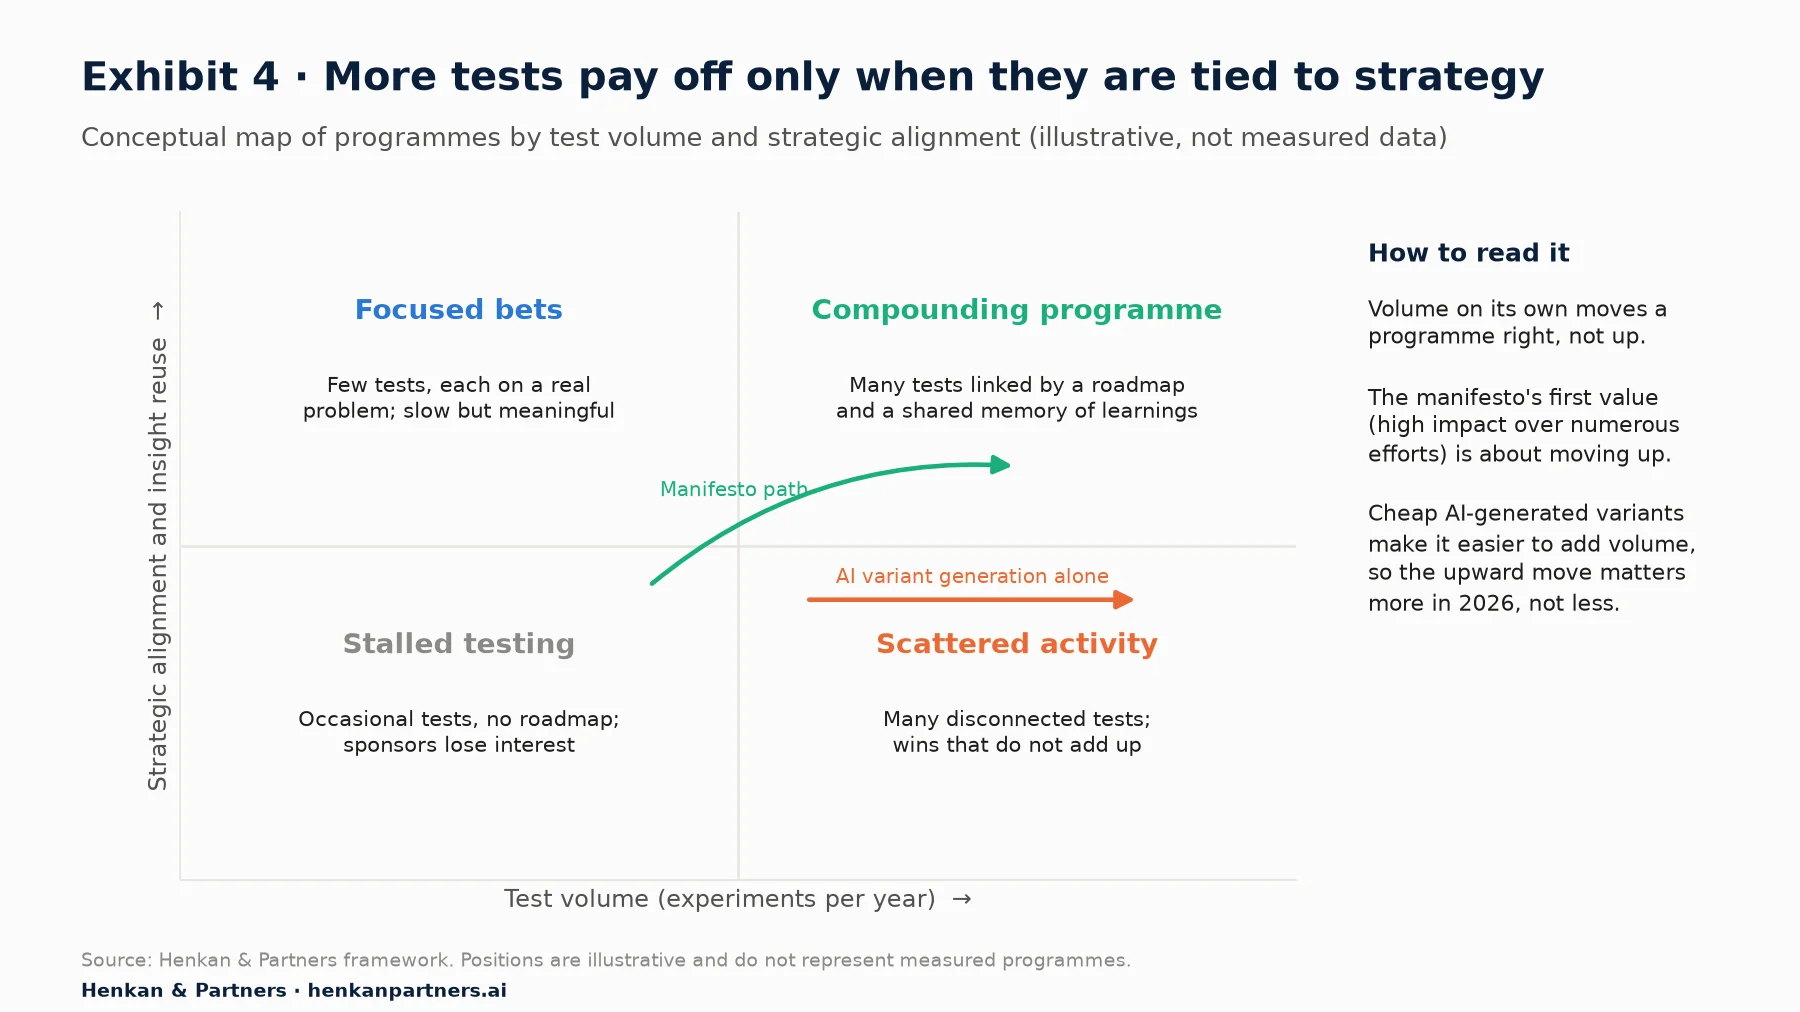
What this shows. Adding tests moves a programme to the right; only strategic focus and reuse of insights move it up. The goal is the top-right corner, where many tests are linked by a roadmap and a shared memory. A programme that adds volume without focus drifts into scattered activity: busy, but not compounding.
For marketers. Before adding a test to the backlog, write the customer problem it addresses and the business goal it serves in one sentence each. If you cannot, the idea is not ready. Group related ideas into initiatives of three to five tests.
For leaders. Ask for a quarterly experimentation roadmap tied to two or three company goals, and review initiatives rather than individual tests. Stop rewarding test count.
Section 5 · Value 2
Quality insights matter more than data volume because a p-value says what changed, not why
Experimentation produces data, lots of it. But data is not insight. A p-value tells you if something changed. It does not tell you why it changed, what it means for your customers, or how to apply it elsewhere.
Quality insights require synthesis: connecting results to user behaviour, business context and long-term strategy. They answer 'so what?' and 'what's next?'. In practice, that means combining the test result with analytics, session recordings, surveys or interviews to explain the behaviour behind the number.
Quality also means rigour. When true wins are rare, a single significant result is weaker evidence than it looks. Kohavi and colleagues estimate that at a 10% success rate, about 22% of statistically significant results are false positives (with a 0.05 significance level, counting only positive results, and 80% statistical power). Their advice for surprising results is to replicate them before rolling out widely. A programme that values quality over volume builds this check into its process.
| Dimension | Before: a high volume of data | After: quality insights |
|---|---|---|
| Test report | Uplift, confidence and a screenshot | Hypothesis, result, why it happened, what to do next |
| Metrics | Whatever the tool tracks by default | One primary metric, guardrails, agreed before launch |
| Evidence | Test result on its own | Test result plus analytics, research and customer feedback |
| Surprising wins | Rolled out immediately | Checked for errors and replicated when stakes are high |
| Losses and flat results | Ignored | Analysed and recorded as learnings |
| Where results live | Slides and inboxes | A searchable experimentation memory |
For marketers. End every test report with three lines: what we learned about customers, what we will do next, and where else this could apply. If a result looks too good to be true, check the data before celebrating.
Section 6 · Value 3
Collective, long-term effort outlasts individual heroism because knowledge must survive the people who created it
Experimentation programmes often depend on a few star players: a brilliant analyst, a charismatic product lead or a data-obsessed engineer. When they leave, the programme collapses.
Sustainable experimentation requires collective ownership. It means building shared processes, documenting learnings, creating a knowledge base and making sure experimentation does not depend on any single person. This is how companies move from sporadic testing to continuous learning.
Booking.com is the best-documented example of the collective model. Harvard Business School's Working Knowledge reports that 75% of its core employees take part in experimentation, with the ability to launch tests independently. Few companies need that scale, but every team can make experimentation a shared practice rather than one person's specialty.
| Dimension | Before: individual heroism | After: collective, long-term effort |
|---|---|---|
| Who runs tests | One or two experts | Trained people across product, marketing, UX and data |
| Knowledge | In the expert's head | Documented in a shared repository anyone can search |
| Rituals | Ad hoc updates when a test wins | Regular reviews, retrospectives and planning sessions |
| Failure | Hidden or blamed | Shared openly as a normal outcome |
| Time horizon | Until the sponsor or expert moves on | Multi-year commitment with a budget and an owner |
| Tools | Built for experts only | Templates and guardrails so non-experts can test safely |
For leaders. Treat experimentation as a capability, not a project. Give it a named owner, a multi-year budget and a place in regular business reviews. Ask one question each quarter: if our best tester left tomorrow, what would we lose? The answer shows where documentation and training are missing.
Section 7 · The 16 principles
The 16 guiding principles turn the three values into habits a team can check every quarter
Behind the three values are 16 guiding principles: actionable ideas that teams can apply immediately. Their wording is unchanged from the original manifesto. Below, we group them under the value each one supports and add what good looks like and the warning sign that the principle is missing. The numbers are the original order.
Principles that support Value 1: high-impact initiatives
| # | Principle | What good looks like | Warning sign |
|---|---|---|---|
| 1 | Start with the customer problem, not the test idea. | Every test traces back to a problem found in research or data | Backlog full of 'let's try a green button' |
| 2 | Define success before you start. Unclear goals lead to unclear results. | Hypothesis, primary metric and guardrails written before launch | Metric chosen after the results are in |
| 4 | Design tests that scale. Look for insights that apply beyond a single page or feature. | Each learning is tagged with where else it could apply | Every result is specific to one page |
| 12 | Align tests with strategy. Random tests rarely move the needle. | Roadmap maps tests to two or three company goals | Nobody can link a test to a business objective |
| 13 | Focus on reusable frameworks. Build once, apply everywhere. | Shared templates for hypotheses, briefs and reports | Every team reinvents its own process |
Principles that support Value 2: quality insights
| # | Principle | What good looks like | Warning sign |
|---|---|---|---|
| 3 | Prioritize learning over winning. Negative results teach as much as positive ones. | Losses are reported with the same care as wins | Only winning tests are presented to leadership |
| 5 | Avoid vanity metrics. Measure what matters to your business, not just what's easy to track. | Primary metrics tied to revenue, retention or customer value | Success measured in clicks or page views |
| 6 | Document everything. Today's learnings inform tomorrow's tests. | Every test, including flat ones, is in a searchable record | Teams re-run tests that were done a year ago |
| 10 | Invest in infrastructure. Good tools, clean data, and fast iteration cycles compound impact. | Reliable tracking, automated quality checks, short setup time | Tests are delayed by data issues or developer queues |
| 16 | Stay humble. Data informs decisions — it doesn't make them for you. | Results are weighed with context and judgement | A single p-value overrides everything else |
Principles that support Value 3: collective, long-term effort
| # | Principle | What good looks like | Warning sign |
|---|---|---|---|
| 7 | Build experimentation rituals. Regular reviews, retrospectives, and planning sessions create momentum. | A fixed calendar of test reviews and quarterly planning | Meetings only happen when a test wins |
| 8 | Share results widely. Transparency increases trust and adoption. | Results open to the whole company, with plain summaries | Results stay inside the testing team |
| 9 | Celebrate failure. If you're not failing, you're not testing bold enough ideas. | Bold ideas are tested, and useful losses are recognised | Win rate is suspiciously high; only safe tweaks are tested |
| 11 | Empower non-experts. Experimentation shouldn't require a PhD in statistics. | Training, templates and guardrails let product and marketing staff test | Every test waits for one analyst |
| 14 | Promote cross-functional collaboration. The best tests combine UX, data, product, and business perspectives. | Test briefs are reviewed by several disciplines | Tests designed by one function in isolation |
| 15 | Commit to the long term. Experimentation isn't a one-quarter initiative. | Multi-year budget, named owner, roadmap beyond this quarter | Programme restarts after every reorganisation |
The same 16 principles can also be read by the part of the programme they govern. Exhibit 3 groups them into four areas that a programme lead must manage: the plan (what to test and why), the process (how each test runs), the people (how the team behaves) and the platform (the tools that make testing cheap and shared).
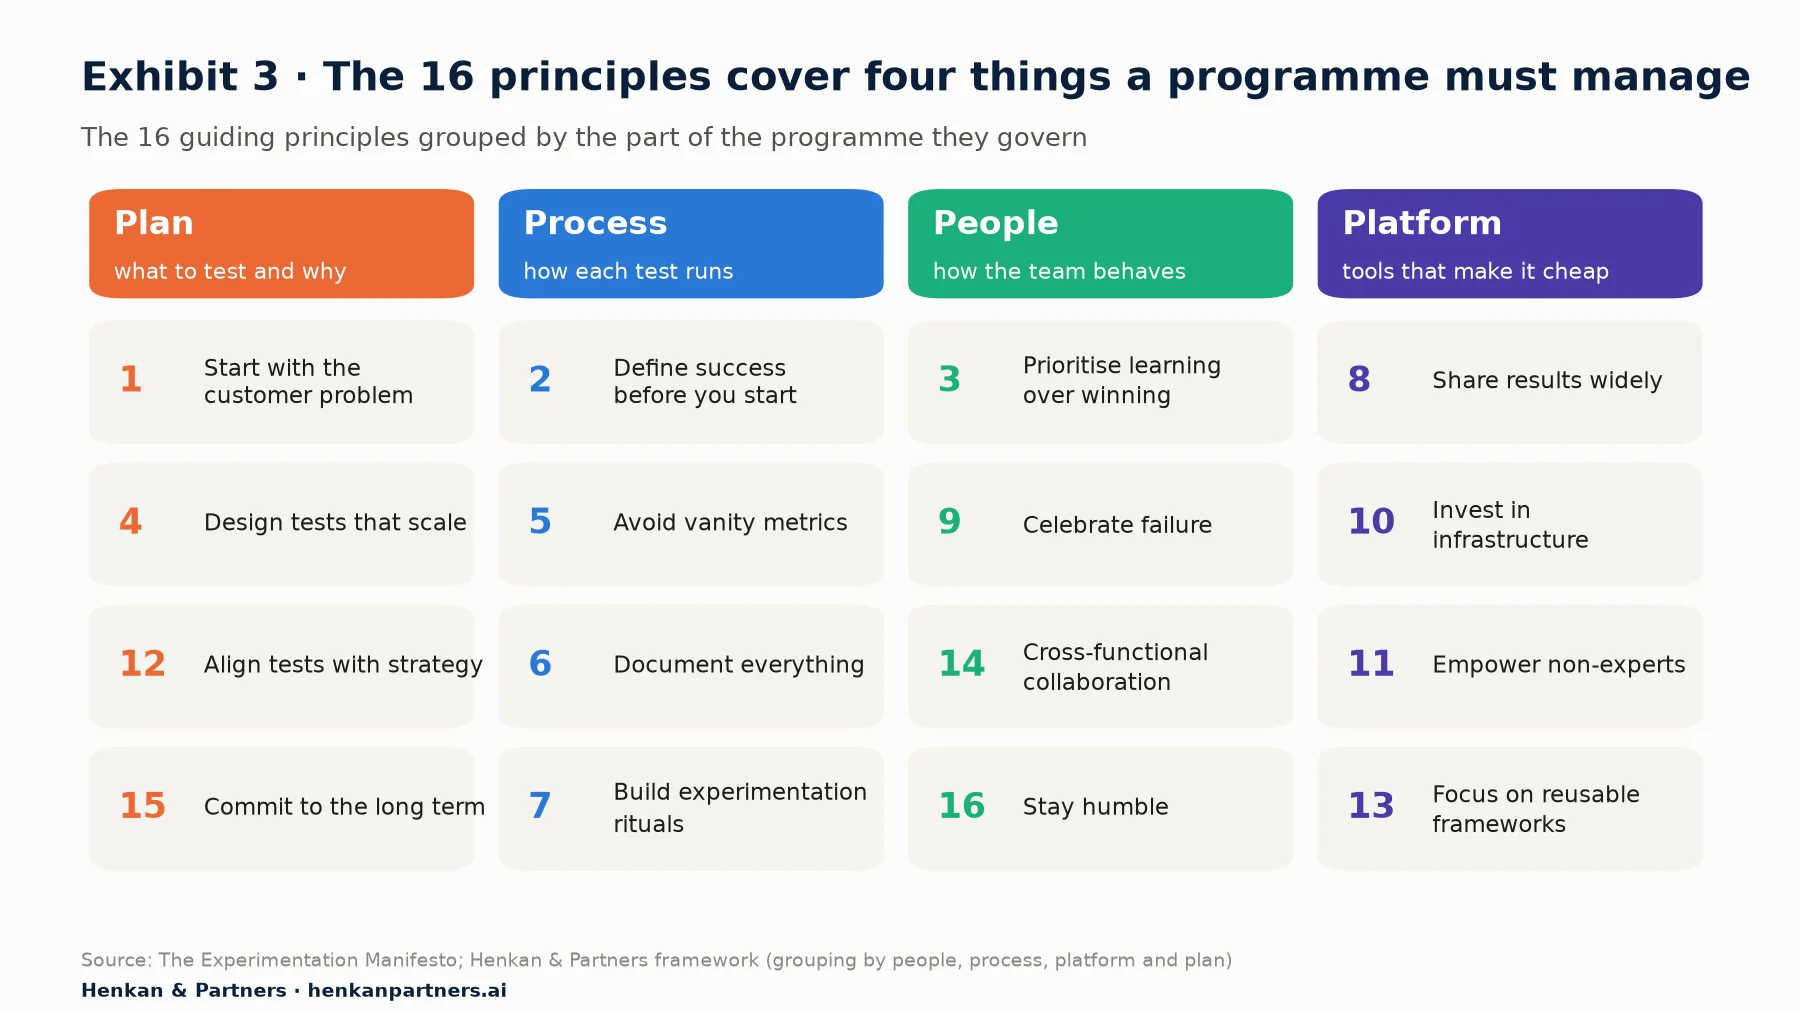
What this shows. The principles are balanced: four each for plan, process, people and platform. Programmes that stall usually invest in only one column, most often the platform. Buying a testing tool covers principle 10; the other fifteen depend on how the team plans, works and behaves.
Section 8 · Maturity self-assessment
Scoring the 16 principles places a programme on a five-level scale and shows the next step
A manifesto is useful only if a team can check itself against it. We use a simple self-assessment. Score each of the 16 principles 0 if it is absent, 1 if it is partly in place and 2 if it is consistently in place. The total, out of 32, maps to one of five maturity levels.
The model is a Henkan & Partners framework. It is informed by academic work such as the 'Experimentation Evolution Model' of Fabijan and colleagues (ICSE 2017), based on a case study at Microsoft, which describes technical, organisational and business evolution from ad hoc data analysis to continuous experimentation at scale. The score bands below are our own guide, not a published benchmark.
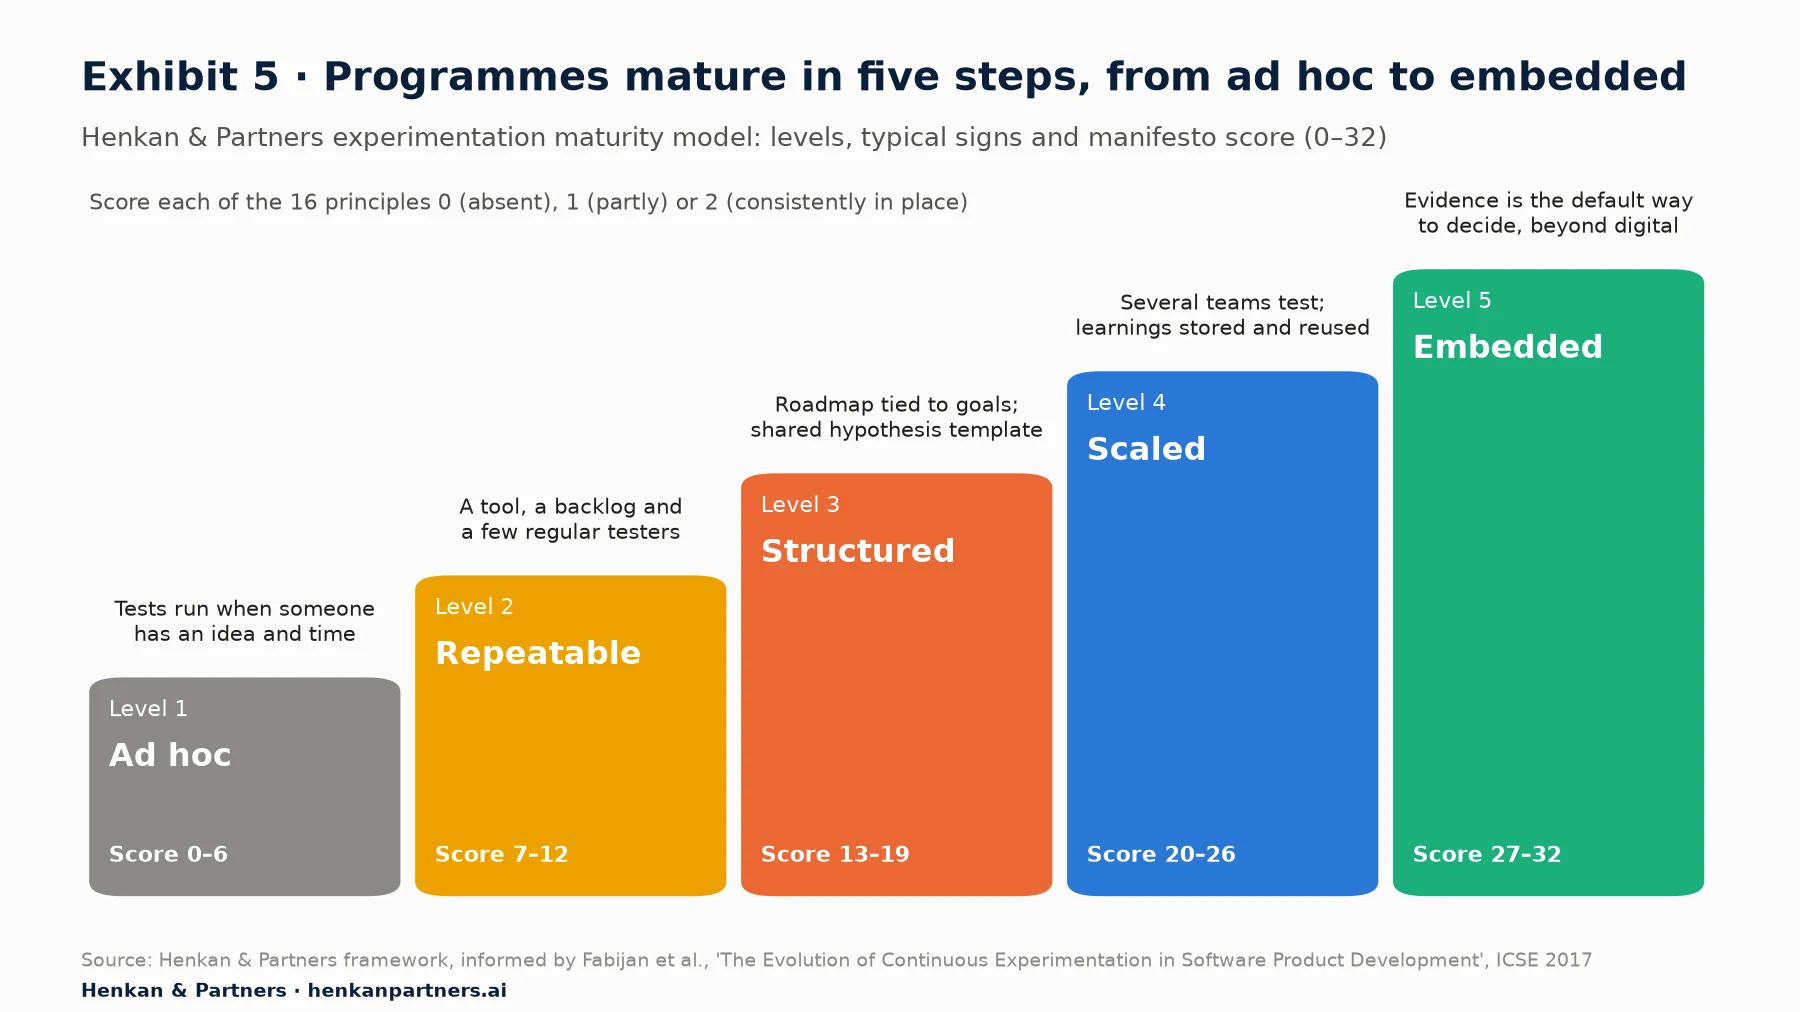
What this shows. Each level adds a capability rather than more tests. Moving from Repeatable to Structured is usually the largest step, because it requires a roadmap tied to goals and a shared way of writing hypotheses. Moving from Scaled to Embedded requires leaders to use evidence for decisions outside digital channels.
| Level | Score | What it looks like | Typical next step |
|---|---|---|---|
| 1. Ad hoc | 0–6 | Tests run when someone has an idea and time; results are rarely recorded | Agree one primary metric and a hypothesis template |
| 2. Repeatable | 7–12 | A testing tool, a backlog and a few regular testers; success counted in tests | Link the backlog to two or three business goals |
| 3. Structured | 13–19 | Roadmap tied to goals, regular reviews, results documented | Build a shared, searchable experimentation memory |
| 4. Scaled | 20–26 | Several teams test with shared rules; learnings are reused across pages and markets | Train non-experts and lower the cost of each test |
| 5. Embedded | 27–32 | Evidence is the default way to decide, including pricing, operations and HR | Protect the culture through leadership changes and reorganisations |
Score as a group, because disagreement between product, data and marketing is informative, and repeat the scoring each quarter. The aim is not a perfect score. It is a clear next step.
For marketers and small teams. A team of one or two people can reach Level 3. It needs a written roadmap, a hypothesis template, a shared document of results and a monthly review, not a large budget.
Section 9 · AI in 2026
AI makes tests cheaper to launch, which makes the manifesto's first value more important, not less
When the manifesto was first published in 2024, we said it would adapt to emerging technologies such as AI-driven testing. By September 2026, AI is part of everyday experimentation work. Testing platforms now offer agents that suggest test ideas, build variants without code, plan tests and summarise results.
Optimizely, one of the largest vendors, reports that teams using its agents across the full experimentation lifecycle run 78.7% more experiments and see win rates rise by 9.3%, and that its ideation agent leads to 18% more tests created. These are vendor-reported figures from its own customers and have not been independently audited, but the direction is clear: AI lowers the cost of producing a test.
More volume raises the stakes on focus and rigour
Cheaper tests are good news, since the A/B testing flywheel depends on them. But they also create the risk the manifesto was written to prevent. If only one idea in eight or ten works, generating more ideas faster also generates more losses, more flat results and, at the same significance threshold, more false wins. Testing many variants at once adds to the problem, because each extra comparison is another chance for a result to look significant by luck unless the analysis corrects for it.
That is why Exhibit 4 shows AI variant generation, on its own, moving a programme to the right rather than up. The first value becomes the filter that decides which AI-generated ideas deserve traffic. In 2026 the scarce resource is traffic, not ideas.
Experimentation memory becomes the asset AI works from
The third value also gains weight. AI assistants are only as good as the context they can read. A programme with a documented, searchable record of past hypotheses, results and learnings (principle 6, 'Document everything') gives an AI assistant something to reason from: which ideas were already tested, what customers responded to, and which learnings apply to a new page or market. Optimizely reports that 19.54% of follow-up tests on its platform are now driven by agent recommendations grounded in prior results. A programme without that record gives AI nothing to build on, so it will suggest the same tests again.
| Manifesto value | What AI changes | What the value asks for in 2026 |
|---|---|---|
| High-impact initiatives | Ideas and variants are cheap to generate | A roadmap and prioritisation rules that decide which ideas get traffic |
| Quality insights | More tests means more flat results and more chances of false wins | Pre-registered metrics, correction for multiple variants, replication of surprising wins, and human review of AI summaries |
| Collective effort | Knowledge can be stored and queried by machines | A shared experimentation memory that people and AI assistants both use |
For marketers. Use AI to widen the range of ideas and to speed up building variants, then apply the same filter as before: which customer problem, which goal, which metric. Ask the AI to check new ideas against your record of past tests before you build them.
For leaders. Before buying more AI capacity, check that the programme has a roadmap and a shared record of learnings. Without them, AI will increase activity, not value. Invest in the experimentation memory first; it is the asset that makes every AI tool more useful.
Section 10 · Implications
Leaders should manage experimentation as a capability, starting with five decisions
The manifesto is a starting point, not a final document, and it will keep growing with feedback from practitioners. Based on the evidence above, we recommend five decisions for any team, from a two-person marketing team to a large product organisation.
1. Replace test count with learning and decision metrics
Stop reporting the number of tests as the headline. Report the initiatives completed, the decisions they changed, the learnings reused elsewhere and the business value of implemented winners. With published win rates between 8% and 33%, a programme should expect most tests to lose and be judged on what it learns.
2. Tie the roadmap to two or three company goals
Build a quarterly roadmap of initiatives, each linked to a strategic goal and a customer problem. This is the practical form of the first value and principles 1, 4 and 12. It also gives AI-generated ideas a clear filter.
3. Set quality rules before scaling volume
Agree a hypothesis template, a primary metric and guardrails for every test, and a rule for replicating surprising wins. Make sure analysis accounts for tests with many variants. These rules protect the programme from the false positive risk that grows as volume grows.
4. Build a shared experimentation memory
Record every test, including flat and losing ones, in one searchable place with the hypothesis, result, explanation and next step. Make it open to the whole company and readable by AI assistants. This is the single investment that most reduces dependence on individual heroes.
5. Score the programme every quarter and fix the weakest column
Use the 16-principle self-assessment each quarter. Find the lowest-scoring area (plan, process, people or platform) and make it the next quarter's improvement goal. Share the score with sponsors so that progress is visible.
Our reading. The companies that get the most from experimentation are not the ones that run the most tests. They are the ones that decide well what to test, learn from every result and keep that learning when people move on. That was true when the manifesto was written in 2024, and AI makes it more true in 2026. If you want help assessing your programme or shaping the manifesto for your team, we would like to hear from you.
FAQ
Frequently asked questions about experimentation culture and the Experimentation Manifesto
Frequently asked questions
What is the Experimentation Manifesto?
The Experimentation Manifesto is a short set of values and principles for running experimentation programmes, modelled on the 2001 Agile Manifesto. It was first published by Henkan & Partners in 2024, written with experimentation leaders from a major European bank, a global insurer and several SaaS companies. It rests on two convictions (experimentation is company culture and a strategic process), three values and 16 guiding principles.
What are the three values of the Experimentation Manifesto?
High-impact initiatives over numerous disconnected efforts; quality insights over a high volume of data; and collective, long-term effort over individual heroism. As in the Agile Manifesto, the items on the right still have value, but the items on the left matter more.
What is an experimentation culture?
An experimentation culture is a way of working in which ideas are treated as assumptions to test, decisions are based on evidence rather than opinion, and results, including failures, are shared and reused. Stefan Thomke of Harvard Business School lists its conditions as nurtured curiosity, data over opinions, the ability for any employee to launch tests, ethical experiments and a more democratic style of leadership.
What percentage of A/B tests succeed?
Published figures range from about 8% to 33%. Kohavi and Thomke report that about 10% to 20% of experiments at Google and Bing generate positive results, and about one-third at Microsoft overall. Kohavi and colleagues cite about 10% for Booking.com, Google Ads and Netflix and 8% for Airbnb search. Optimizely's analysis of 127,000 customer experiments found a 12% win rate on the primary metric.
How do you build a successful experimentation program?
Start with customer problems and company goals, not test ideas. Write a hypothesis and choose one primary metric before each test. Group tests into initiatives, record every result in a shared place, hold regular reviews, train non-experts, and give the programme a named owner and a multi-year commitment.
How is AI changing experimentation programmes in 2026?
AI tools now suggest test ideas, build variants without code and summarise results, which raises the number of tests teams can run. Because most ideas still fail, higher volume increases the need for strategic prioritisation, statistical rigour and a shared record of past learnings that both people and AI assistants can use.
Is an experimentation programme only for large companies?
No. The manifesto is about how decisions are made, not about budget. A team of one or two people can apply the three values with a written roadmap, a hypothesis template, a shared log of results and a monthly review. Larger organisations need more rituals, governance and platform investment.
Key terms
- Experiment (A/B test)
- A test in which visitors are randomly split between the current version (control) and one or more changed versions (variants), and a metric is compared. It matters because random assignment is the only reliable way to show that a change caused a result.
- Hypothesis
- A written, testable statement of what you will change, for whom, and what you expect to happen and why. It matters because a test without a hypothesis can show that something changed but not what you learned.
- Win rate
- The share of experiments in which a variant significantly improves the primary metric. It matters because published win rates of 8% to 33% show that most ideas fail, so a programme must be designed to learn from losses.
- Primary metric
- The single metric a test is designed to move, agreed before launch (for example, revenue per visitor). Fixing it in advance prevents teams from picking whichever metric happened to improve.
- Guardrail metric
- A metric that must not get worse, such as page speed, returns or unsubscribes. It matters because a variant can raise one number while quietly harming the customer experience.
- Vanity metric
- A number that is easy to track and looks good but does not reflect business value, such as clicks on a banner. Optimising for it can produce 'wins' that never reach revenue or loyalty.
- Statistical significance (p-value)
- A measure of how surprising a result would be if the change had no real effect. A p-value tells you whether something probably changed; it does not tell you why, or whether it matters.
- False positive risk
- The probability that a result declared significant is not real. It rises when true wins are rare; Kohavi and colleagues estimate 22% when only 10% of ideas work, so single wins should be confirmed before large rollouts.
- Experimentation programme
- The organised system around individual tests: roadmap, people, rituals, tools, governance and a shared record of results. It matters because the programme, not any single test, is what compounds value.
- CRO (conversion rate optimisation)
- The practice of improving the share of visitors who complete a goal, such as a purchase or sign-up, often through research and experiments. A CRO programme is one common form of experimentation programme.
- Test-and-learn culture
- A way of working in which ideas are treated as assumptions to check, and results (including losses) are shared and reused. It matters because tools alone do not change how decisions are made.
- Experimentation memory
- A searchable record of past hypotheses, results and learnings, often called a knowledge base or repository. It stops teams from repeating old tests and lets new staff, and AI assistants, build on what is known.
- Maturity model
- A scale that describes stages of capability, from ad hoc to embedded. It matters because it tells a team where it stands and which next step will add the most value.
Sources
Win rates are as published and not directly comparable, since companies define success differently. False positive risk figures are from Kohavi, Deng and Vermeer (2022), Table 2, which assumes a 0.05 significance level counting only positive results and 80% power. Optimizely figures are vendor-reported, based on its own customers' experiments, and were retrieved in September 2026. The maturity model, the grouping of principles, the before-and-after tables and Exhibit 4 are Henkan & Partners frameworks and opinion, not measured data. Web pages were retrieved on 26 September 2026.
- Kohavi, R. & Thomke, S., 'The Surprising Power of Online Experiments', Harvard Business Review, September–October 2017
- Kohavi, R., Deng, A. & Vermeer, L., 'A/B Testing Intuition Busters: Common Misunderstandings in Online Controlled Experiments', KDD 2022 · ACM Digital Library record
- Thomke, S., 'Building a Culture of Experimentation', Harvard Business Review, March–April 2020
- HBR IdeaCast, 'At Booking.com, Innovation Means Constant Failure', with Stefan Thomke, September 2019
- Harvard Business School Working Knowledge, 'Creating the Experimentation Organization', December 2019
- Manifesto for Agile Software Development, 2001 · Principles behind the Agile Manifesto · History: The Agile Manifesto, Jim Highsmith
- Optimizely, 'Top 10 takeaways from running 127,000 experiments', 2026
- Optimizely, 'AI experimentation: From ideation to results faster', updated September 2026
- Fabijan, A., Dmitriev, P., Olsson, H. H. & Bosch, J., 'The Evolution of Continuous Experimentation in Software Product Development', ICSE 2017
- Fabijan, A., Arai, B., Dmitriev, P. & Vermeer, L., 'It takes a Flywheel to Fly: Kickstarting and Keeping the A/B testing Momentum', Microsoft Research, 2020
- Kohavi, R., Tang, D. & Xu, Y., 'Trustworthy Online Controlled Experiments: A Practical Guide to A/B Testing', Cambridge University Press, 2020