Focus
How to Find Personalisation Segments in GA4 (and Know Which Ones Are Worth It)
Alexandre Suon · 2026-09-28
GA4 personalisation segments are easy to create and hard to choose. This deep dive shows where segments come from in Google Analytics 4, from explorations and audiences to predictive audiences and the BigQuery export, and gives you a simple method to decide which ones are worth a personalised experience: traffic times gap times value, checked against noise and tested against a holdout.
Executive summary
- GA4 gives you two different objects: segments to analyse and audiences to act. Segments filter past data and are fully retroactive; audiences collect users from the day you create them (with up to 30 days of backfill) and are what you export to Google Ads and testing tools.
- Explorations find candidate segments; they do not tell you which ones matter. Free-form comparisons (up to four segments at once), segment overlap (up to three user segments) and path exploration show where behaviour differs. Sampling above 10 million events and data thresholds can distort small segments.
- Predictive audiences need scale most shops do not have. Google requires at least 1,000 returning users who purchased, and 1,000 who did not, within one seven-day period in the last 28 days. That is about 143 returning buyers a day.
- Rank segments by revenue at stake: traffic × conversion gap × order value, discounted by how many users you can actually reach. In our illustrative example, reachability moves lapsed high-value buyers from second to fourth place and the delivery-zone segment stays on top.
- Check every gap with a confidence interval before you build anything. Two of the seven gaps in our example could be noise. A 0.5-point gap on 3,200 users has an interval from minus 0.24 to plus 1.24 points.
- Personalised experiences need a holdout, and holdouts need time. Detecting a 15% lift for a segment of 14,500 users a month takes about 2.4 months with a 50/50 split and about 6.3 months with a 10% holdout. Plan the test before you build the experience.
Section 1 · Definitions
A personalisation segment is worth something only if you can find it, reach it and serve it differently
Most teams do not lack segments. GA4 will happily split traffic by device, source, country, new versus returning and dozens of other dimensions. What teams lack is a way to decide which of those splits deserves its own experience, and a way to prove afterwards that the experience worked. This article sits between our essential guide to personalisation, which explains why and when to personalise, and Segments, Bandits or A/B Tests?, which covers how to test personalised experiences. Here we focus on the step in the middle: finding segments in GA4 and choosing the ones worth the effort.
A personalisation segment is a group of visitors who share a measurable attribute or behaviour, such as arriving from paid social on a phone or having abandoned a basket, and who are different enough from other visitors, large enough and identifiable enough at the moment of the visit to justify showing them a different experience.
Three words in that definition do the work. Different: the group must behave differently from a sensible comparison group, and the difference must be real, not noise. Large enough: the difference multiplied by the number of people and their order value must be worth the cost of building and maintaining a variant. Identifiable: the tool that changes the page must be able to recognise the visitor while they are on the site, which is not the same as GA4 recognising them in a report the next day.
GA4 uses two words for groups of users, and they are not interchangeable. Google describes a segment as "a set of conditions used to filter the data in a report" and notes that segments are "fully retroactive". An audience, by contrast, has membership: users enter and leave it over time, and it is the object that GA4 can share with advertising and testing tools.
| Segment | Audience | Predictive audience | |
|---|---|---|---|
| What it is | A filter applied to data in an exploration | A list of users who meet conditions, with membership over time | An audience with at least one condition on a predictive metric |
| Time | Fully retroactive over the date range | Collects users from creation; up to 30 days of backfill if data is available | Updated as the model rescores users |
| Where you use it | Explorations (analysis only) | Reports, Google Ads, DV360, SA360, testing and personalisation tools | Same as audiences |
| Main limit | 4 applied at once per technique; 10 per exploration | 100 per standard property (400 in 360) | Property must meet Google's eligibility thresholds |
| Use it to | Discover where behaviour differs | Act on a segment you have already validated | Target likely buyers or likely churners at scale |
The practical rule follows from the table: explore with segments, then rebuild the ones that survive your checks as audiences. If you are unsure how GA4 counts users and sessions in the first place, our guide Beyond the Numbers: How GA4 Actually Works is a useful prerequisite.
Section 2 · Explorations
Explorations are where you find candidate segments, not where you decide which ones matter
GA4's Explore section offers several techniques. Three of them do most of the work of finding personalisation segments: free-form exploration with segment comparisons, segment overlap and path exploration. Exhibit 1 shows how they fit with the objects you define and the places you can act.
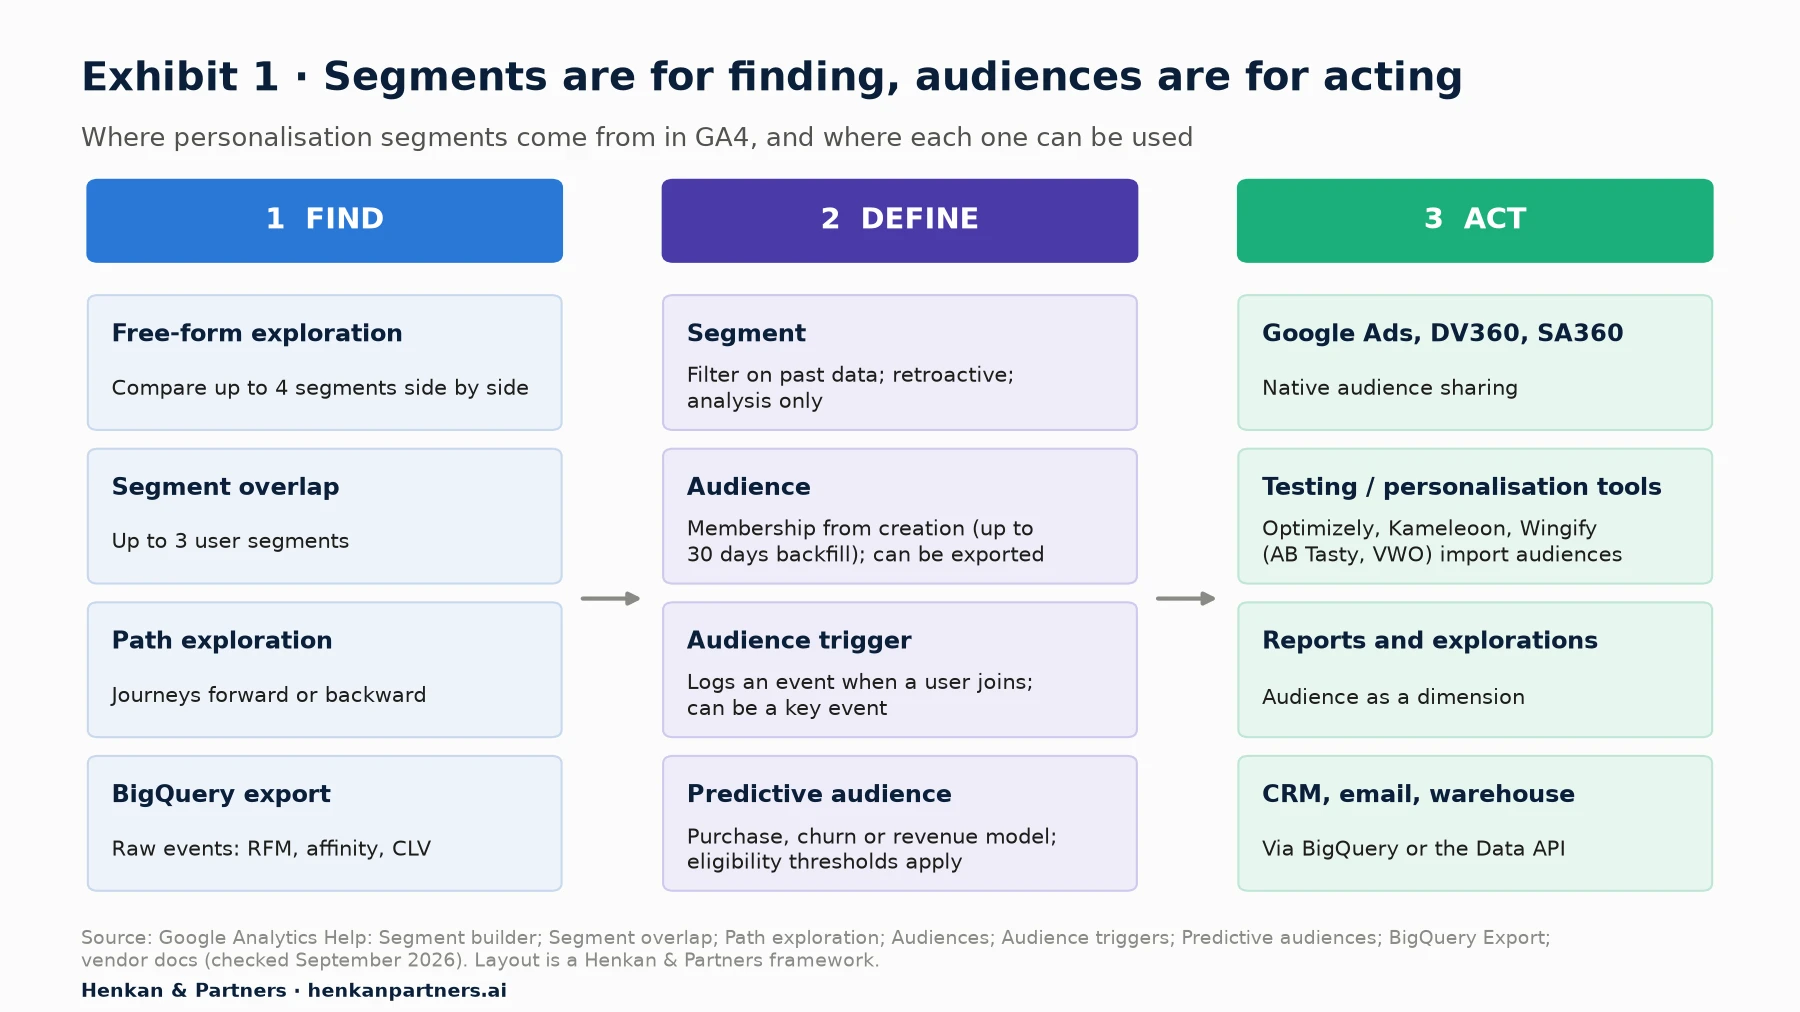
What this shows. The left column is analysis and costs nothing to try. The middle column is where a finding becomes an object GA4 maintains. The right column is where value is created, and each destination has its own delays, identifiers and consent rules. Most wasted personalisation effort comes from jumping straight from the left column to building variants without passing through the checks in the middle.
Free-form exploration with segment comparisons
A free-form exploration is a pivot table. Add segments to it and GA4 shows each metric side by side for each segment. Google allows you to create up to 10 segments per exploration and to apply up to four to one technique at the same time. Segments can be user, session or event scoped: users who purchased before, sessions from a campaign, or purchase events in a given country.
A good first exploration for personalisation puts device category and new versus returning in rows, your main acquisition channels in columns, and sessions, conversion rate (key event rate), purchase revenue and average order value as values. Then add two to four segments that represent hypotheses, for example "viewed three or more products in one category" or "added to cart but did not purchase". You are looking for combinations where conversion or value is clearly different from the rest of the site.
Segment overlap
Segment overlap compares "up to 3 user segments" and shows how they intersect, both exclusively and inclusively. It answers a question that matters before any personalisation: are these really different people? If 70% of your "category-affine" users are also cart abandoners, two campaigns aimed at them will collide. Google lets you right-click an intersection to create a new segment from it, which is a quick way to build a precise combination such as "returning mobile users who abandoned a cart".
Path exploration
Path exploration draws user journeys as a tree, forward from a starting point or backward from an ending point, using event names, page titles, page paths or screen names as nodes. By default it shows the top five nodes per step. For personalisation, backward paths are the most useful: pick purchase as the end point and compare the paths of two segments. If new mobile visitors reach purchase mostly through search and returning ones through the basket, you have a hint about what each group needs. For quantified step-by-step drop-off, use a funnel instead; our funnel and cohort analysis deep dive shows how.
Two things that distort small segments: sampling and thresholds
Explorations are sampled when a query exceeds the quota: Google gives "10 million events for standard Google Analytics properties and up to 1 billion events for Google Analytics 360 properties". A large shop looking at a year of data will hit sampling, and small segments suffer most. Shorten the date range or move to BigQuery.
Data thresholds are different. Google applies them "to prevent anyone viewing a report or exploration from inferring the identity or sensitive information of individual users", mainly when a report includes demographic data, search queries with too few users, or low user or event counts over a narrow date range. They are system defined and cannot be adjusted. If rows disappear from a segment comparison, check the data quality indicator before you conclude the segment is empty.
For analysts. Save every candidate segment with a clear name and its hypothesis in the description. A standard property can hold 50 saved segments (200 in 360), so archive failed ideas. Record the date range, the comparison group and whether the exploration was sampled next to every screenshot you share.
Section 3 · Audiences
Audiences turn a segment into something you can act on, but only from the day you create them
A segment you found in an exploration has no life outside that exploration. To use it anywhere else you rebuild it as an audience. Audiences are built from dimensions, metrics and events, can include sequences ("directly followed by", "indirectly followed by", or within a timeframe) and are re-evaluated as new data arrives.
Three timing rules catch teams out. First, an audience is not calculated retroactively: Google says Analytics will "backfill audiences with up to 30 days of data, if that data is available", and then collects users going forward. Second, "it can take 24-48 hours for the audience to accumulate new users". Third, membership duration is capped at 540 days. Create audiences for your main hypotheses early, even before you have a campaign for them, so they have history when you need them.
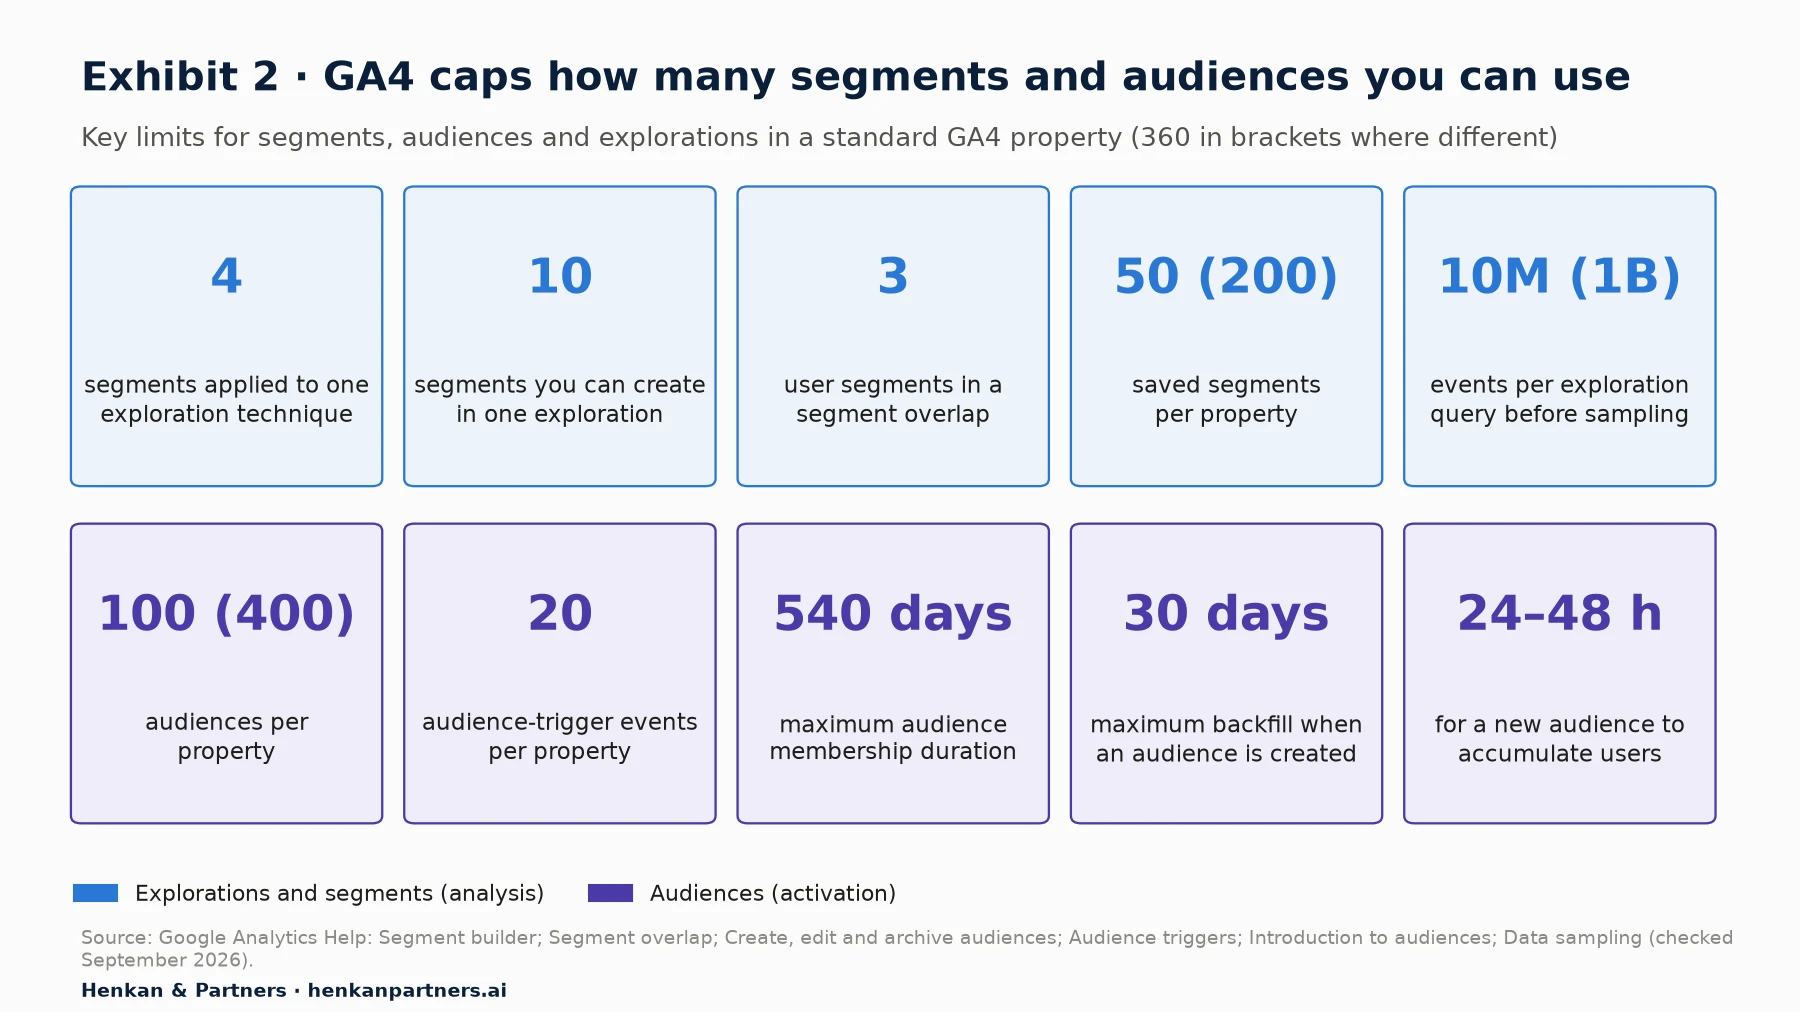
What this shows. The limits are generous for analysis and tighter for activation. One hundred audiences sounds like a lot until marketing, CRM and the testing team all create their own. Treat audiences as a shared, governed resource with owners and naming rules, the same way you treat custom dimensions.
Audience triggers
An audience trigger logs an event automatically when a user joins an audience. The event can be marked as a key event, and you can choose to log it again, up to once a day, when membership refreshes. A property can have up to 20 audience-trigger events.
Triggers are useful for personalisation in two ways. They let you count how many users enter a segment each day, which is the traffic term in the opportunity formula below. And because the trigger is an ordinary event, you can use it as a funnel step or a comparison dimension: "of users who became cart abandoners this week, how many came back and bought?"
For e-commerce managers. Ask for one audience per validated segment, named the same way everywhere (for example pz_cart_abandoner_mobile), and one audience trigger for the two or three segments you personalise for. That gives you daily entry counts and a clean way to report the segment's conversion over time.
Section 4 · Predictive audiences
Predictive audiences are powerful, but most shops will not meet Google's thresholds
GA4 can score users with three machine-learning metrics. Google's definitions are precise, and they matter because each has its own time window:
- Purchase probability: "The probability that a user who was active in the last 28 days will log a specific key event within the next 7 days."
- Churn probability: "The probability that a user who was active on your app or site within the last 7 days will not be active within the next 7 days."
- Predicted revenue: "The revenue expected from all purchase key events within the next 28 days from a user who was active in the last 28 days."
A predictive audience is "an audience with at least one condition based on a predictive metric". Google offers five templates: likely 7-day purchasers, likely first-time 7-day purchasers, likely 7-day churning purchasers, likely 7-day churning users and predicted 28-day top spenders.
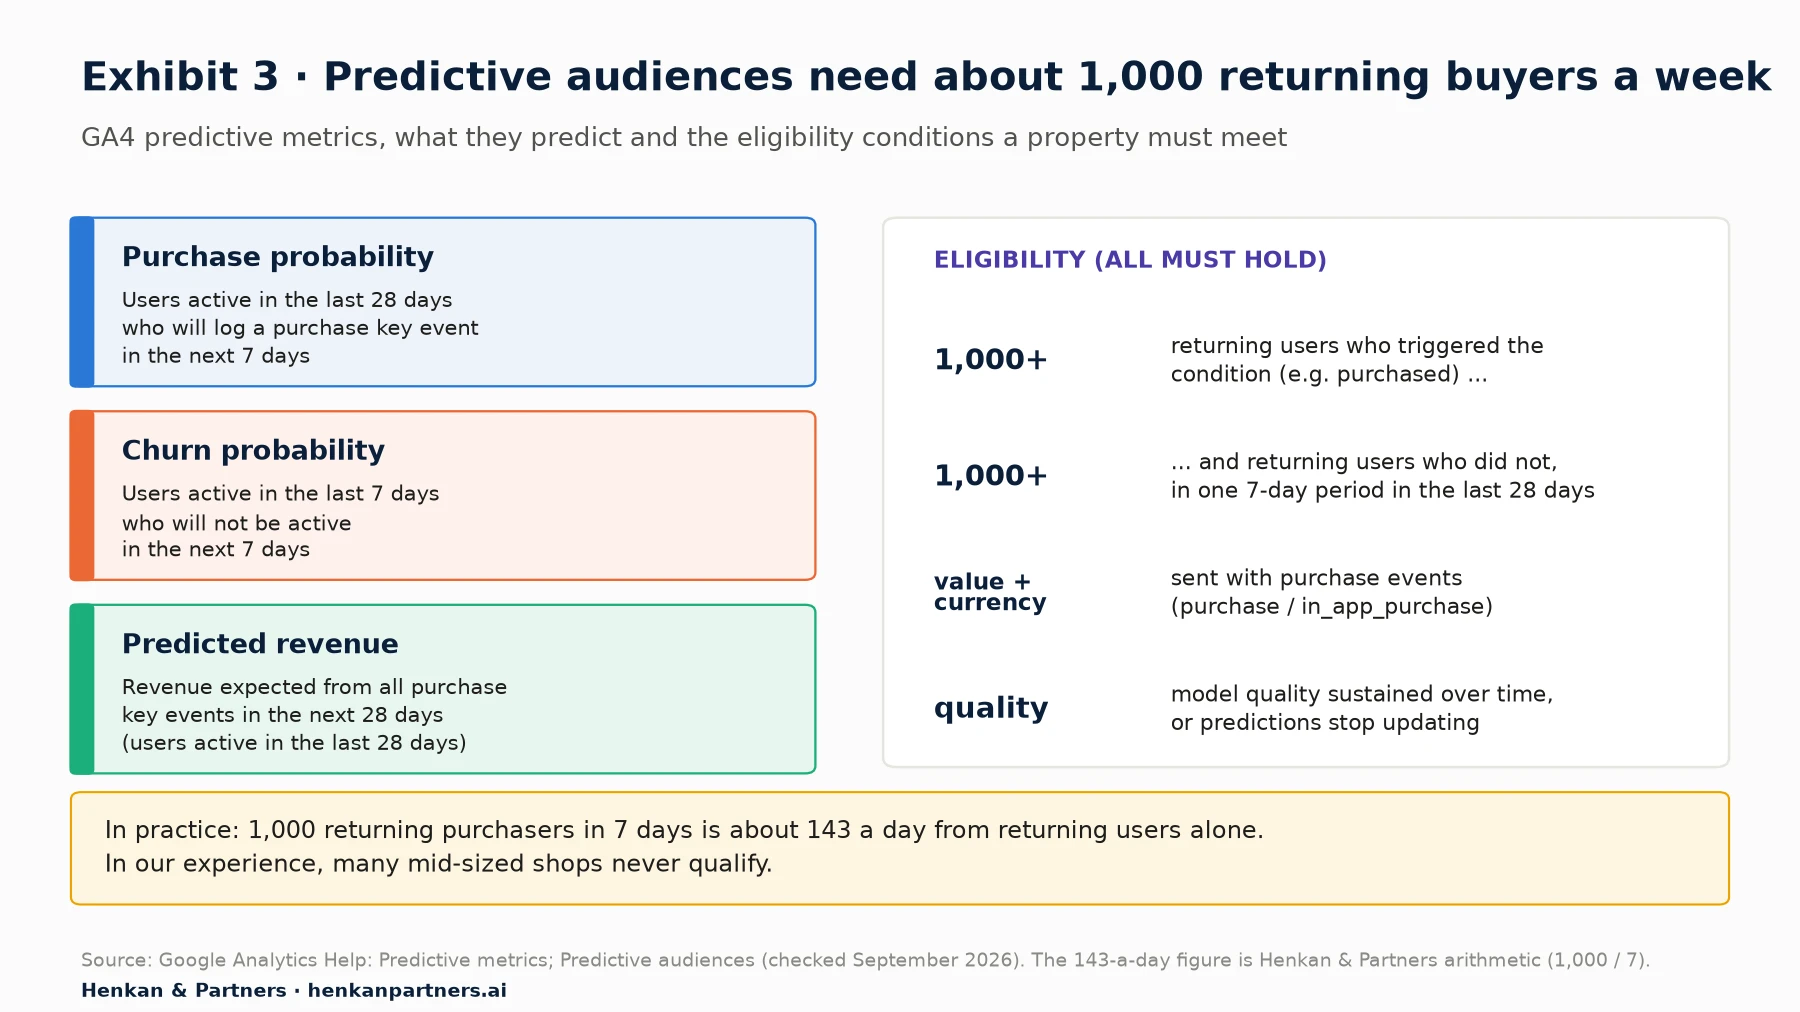
What this shows. The threshold is not about total traffic but about returning users who purchase within one week. A shop with 400,000 monthly visitors but a low repeat rate may still fall short. If the model's quality drops below Google's minimum, predictions stop updating and may disappear, so a predictive audience is not something to build a permanent experience on without a fallback.
The eligibility rules are strict: in a seven-day period within the last 28 days, at least 1,000 returning users must have triggered the relevant condition and at least 1,000 must not have. The property must send purchase or in_app_purchase events, and the purchase event must carry value and currency. Only purchase, ecommerce_purchase and in_app_purchase are supported for purchase and revenue predictions.
Our view. If your property qualifies, test predictive audiences for two uses: excluding likely buyers from discount campaigns, and giving likely churning purchasers a service message rather than a promotion. If it does not qualify, do not wait for it. A simple RFM segment built in BigQuery (Section 8) captures much of the same signal and you control the definition.
Section 5 · E-commerce segments
Seven segments matter in most online shops, and several need a custom dimension
Not every split deserves a personalised experience. In our experience, seven segments come up again and again in e-commerce because they combine a real behavioural difference with something you can change on the page. Some are available in GA4 out of the box; others need data you have to send yourself.
| Segment | In GA4 by default? | What you usually need to add | Typical personalisation |
|---|---|---|---|
| New vs returning | Yes (new / established users) | A customer status from your own system (prospect, first-time buyer, repeat buyer), because GA4 only knows the browser | Reassurance and delivery information for new visitors; recently viewed and reorder for returning ones |
| Source and campaign | Yes (session source, medium, campaign) | Consistent UTM tagging and a campaign naming convention | Landing page that continues the ad's promise; offer consistency |
| Device | Yes (device category) | Nothing | Shorter forms, sticky add to bag, express wallets on mobile |
| Category affinity | Partly (item category on e-commerce events) | A category affinity rule or a user property such as top_category | Category-led homepage, recommendations, navigation shortcuts |
| Cart abandoners | Yes, via an audience (add_to_cart without purchase) | Reliable add_to_cart and purchase events; a basket value band | Basket reminder, delivery threshold message, saved basket |
| High-value repeat buyers | No | A lifetime value or order-count band from your CRM, sent as a user property on login; or RFM from BigQuery | Early access, service messages, no discounts |
| Geo and delivery zone | Country and city only | A delivery_zone or shipping_cost_band parameter that reflects your own logistics | Delivery promise, free-delivery threshold, local payment methods |
Our guide Which Custom Dimensions to Collect in Your E-commerce Analytics covers the implementation. The short version: GA4 knows the browser, the page and the source. It does not know whether the visitor is a loyal customer, whether they live in a zone where delivery is free, or what they usually buy. Personalisation segments built on those attributes need a custom dimension or user property, and user-scoped slots in a standard property are limited, so choose them with care.
How big are the gaps in practice?
Benchmarks give a sense of scale, not a target. Contentsquare's 2026 Digital Experience Benchmark, based on 99 billion web and app sessions across more than 6,000 sites (vendor data), reports large conversion differences between standard segments. Returning visitors converted at 2.9% and new visitors at 1.7%. Desktop converted at 3.4%, which Contentsquare says is 74% higher than mobile. Paid search converted at 2.8%, AI-referred traffic at 1.3% and organic social at 0.7%.
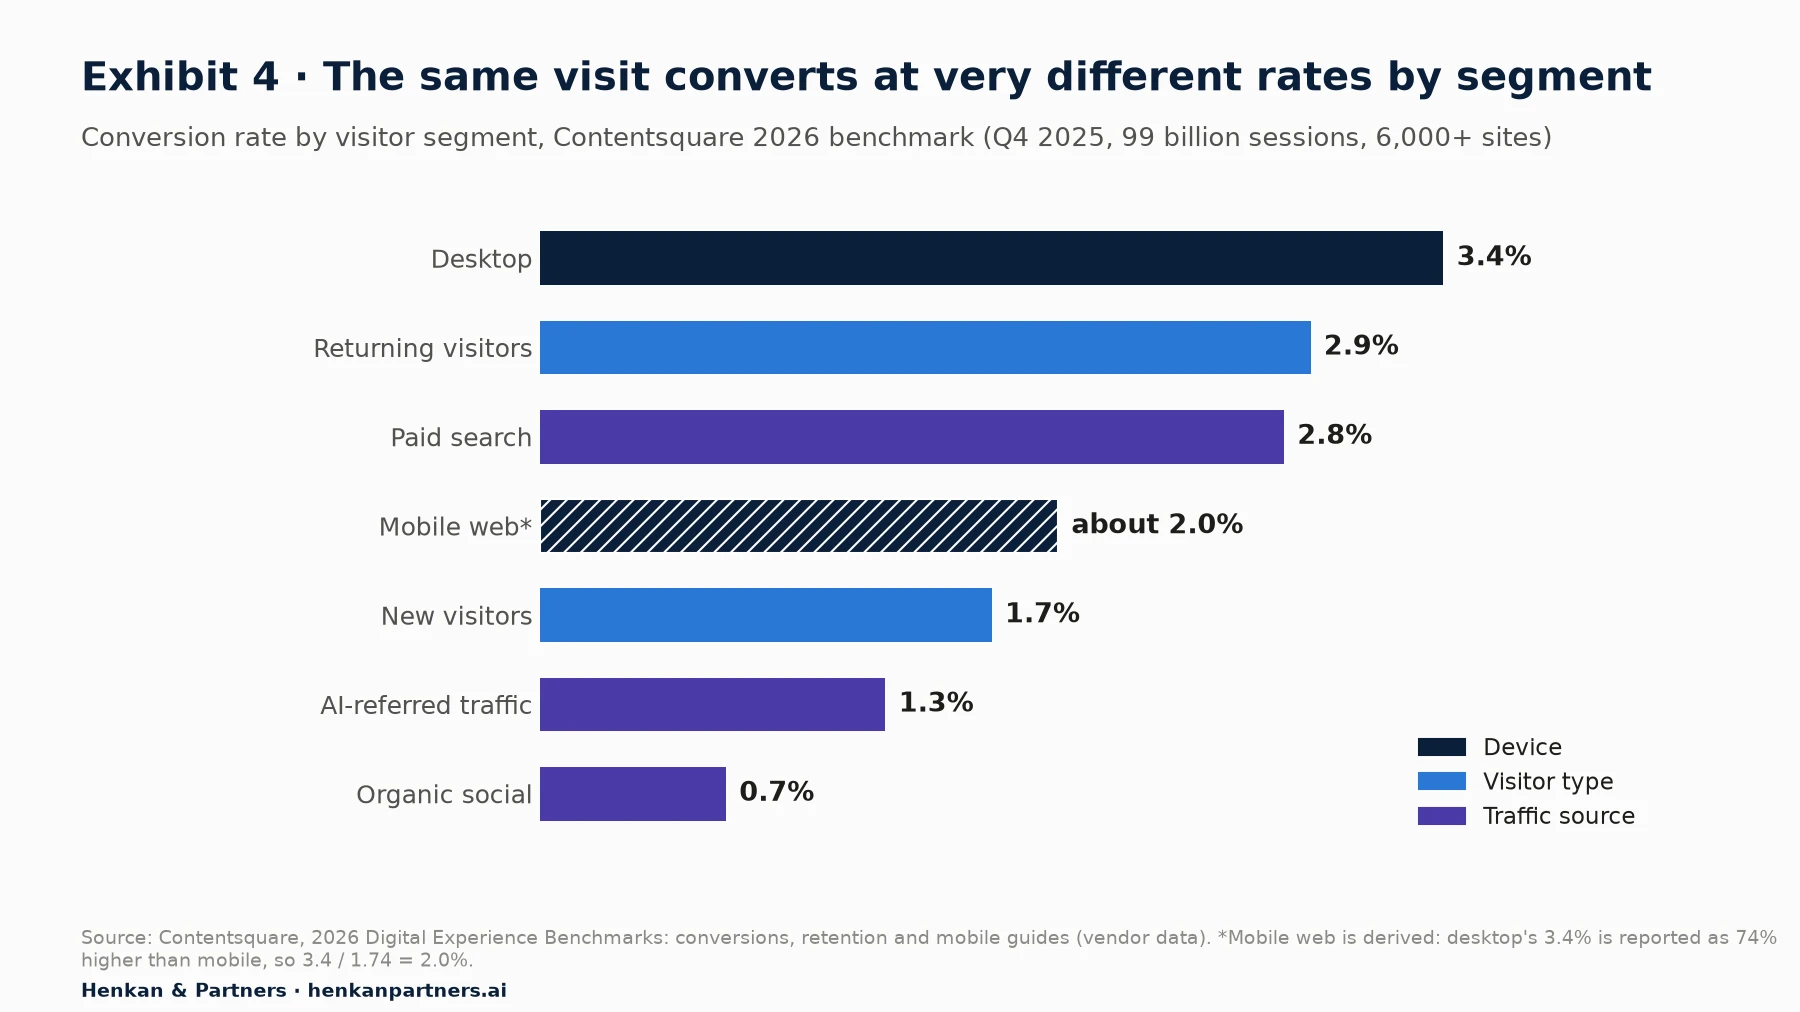
What this shows. A gap between segments is normal and does not by itself justify personalisation. Desktop visitors convert better partly because of who uses desktop and when, not only because of the experience. The question for personalisation is narrower: which part of the gap could a different experience close? That is why the method below compares each segment with a sensible reference group, not with the site average.
The reasons shoppers leave give a second clue about which segments to build. Baymard Institute documents an average cart abandonment rate of 70.22% across 50 studies. Among US shoppers who abandoned a checkout, excluding those who were just browsing, the top reason was extra costs (40%), followed by slow delivery (20%), not trusting the site with card details (19%) and being asked to create an account (18%).
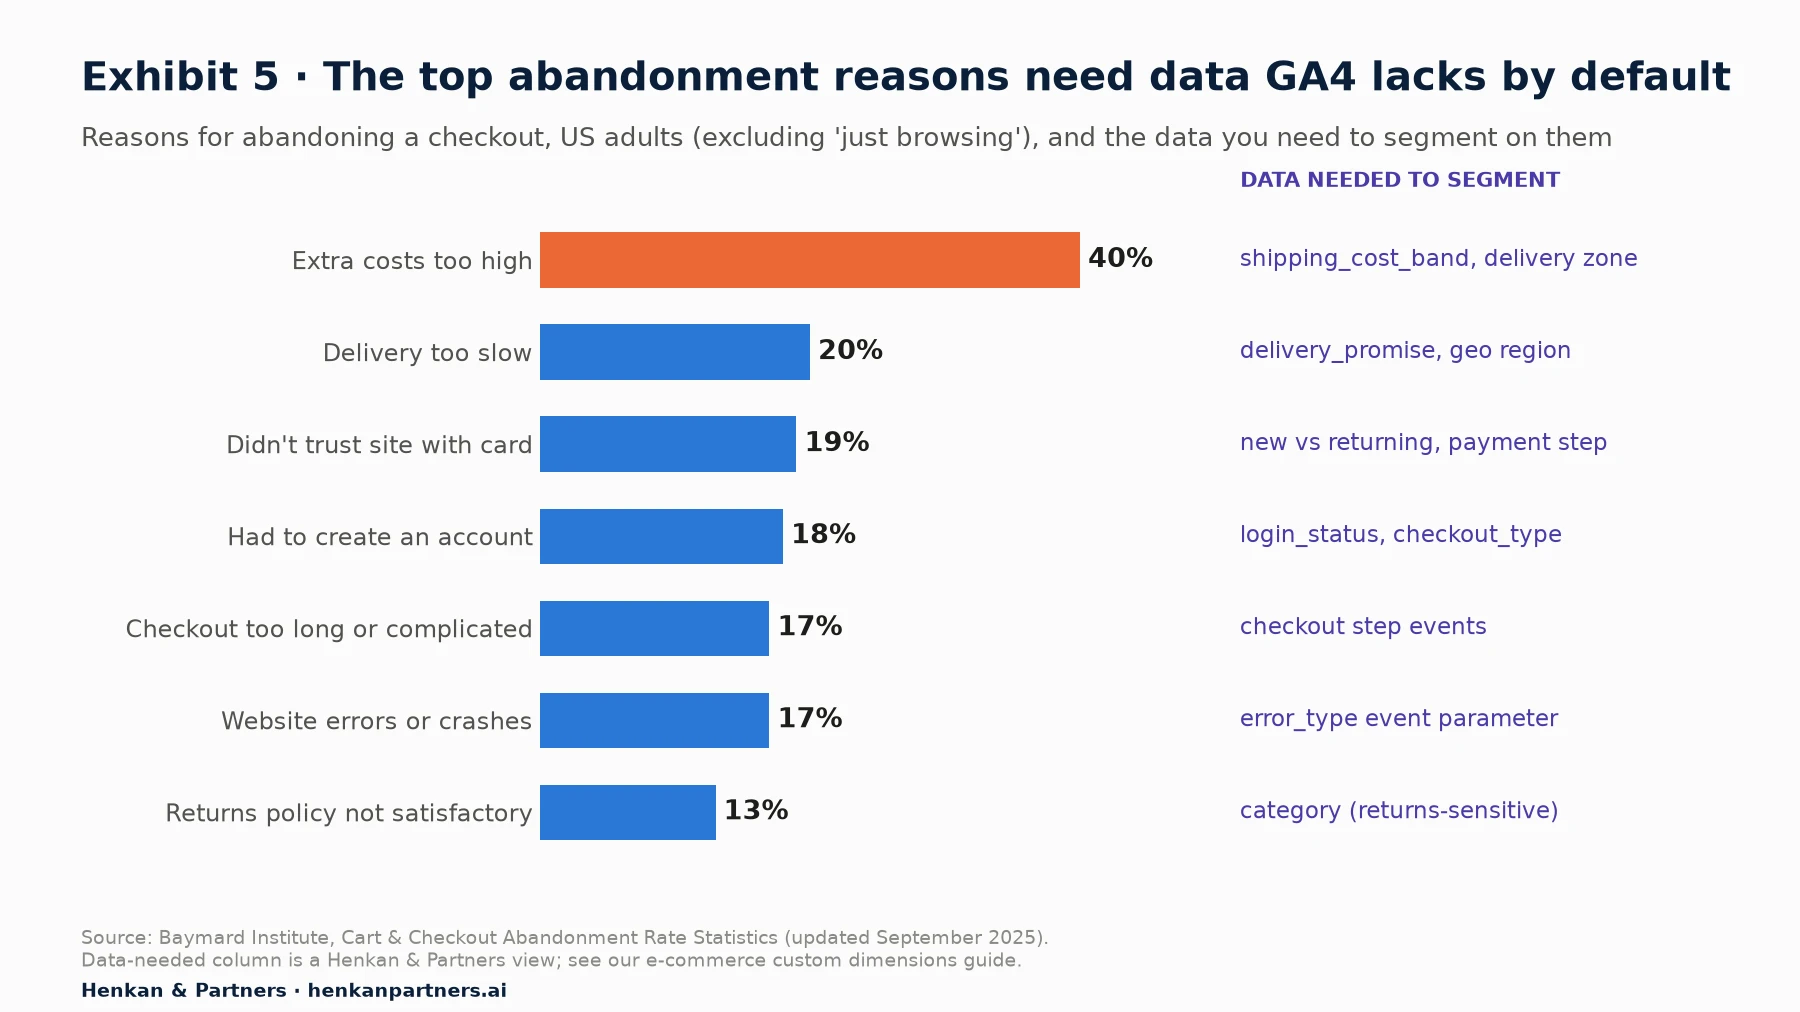
What this shows. The largest reason, extra costs, is a segment problem in disguise: the cost a shopper sees depends on where they live and what is in their basket. Without a delivery zone or shipping cost band on checkout events, GA4 cannot show you whether visitors outside the free-delivery zone convert at a fraction of the rate of those inside it, as they do in the illustrative example below. In our experience, this is often one of the most valuable segments a shop has.
Section 6 · Choosing segments
Rank segments by opportunity: traffic × gap × value, discounted by reachability
Once you have candidate segments, you need a way to compare them that is simple enough to explain to a leadership team and honest about uncertainty. We use one formula, a Henkan & Partners framework, with four terms:
Revenue at stake per month = segment users per month × conversion gap × average order value
Conversion gap = reference conversion rate − segment conversion rate
Opportunity = revenue at stake × reachability
Reachability = share of the segment the personalisation tool can recognise on the site, with consent, at the moment it matters
Each term is a question. Traffic: how many people enter this segment each month (an audience trigger gives you this directly)? Gap: compared with a group that is similar except for the thing you would change, how much lower is conversion? Value: what is an order worth for this segment? Reachability: of those people, how many can your testing or personalisation tool actually identify during the visit?
Two points make the formula useful rather than decorative. First, the reference group must be a fair comparison. Compare mobile cart abandoners with desktop cart abandoners, not with all visitors. Compare visitors outside the free-delivery zone with visitors inside it. Second, revenue at stake is an upper bound. No experience closes the whole gap; in practice you might close a fraction of it. The formula ranks segments; it does not forecast uplift.
A worked example (illustrative)
The table below uses illustrative numbers for a mid-sized fashion shop with about 400,000 monthly users. It is not client data. All figures were computed in Python from the inputs shown.
| Segment (reference group) | Users / month | Conversion vs reference | AOV | Revenue at stake | Reach | Opportunity |
|---|---|---|---|---|---|---|
| Outside free-delivery zone (inside the zone) | 38,000 | 0.90% vs 2.10% | €74 | €33,744 | 90% | €30,370 |
| Mobile cart abandoners (desktop cart abandoners) | 14,500 | 4.10% vs 6.30% | €85 | €27,115 | 70% | €18,980 |
| New mobile visitors from paid social (new mobile, other paid channels) | 52,000 | 0.55% vs 1.10% | €62 | €17,732 | 95% | €16,845 |
| Lapsed high-value buyers, 120+ days (active high-value buyers) | 4,800 | 3.20% vs 7.50% | €140 | €28,896 | 50% | €14,448 |
| Category-affine browsers, no purchase (other multi-product browsers) | 21,000 | 3.00% vs 3.60% | €70 | €8,820 | 60% | €5,292 |
| Email clickers landing on sale pages (email clickers landing elsewhere) | 3,200 | 2.40% vs 2.90% | €55 | €880 | 100% | €880 |
| Tablet visitors (desktop visitors) | 1,800 | 1.50% vs 1.90% | €66 | €475 | 100% | €475 |
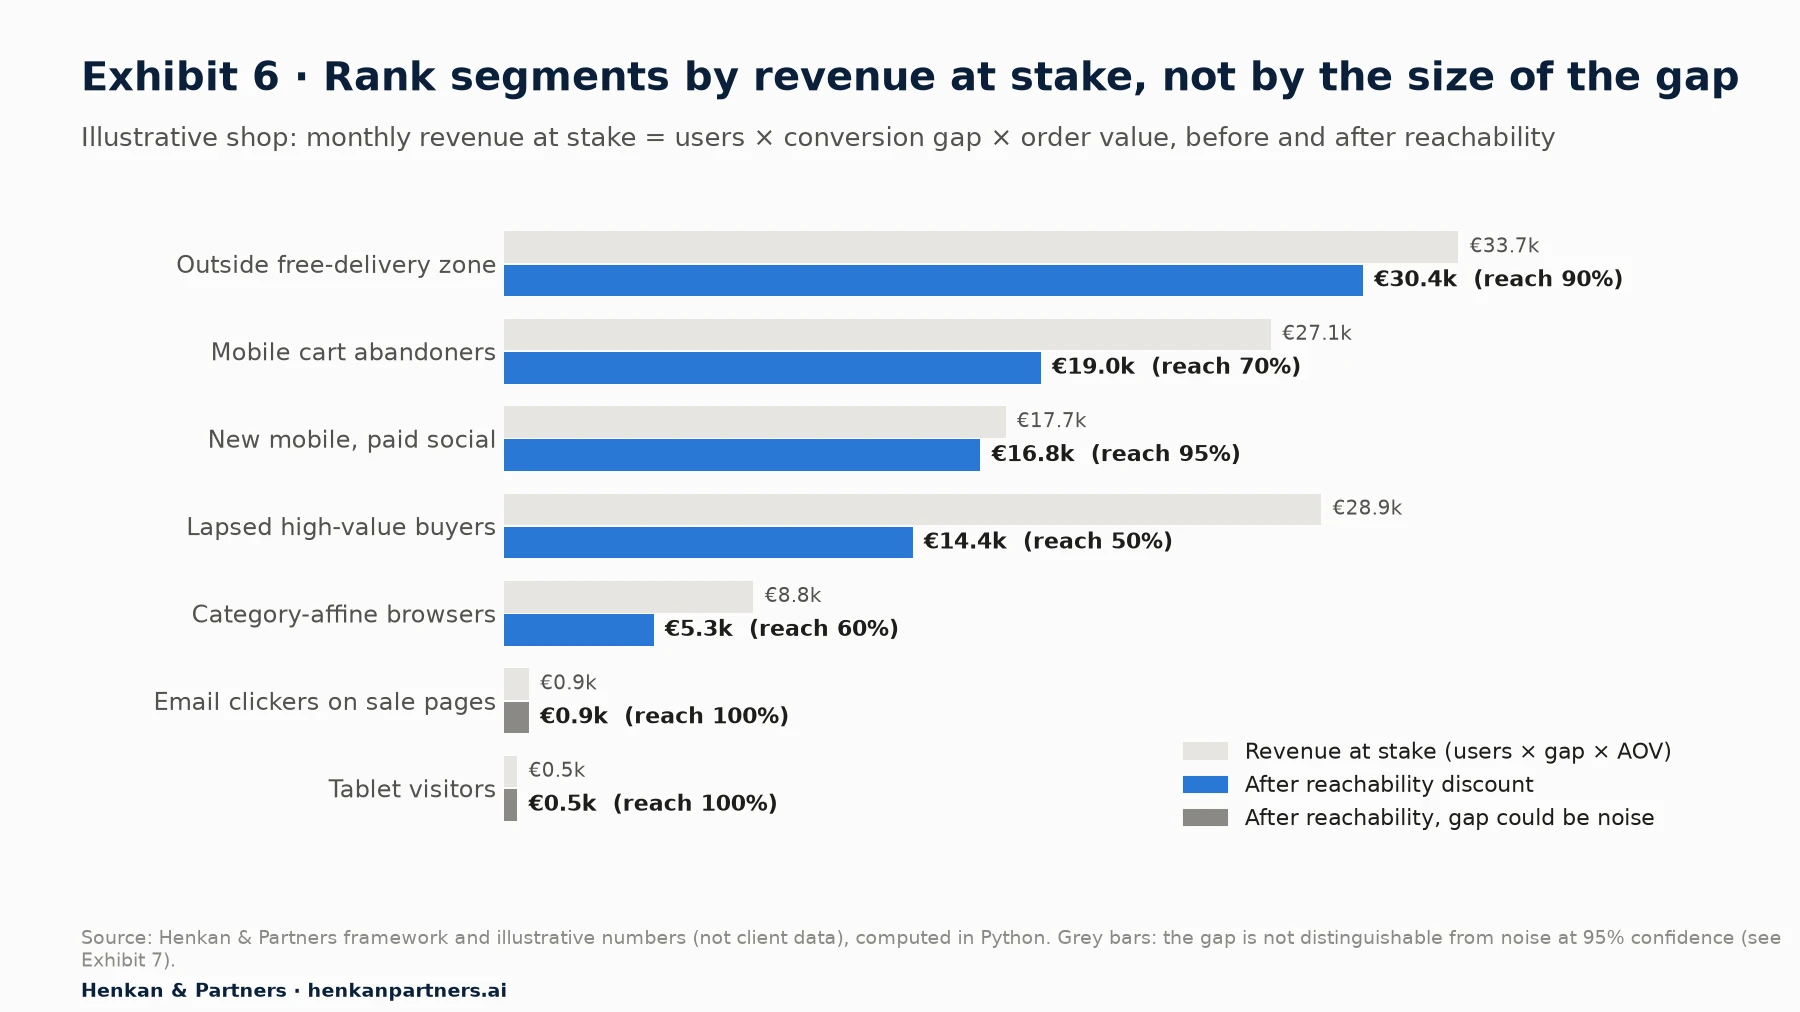
What this shows. The segment with the biggest gap, lapsed high-value buyers at 4.3 points, is not the biggest opportunity once you account for reach: only half of them can be recognised on site, typically when they log in or click a CRM email. The delivery-zone segment has a modest gap but large traffic and near-complete reach, because location is known on every visit. The two smallest segments are not worth an experience at all, even before the noise check.
For leaders. Ask for this table before approving any personalisation project. If the team cannot fill in the reference group, the traffic per month and the reachability, the project is not ready. A good first programme usually picks the top two or three segments and ignores the rest.
Section 7 · Noise
A gap is only worth personalising for if it survives a confidence interval
Every segment comparison is an estimate. With small segments, a gap that looks meaningful can be produced by chance. The check takes a few lines of Python: compute the difference in conversion rate between the segment and its reference group, and a 95% confidence interval around it. If the interval includes zero, you cannot rule out that the gap is noise.
from math import sqrt

def gap_ci(conv_seg, n_seg, conv_ref, n_ref, z=1.96):
    """Gap in conversion rate (reference minus segment) with a 95% interval."""
    p_seg, p_ref = conv_seg / n_seg, conv_ref / n_ref
    gap = p_ref - p_seg
    se = sqrt(p_seg * (1 - p_seg) / n_seg + p_ref * (1 - p_ref) / n_ref)
    return gap, gap - z * se, gap + z * se

# Email clickers on sale pages: 77 orders from 3,200 users
# Reference, email clickers elsewhere: 119 orders from 4,100 users
gap, lo, hi = gap_ci(77, 3200, 119, 4100)
print(f"{gap:.2%} [{lo:.2%} to {hi:.2%}]")   # 0.50% [-0.24% to 1.24%]
This is the normal approximation for a difference between two proportions. It is adequate when each group has at least a few dozen conversions. For very small counts, or for revenue per user, which is skewed, use a bootstrap: resample users with replacement a few thousand times and take the 2.5th and 97.5th percentiles of the difference.
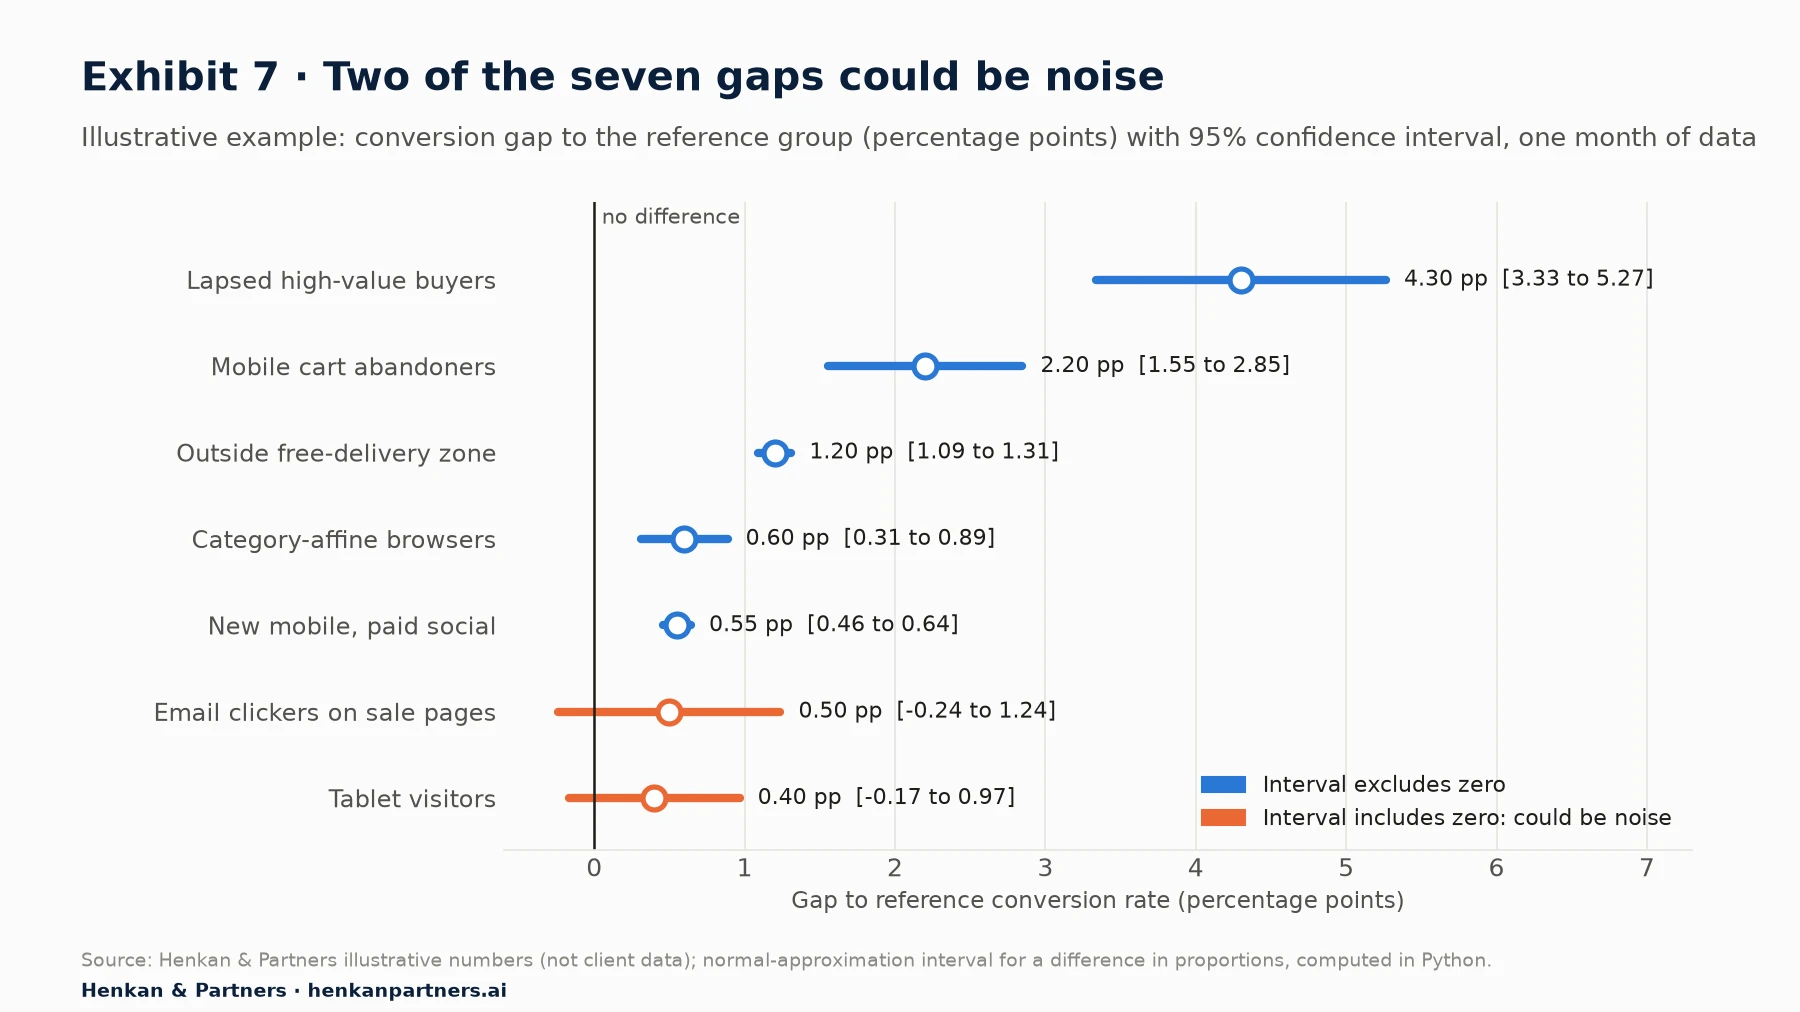
What this shows. The email and tablet gaps look similar in size to the paid social gap, but their intervals cross zero because the segments are small. The paid social gap is smaller in absolute terms and yet precise, because 52,000 users a month give a tight estimate. Size of gap and certainty about the gap are different things; you need both.
Three traps when you compare segments
- Multiple comparisons. Compare 20 segments and, at 95% confidence, you should expect about one false signal even if nothing is going on. Decide your candidate segments before you look, or treat the first round as exploratory and confirm on a fresh month of data.
- Simpson's paradox. A segment can look worse overall and better within every sub-group, because its mix is different (more mobile, more new visitors). Break the comparison down by device and new versus returning before you trust it. Our funnel and cohort analysis article shows a worked example.
- Correlation is not a lever. A gap tells you where to look, not what to change. Visitors outside the free-delivery zone may convert less because of delivery cost, or because they are further from your brand. Only a test can tell you whether a different experience changes the outcome.
Section 8 · BigQuery
The BigQuery export removes GA4's interface limits and lets you build value-based segments such as RFM
GA4's BigQuery export gives you every event as a row, with no sampling and no data thresholds (Analytics does not export Google signals data to BigQuery). Tables are named events_YYYYMMDD, with events_intraday_YYYYMMDD for the current day. Standard properties have a daily export limit of 1 million events; if a property consistently exceeds it, the daily export is paused, although the streaming export has no event limit. You can start in the free BigQuery sandbox, with its limitations.
The most useful segment you can build in BigQuery and not in the interface is RFM: recency (days since last order), frequency (number of orders) and monetary value (revenue). The query below computes RFM scores for the last 365 days from the export's standard fields: event_name, event_date, user_pseudo_id and the ecommerce record's transaction_id and purchase_revenue.
-- RFM segments from the GA4 BigQuery export, last 365 days
WITH orders AS (
  SELECT
    user_pseudo_id,
    ecommerce.transaction_id AS transaction_id,
    MAX(PARSE_DATE('%Y%m%d', event_date)) AS order_date,
    MAX(IFNULL(ecommerce.purchase_revenue, 0)) AS revenue
  FROM `my-project.analytics_123456789.events_*`
  WHERE _TABLE_SUFFIX BETWEEN
        FORMAT_DATE('%Y%m%d', DATE_SUB(CURRENT_DATE(), INTERVAL 365 DAY))
    AND FORMAT_DATE('%Y%m%d', DATE_SUB(CURRENT_DATE(), INTERVAL 1 DAY))
    AND event_name = 'purchase'
    AND ecommerce.transaction_id IS NOT NULL
    AND ecommerce.transaction_id != '(not set)'
  GROUP BY user_pseudo_id, transaction_id   -- removes duplicate purchase events
),
rfm AS (
  SELECT
    user_pseudo_id,
    DATE_DIFF(CURRENT_DATE(), MAX(order_date), DAY) AS recency_days,
    COUNT(*) AS frequency,
    SUM(revenue) AS monetary
  FROM orders
  GROUP BY user_pseudo_id
),
scored AS (
  SELECT
    *,
    NTILE(5) OVER (ORDER BY recency_days DESC) AS r_score,   -- 5 = most recent
    CASE WHEN frequency >= 5 THEN 5 ELSE frequency END AS f_score,
    NTILE(5) OVER (ORDER BY monetary) AS m_score             -- 5 = highest value
  FROM rfm
)
SELECT
  CASE
    WHEN r_score >= 4 AND f_score >= 3 AND m_score >= 4 THEN 'Champions'
    WHEN r_score <= 2 AND f_score >= 2 AND m_score >= 4 THEN 'Lapsed high value'
    WHEN r_score >= 4 AND f_score = 1 THEN 'New buyers'
    WHEN f_score >= 2 THEN 'Repeat buyers'
    ELSE 'One-off, lapsing'
  END AS rfm_segment,
  COUNT(*) AS users,
  ROUND(AVG(recency_days), 1) AS avg_recency_days,
  ROUND(AVG(frequency), 2) AS avg_orders,
  ROUND(SUM(monetary), 0) AS revenue
FROM scored
GROUP BY rfm_segment
ORDER BY revenue DESC;
A few notes on the query. Frequency uses fixed bands rather than quintiles because most customers have one order, and quintiles would split identical customers arbitrarily. purchase_revenue is in the currency sent with the event; if you sell in several currencies, use purchase_revenue_in_usd or convert first. The date filter skips the intraday tables, whose suffix starts with intraday_, so the query reads only complete days.
The biggest caveat is identity. user_pseudo_id identifies a browser or app instance, not a person: the same customer on phone and laptop appears twice, and cleared cookies create new IDs. If you send a user_id when customers log in, group by user_id where it exists. For high-value segments, your CRM or order system is usually a better source of truth than GA4, and the export is best used to join behaviour to it.
For analysts. To activate an RFM segment on the site, do not try to push the whole table back into GA4. Send the segment as a user property (for example rfm_segment) from your data layer when a customer logs in or is recognised from a CRM email click, then build a GA4 audience on that property. Never send names, emails or customer numbers; a band such as "Lapsed high value" is enough.
Section 9 · Activation
A segment creates value only when it reaches a tool that can change the experience
GA4 cannot change your website. To personalise, the audience has to reach a tool that can: an advertising platform for off-site messages, or a testing and personalisation tool for on-site experiences. When Google announced the end of Optimize in 2023, it said it would work on integrations with Optimizely, VWO and AB Tasty, and a public API for other tools. Today, several vendors document ways to use GA4 audiences for targeting.
| Destination | How GA4 audiences get there | Delay and limits (vendor documentation) |
|---|---|---|
| Google Ads, DV360, SA360 | Native sharing once the products are linked and personalised advertising is enabled | Google Ads needs at least 100 active users in the last 30 days for a list to serve on Display, Search or YouTube |
| Optimizely Web Experimentation | GA4 audiences integration matched on the _ga cookie (device ID) or a user ID you provide | Up to two days for GA4 to add a user, then up to one day for Optimizely; audiences using age, gender or interests are ineligible |
| AB Tasty (now part of Wingify) | Pushes its visitor ID into a GA4 user property, then pulls audience membership through the Google Analytics API | Audiences refreshed daily; 24 hours after set-up before audiences appear; empty audiences are not shown |
| VWO (now Wingify) | GA4 audience list condition in custom segments | Up to five GA4 audiences synced at a time; Pro and Enterprise plans |
| Kameleoon | Pushes its visitor code to GA4 as a custom dimension, then reads audience data through Google's APIs with a service account | Requires the Reporting, Data and Analytics APIs and Viewer access on the property |
| CRM, email, warehouse | BigQuery export, or the Data API's audience exports (a snapshot of users in an audience) | Depends on your pipeline |
Note the vendor landscape is moving. In September 2026, AB Tasty and VWO announced they had united under the Wingify brand; product names and integration pages may change during the transition, so check the current documentation before you build.
Three constraints apply whatever the tool.
- Latency. GA4-based audiences are at least a day old by the time a testing tool sees them. That is fine for "lapsed high-value buyer" and useless for "abandoned a basket ten minutes ago". For in-session segments, let the testing tool evaluate the condition itself from the data layer.
- Consent. In the EEA, Google requires affirmative consent signals for personalised advertising and remarketing. Analytics expects the ad_user_data and ad_personalization consent mode parameters; without them, only users outside the EEA are included in audiences shared with linked advertising products. On-site personalisation tools have their own consent requirements, usually tied to your cookie banner.
- Thresholds and demographics. Audiences built on age, gender or interests are affected by data thresholds and, in Optimizely's case, cannot be exported at all. Build personalisation audiences on first-party behaviour and your own dimensions.
Our User Consent in E-commerce article covers consent rules in more detail. The practical consequence for the opportunity formula is that reachability is rarely 100%: consent rates, logged-out visitors and cross-device journeys all reduce it.
Disclosure: Henkan & Partners implements and runs programmes on several of the testing and personalisation tools named in this section. No vendor reviewed or paid for this article.
Section 10 · Proof
Test every personalised experience against a holdout, or you will credit it with sales it did not cause
Segments that are selected because they convert differently will drift back towards the average on their own. This is regression to the mean, and it is why before-and-after comparisons flatter personalisation. The only reliable way to measure a personalised experience is to keep a random part of the segment on the default experience and compare.
Holdouts are expensive in traffic, and the split changes how long you wait. In our illustrative example, mobile cart abandoners convert at 4.1%. Detecting a 15% relative lift (to about 4.7%) with 95% confidence and 80% power needs about 17,500 users per group. With a 50/50 split, that is about 35,000 users, or 2.4 months of the segment's traffic. With a 90/10 split that protects revenue, it rises to about 92,000 users, or 6.3 months. The trade-offs between A/B tests, holdouts and bandits for personalisation are covered in Segments, Bandits or A/B Tests?, and the page-level mechanics in the essential guide to web personalisation.
- Decide the metric before you launch. For acquisition segments, conversion rate; for high-value buyers, revenue per user or repeat purchase over 90 days.
- Keep a global holdout of a few per cent of all traffic that sees no personalisation at all, to measure the programme as a whole.
- Retire experiences that stop winning. Re-test each personalised experience at least once a year; segments and their needs change.
Where AI helps, and where it does not
AI assistants can now query GA4 directly. Google publishes an experimental, read-only Google Analytics MCP server (Model Context Protocol, a standard way for AI assistants to call tools) with tools such as run_report and run_funnel_report. An assistant connected to it can run dozens of segment breakdowns in minutes and draft the opportunity table. That is a real productivity gain for the exploration step.
It also makes the traps in Section 7 worse. An assistant that runs 50 comparisons will find a few impressive gaps by chance, and it will not know which reference group is fair. Ask it to report the date range, the comparison group and a confidence interval for every gap it proposes, and check one number by hand. Treat its output as a list of hypotheses, not a list of decisions.
Section 11 · What to do next
Five steps take you from a list of GA4 segments to personalisation you can prove
| Team size | Start with | Add later |
|---|---|---|
| One or two people | Two free-form explorations (device × new/returning; source × device) and the opportunity table for the top five candidates | One audience per validated segment and one audience trigger |
| Growing e-commerce team | Delivery zone and customer status as custom dimensions; audiences shared with your testing tool | RFM in BigQuery; holdout tests for the top two segments |
| Mature programme | BigQuery-based segments joined to CRM; a global holdout | Predictive audiences if eligible; AI-assisted exploration with human review |
1. List candidate segments from explorations
Run two or three free-form explorations with segment comparisons, one segment overlap and one backward path from purchase. Write down every group whose conversion or value looks different, with its reference group.
2. Fill the data gaps
For segments GA4 cannot see, such as delivery zone, customer status or lifetime value band, add the custom dimension or user property first. Create the matching audiences now so they build history.
3. Rank by opportunity and check for noise
Fill in traffic, gap, order value and reachability for each candidate. Put a confidence interval on every gap and drop the ones that include zero. Keep the top two or three.
4. Activate through the right tool
Use the testing tool's own targeting for in-session segments and GA4 audiences for slower-moving ones. Confirm consent handling and the delay before users qualify.
5. Test against a holdout and report the result
Size the holdout before you build the experience, run it to the planned sample size and report the lift with its interval. If you want help choosing and proving your first personalisation segments, Talk to us.
FAQ
Frequently asked questions about GA4 personalisation segments
Frequently asked questions
What is a personalisation segment in GA4?
It is a group of visitors, defined from GA4 data, who behave differently enough, are numerous enough and can be recognised during a visit, so that showing them a different experience is worth it. In GA4 you usually find it as a segment in an exploration and then rebuild it as an audience to act on it.
What is the difference between segments and audiences in GA4?
A segment is a filter on report data and is fully retroactive; you use it for analysis in explorations. An audience is a list of users with membership over time, built from the day you create it with up to 30 days of backfill, and it can be shared with Google Ads and other tools.
How many segments can I compare in a GA4 exploration?
You can create up to 10 segments per exploration and apply up to four to one technique at once. Segment overlap compares up to three user segments. A standard property can save 50 segments, or 200 in GA4 360.
What are the requirements for GA4 predictive audiences?
In one seven-day period within the last 28 days, at least 1,000 returning users must have triggered the predicted condition, such as a purchase, and at least 1,000 must not have. You must send purchase events with value and currency, and the model's quality must stay above Google's minimum.
Why are GA4 audiences not showing historical users?
Audiences are not calculated retroactively. GA4 backfills up to 30 days of data if it is available, and it can take 24 to 48 hours for a new audience to accumulate users. Create audiences early for the segments you expect to use.
Can I use GA4 audiences in A/B testing tools?
Yes, several tools document GA4 audience integrations, including Optimizely Web Experimentation, AB Tasty and VWO (both now part of Wingify) and Kameleoon. Expect a delay of about a day or more, and note that audiences based on age, gender or interests may not be usable.
How do I know if a segment is worth personalising for?
Estimate revenue at stake as monthly users times the conversion gap to a fair reference group times average order value, then multiply by the share of users you can recognise on site. Check that the gap's confidence interval excludes zero, and test the experience against a holdout.
Do I need BigQuery to build personalisation segments?
Not to start. Explorations and audiences cover most behavioural segments. BigQuery becomes useful for value-based segments such as RFM, for avoiding sampling and thresholds, and for joining GA4 behaviour to your CRM.
What are GA4 audience triggers used for?
An audience trigger logs an event when a user joins an audience. You can mark it as a key event, count daily entries into a segment and use it in funnels and comparisons. A property can have up to 20.
Key terms
- Segment (GA4)
- A set of conditions that filters data in an exploration, scoped to users, sessions or events. It is retroactive, which makes it the right tool for finding where behaviour differs.
- Audience (GA4)
- A list of users who meet conditions, with membership that changes over time. It matters because it is the object you can share with advertising and testing tools.
- Audience trigger
- An event GA4 logs when a user joins an audience. It lets you count entries into a segment and use them in reports and funnels.
- Predictive metric
- A machine-learning score in GA4: purchase probability, churn probability or predicted revenue. Useful for targeting at scale, but only available to properties that meet Google's thresholds.
- Predictive audience
- An audience with at least one condition on a predictive metric, such as likely 7-day purchasers. It inherits the eligibility rules of the underlying metric.
- Segment overlap
- An exploration technique that shows how up to three user segments intersect. It tells you whether two personalisation targets are really different people.
- Path exploration
- An exploration that draws journeys forward from a start point or backward from an end point. It helps you see how different segments reach purchase.
- Data thresholds
- Rules that hide rows in GA4 to prevent identification of individuals, mainly with demographic data, search queries and low counts over narrow date ranges. They can make small segments look empty.
- Sampling
- Using a subset of events when a query exceeds its quota: 10 million events per exploration in standard properties. It makes small segment estimates less reliable.
- Reachability
- The share of a segment that the personalisation tool can recognise on the site, with consent, at the right moment. It discounts revenue at stake to a realistic opportunity.
- Reference group
- The group a segment is compared with to measure its gap, chosen to differ only in the thing you would change. A poor reference group makes any gap meaningless.
- Confidence interval
- A range of plausible values for an estimate, such as a conversion gap. If a 95% interval includes zero, the gap could be noise.
- RFM
- Recency, frequency and monetary value: a way to score customers by their order history. It is a simple, transparent alternative to predictive audiences.
- user_pseudo_id
- The GA4 export's identifier for a browser or app instance. It matters because one customer can have several, which splits value-based segments.
- Holdout
- A random part of a segment kept on the default experience. It is the only reliable way to measure what a personalised experience adds.
Sources
Methodology. This deep dive was researched in September 2026 from Google's official documentation (Google Analytics Help, Google Ads Help, the Google Analytics Data API and the Google Analytics MCP repository), vendor documentation (Optimizely, AB Tasty, Wingify/VWO, Kameleoon), a company press release, Contentsquare's 2026 benchmark (vendor data), Baymard Institute research and McKinsey's personalisation research. All GA4 limits and thresholds were checked on Google's help pages in September 2026 and can change. Exhibits 1, 6 and 7, the segment opportunity formula and the worked example are Henkan & Partners frameworks with illustrative numbers computed in Python, not client data. For context on why personalisation is worth the effort, McKinsey's Next in Personalization 2021 report found that personalisation most often drives a 10 to 15% revenue lift, with a company-specific range of 5 to 25%.
- Google Analytics Help (2026). GA4: Segment builder.
- Google Analytics Help (2026). GA4: Segment overlap.
- Google Analytics Help (2026). GA4: Path exploration.
- Google Analytics Help (2026). Create, edit and archive audiences.
- Google Analytics Help (2026). Introduction to audiences in Google Analytics.
- Google Analytics Help (2026). GA4: Audience triggers.
- Google Analytics Help (2026). GA4: Predictive metrics.
- Google Analytics Help (2026). GA4: Predictive audiences.
- Google Analytics Help (2026). GA4: Data thresholds.
- Google Analytics Help (2026). GA4: About data sampling.
- Google Analytics Help (2026). GA4: BigQuery Export schema.
- Google Analytics Help (2026). GA4: Set up BigQuery Export.
- Google Analytics Help (2026). GA4: Verify and update consent settings in Google Analytics.
- Google Ads Help (2026). Updates to consent mode for traffic in European Economic Area (EEA).
- Google Ads Help (2026). About audience segment size.
- Google for Developers (2026). Audience export basics, Google Analytics Data API.
- Google Analytics on GitHub (2026). Google Analytics MCP server (experimental).
- Optimizely (2026). Integrate GA4 Audiences for Optimizely Web Experimentation.
- AB Tasty (2026). Google Analytics pull integration.
- Wingify (2023). GA4 Audience Integration, product update.
- Kameleoon (2026). Google Analytics 4 Audiences.
- PR Newswire (2026). AB Tasty and VWO Unite Under Wingify, Launching a Unified Platform, New Brand Identity, and a Website.
- MarTech (2023). Google to remove GA4 integration with Optimize.
- Contentsquare (2026). Conversion Rates in 2026: Benchmarks, AI, and What's Driving Growth (vendor data).
- Contentsquare (2026). Digital Retention in 2026: Insights on Returning Visitors and Conversion (vendor data).
- Contentsquare (2026). 15 mobile analytics stats from the 2026 benchmark report (vendor data).
- Baymard Institute (2025). Cart & Checkout Abandonment Rate Statistics.
- McKinsey & Company (2021). The value of getting personalization right, or wrong, is multiplying.