Focus
Measuring Personalisation ROI: Holdouts, Incrementality and Honest Attribution
Alexandre Suon · 2026-09-28
Personalisation ROI is the extra profit your personalised experiences create compared with showing everyone the same site, and most dashboards do not measure it. This guide explains why vendor-reported personalisation revenue overstates impact, how to measure incrementality with A/B tests and global holdout groups, how big and how long a holdout should be, and how to build an honest personalisation P&L your finance team will accept.
Executive summary
- Attributed revenue is not incremental revenue. Vendor dashboards credit every purchase that follows a click, within a window that ranges from a 30-minute session (Nosto) to 30 days (Dynamic Yield recommendations). A study of 2.1 million Amazon users found that at least 75% of recommendation click-throughs would likely have happened without the recommendation.
- Only a randomised comparison measures personalisation ROI. Use A/B tests to judge each experience and a global holdout (a small group that sees no personalisation) to judge the programme as a whole. Optimizely and Dynamic Yield default to 5%; Adobe Target will not let an Auto-Target control fall below 10%.
- A smaller holdout is not cheaper, only slower. In our illustrative example (100,000 visitors a week, 2.5% conversion), detecting a 5% lift takes about 26 weeks with a 5% holdout and 14 weeks with 10%, but the revenue forgone is almost the same, about EUR 13,000. Size the holdout by how fast you need an answer.
- The sum of winning tests overstates the total. Disney Streaming found that the impact of one feature often partly cannibalises another. Novelty effects fade and user learning builds over weeks: Google estimated a 60-day half-life for users' learned response to ads, so a 90-day test captured only about 65% of the long-term effect.
- Judge personalisation on margin, not revenue. Guardrail metrics (gross margin, return rate, discount cost, unsubscribes, page speed) stop a programme from buying revenue it cannot keep. Field tests of recommenders that measure sales directly typically report increases of 1% to 5%, far below headline claims.
- Build a personalisation P&L and review it quarterly. Incremental gross margin from the holdout, minus tooling, content, engineering and analytics costs, gives the net contribution. Every major platform now supports holdouts; the gap is usually process and governance, not tooling.
Section 1 · Definitions
Personalisation ROI is the profit you would lose if you switched personalisation off
Personalisation ROI (return on investment) is the incremental profit generated by personalised experiences, measured against a randomised control group that receives the default experience, divided by the full cost of running personalisation. Incrementality is the part of an outcome that would not have happened without the intervention; it is the only part that belongs in an ROI calculation.
Personalisation means showing different products, content, messages or offers to different people, based on what you know about them. Our Essential Guide to Personalisation covers what to personalise and how to launch a programme. This article answers the question that comes next, usually from the finance team: is it paying for itself?
The honest answer needs a counterfactual. A counterfactual is what would have happened to the same customers if you had not personalised. You cannot observe it directly for any one customer, because nobody both sees and does not see the same banner. You can estimate it for a group, by randomly assigning some people to see nothing personalised and comparing them with everyone else. That comparison is the whole discipline in one sentence.
Three terms are worth fixing before we go further:
- Attributed revenue is revenue a tool credits to itself, usually because a purchase followed a click or an open within a set time window. It measures association, not cause.
- Influenced revenue (sometimes called assisted revenue) is a wider version: any order from a session or customer that was exposed to a personalised element, clicked or not. It is larger still, and even less causal.
- Incremental revenue (or lift) is the difference between the treated group and a randomised control, scaled to the treated population. It is the only one of the three that answers the ROI question.
For marketers. Keep reporting attributed revenue if you find it useful for day-to-day optimisation, but never put it in a business case.
For leaders. Ask one question of any personalisation number: compared with what? If the answer is not a randomised control group, the number is not an ROI.
Section 2 · Why dashboards overstate
Vendor-reported revenue overstates impact because it counts purchases that would have happened anyway
Almost every personalisation and CRM tool has a revenue tile on its home screen. The number is usually large, and it is usually honest about what it counts. The problem is what it does not count: the purchases that the same customers would have made without the tool. Three mechanisms inflate it.
1. Attribution windows decide what gets credited
An attribution window is the period after a click or open during which a purchase is credited to that touchpoint. Vendors choose different defaults, and the choice can change the reported figure by an order of magnitude. Nosto credits a recommendation only if the recommended item is bought in the same 30-minute session. Klaviyo's default is five days after an email open or click, five days after an SMS click and one day after an SMS open, using a last-touch model. Dynamic Yield's recommendation report credits a purchase that includes a clicked recommended item within 30 days of the click, and lets you shorten the window.
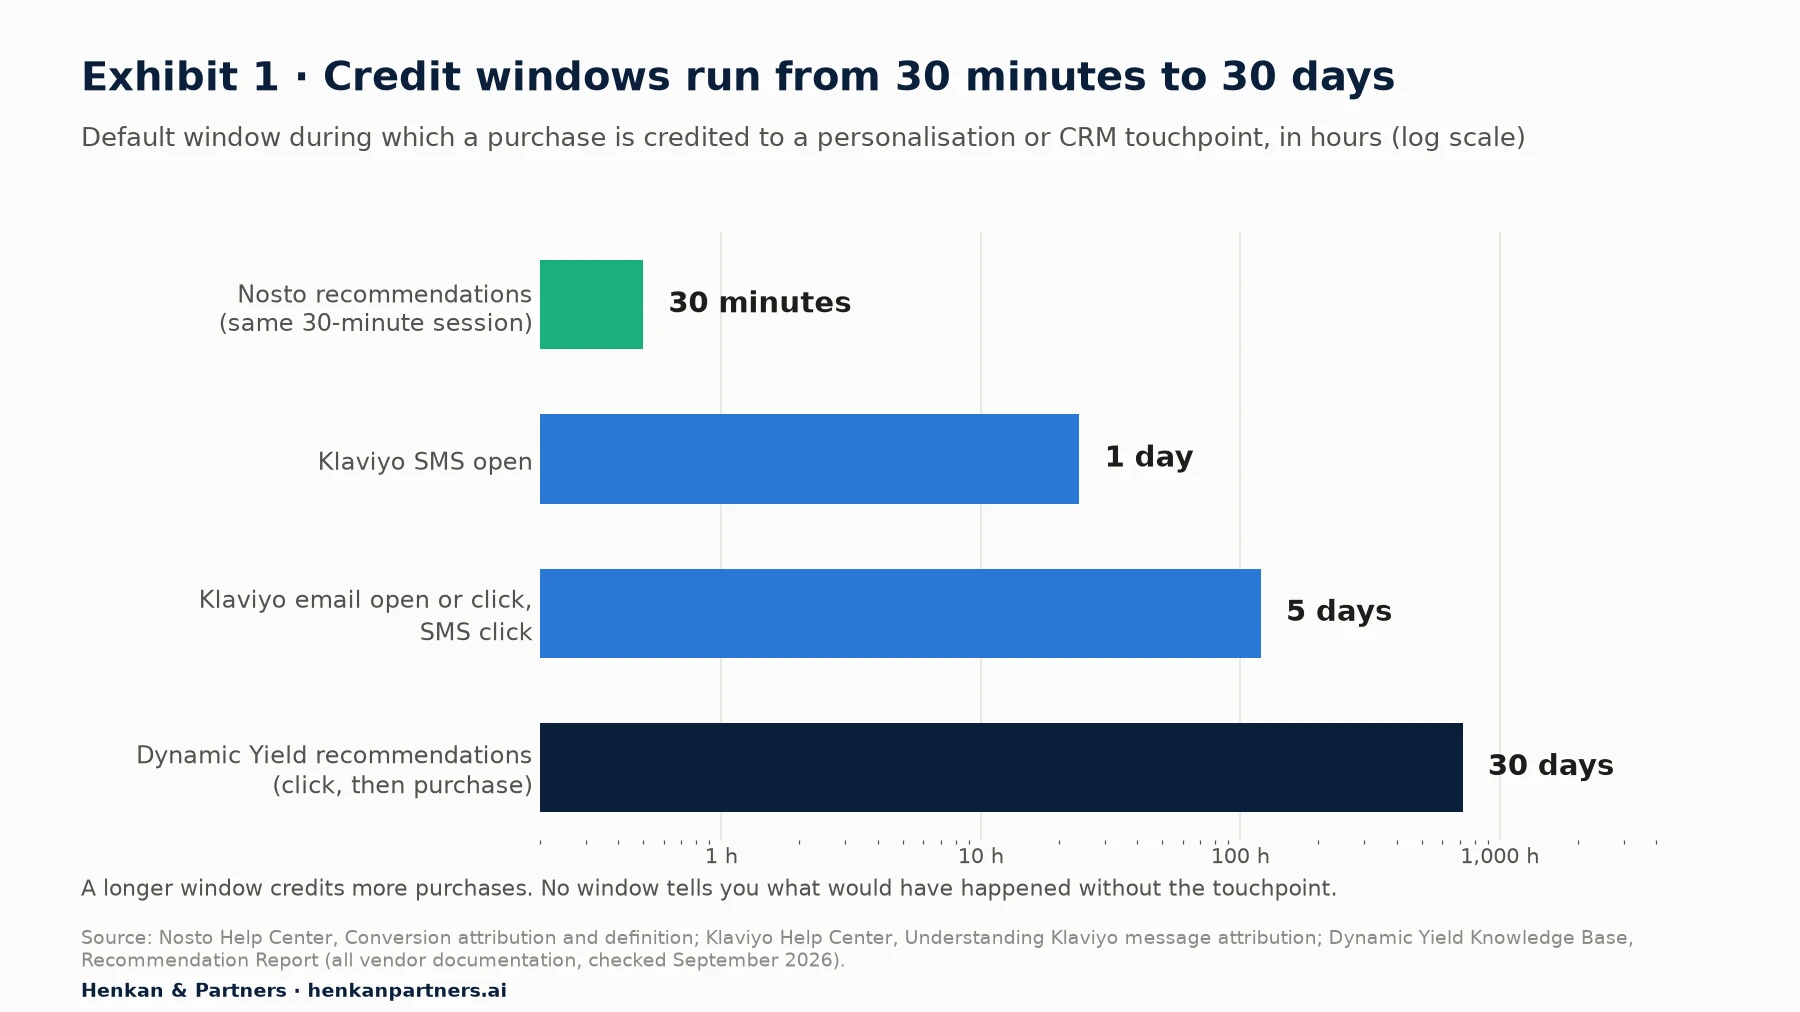
What this shows. The same customer journey can be credited to a recommendation, an email and an SMS at once, each under its own rules. None of these windows is wrong; they simply answer a different question from ROI. Before comparing channels or vendors, write down each tool's window and model, and never add their attributed revenues together.
2. 'Influenced revenue' counts exposure, not effect
Influenced or assisted revenue widens the net further, to every order in which the customer saw a personalised element. On a site where most sessions pass a personalised homepage banner or a recommendation strip, influenced revenue can approach total revenue by construction. It tells you how much of the business your tool touches. It says nothing about how much of the business your tool changes.
3. Selection bias: people who click were already likely to buy
The deepest problem is selection bias. The customers who engage with recommendations, open emails or click personalised offers are not a random sample. They are more engaged, more loyal and closer to purchase. Comparing their conversion rate with that of non-clickers mixes the effect of personalisation with the effect of who they already were.
The best-known estimate of the size of this bias comes from a study by Amit Sharma, Jake Hofman and Duncan Watts at Microsoft Research, presented at the ACM Conference on Economics and Computation in 2015. Using a natural-experiment method on browsing data from 2.1 million Amazon users over nine months and more than 4,000 products, they found that recommendations generate many click-throughs, but estimated that "at least 75% of this activity would likely occur in the absence of recommendations". Shoppers would have reached the same products through search or navigation. Our guide to e-commerce product recommendations covers how to design recommendations that create more of the causal quarter.
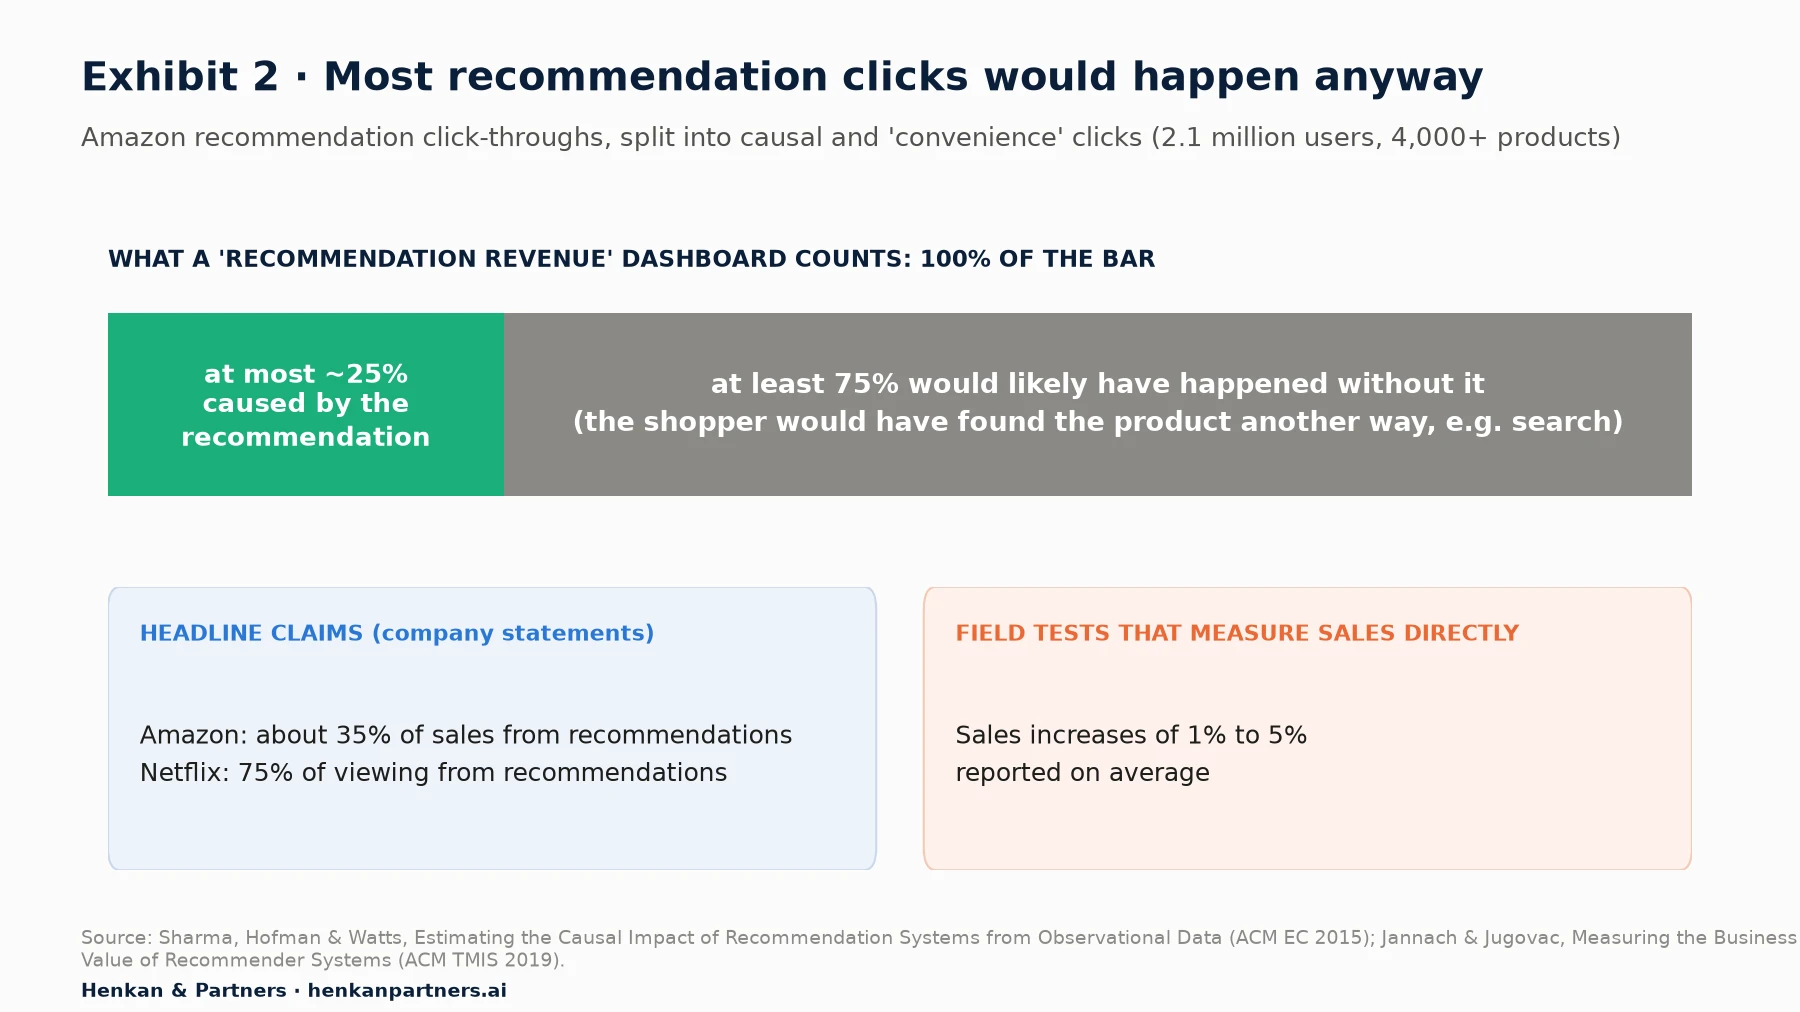
What this shows. The gap between headline claims and controlled evidence is large. Jannach and Jugovac's 2019 review of recommender business value notes that the most widely quoted figures are company statements rather than published measurements: Amazon's 35% of sales from recommendations traces back to a 2006 statement by its chief executive, and of Netflix's estimate that recommendations are worth more than USD 1 billion a year, the authors write that how the numbers were estimated "is, unfortunately, not specified in more detail". Where business effects are measured directly, increases in sales "between one and five percent are reported on average". For a large retailer, 1% to 5% is still a substantial win; it is just not 35%.
The same pattern appears wherever researchers have been able to compare observational measurement with a proper experiment. At eBay, Tom Blake, Chris Nosko and Steven Tadelis ran large field experiments on paid search and found that brand-keyword ads had no measurable short-term benefit, and that observational estimates overstated returns because searching and buying were correlated. At Facebook, Brett Gordon and colleagues compared observational methods with 15 randomised advertising experiments (500 million user-experiment observations) and found that the observational methods "often fail to produce the same effects as the randomized experiments", even with extensive controls. Personalisation, recommendations and triggered CRM messages share the same structure: they are shown to people who are already on their way to buying.
What the McKinsey numbers do and do not say
The most cited figures on personalisation value come from McKinsey's Next in Personalization 2021 report (Arora, Ensslen, Fiedler and colleagues, November 2021). They state that "personalization most often drives 10 to 15 percent revenue lift (with company-specific lift spanning 5 to 25 percent, driven by sector and ability to execute)", that 71% of consumers expect personalised interactions and 76% get frustrated when this does not happen, and that faster-growing companies "drive 40 percent more of their revenue from personalization" than slower-growing ones.
These numbers are useful for setting ambition, but read them carefully. The 10% to 15% is a typical range across McKinsey's work, not a guaranteed outcome, and the spread of 5% to 25% is driven by "ability to execute". The consumer figures are survey responses about expectations, not measured behaviour. The 40% figure is a correlation between growth and personalisation share; it does not show that personalisation caused the growth. None of these figures replaces a controlled measurement on your own traffic.
Our view. A good personalisation programme can be worth several percent of online revenue, which is a lot of money. The risk is not that personalisation fails; it is that attributed numbers ten times larger set expectations that no honest measurement will meet, and the programme loses credibility the day someone runs a holdout.
Section 3 · The measurement toolkit
Measure at three levels, because each answers a different question
No single method answers every question about personalisation value. In our experience, a mature programme uses three layers, each with a clear job and a known blind spot.
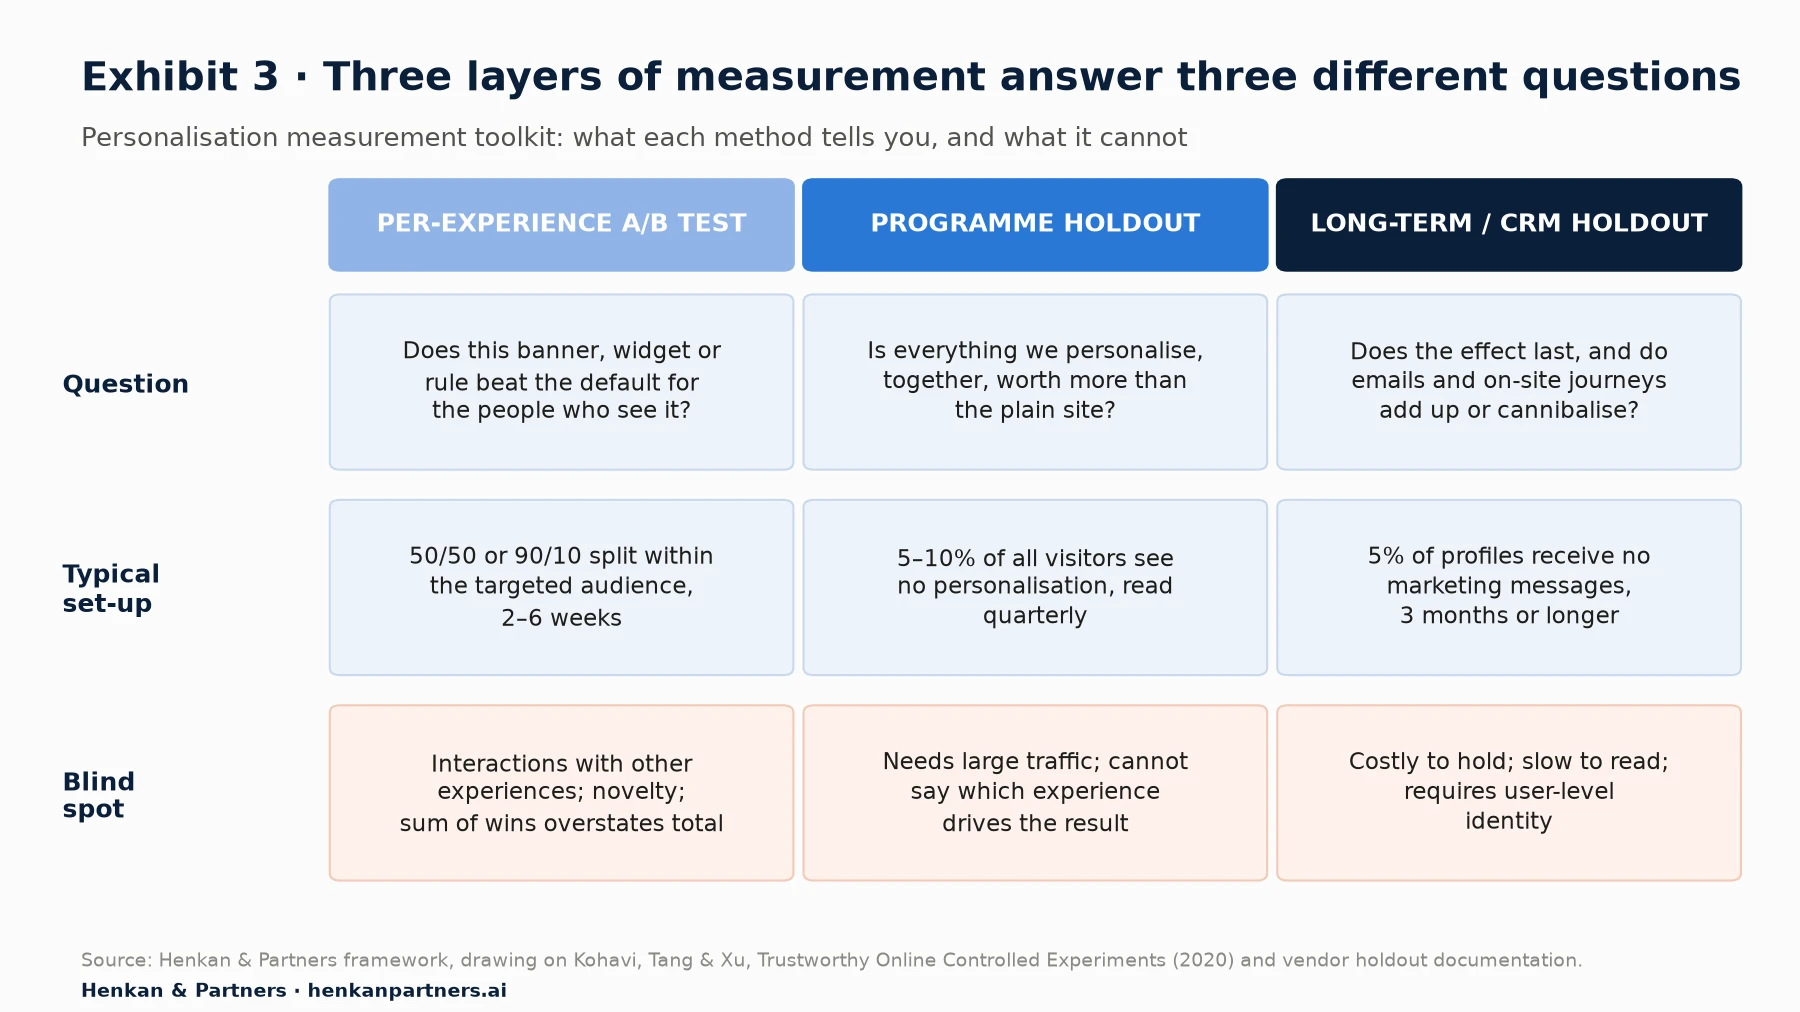
What this shows. Most teams run only the first layer and then add up the results. The second and third layers exist precisely because that sum is unreliable. Start with per-experience tests, add a programme holdout as soon as you run more than a handful of experiences at once, and add a CRM holdout when email and SMS are a material part of your personalisation.
Layer 1: an A/B test for each experience
Every personalised experience is a hypothesis: showing this segment this content will improve this metric. Test it like any other hypothesis. Randomly split the targeted audience between the personalised version and the default, run the test for full weeks, and read the result on the metric you chose in advance. Our guide to segments, bandits and A/B tests covers how to choose between a fixed split and a bandit, and the guide to A/B test statistical models explains frequentist, Bayesian and sequential readings.
Two details matter more for personalisation than for ordinary tests:
- Analyse only the people who could see the difference. This is called triggering: you include a visitor in the analysis only once they reach the point where control and variant diverge. Including everyone dilutes the effect and wastes statistical power.
- Randomise by customer, not by session. Personalisation often follows a customer across visits and channels. Session-level randomisation lets the same person see both versions and blurs the result.
Layer 2: a programme holdout, or global control group
A global control group (also called a universal holdout) is a randomly chosen share of visitors or customers who see no personalisation at all, across every campaign, for a long period. Everyone else sees the full programme. Comparing the two gives the combined effect of everything you personalise, including interactions between experiences and any effects that build up over time.
This is the number that belongs in a business case. It is also the number that most often surprises teams, because it is usually smaller than the sum of individual test wins (Section 6 explains why).
Layer 3: long-term and CRM holdouts
Email, SMS and push personalisation have their own holdout mechanisms. Klaviyo's global holdout groups withhold a share of profiles from campaign and flow messages (transactional messages still go out), and Braze's Global Control Group excludes a random share of users from campaigns and Canvases. Because customers move between channels, a CRM holdout also shows whether on-site and messaging personalisation are adding up or claiming the same purchases.
Section 4 · Holdout design
Size the holdout for the question, because a smaller one costs the same and takes longer
The two questions every team asks are how big? and how long? The answers depend on your traffic, your conversion rate and the smallest lift you care about, and they are linked by the same arithmetic as any A/B test. The twist is that a holdout is deliberately unbalanced: most traffic goes to personalisation, a small share to control, and the small group sets the precision.
The arithmetic
For a conversion-rate metric, the number of visitors you need in total, for a holdout share h, is approximately:
N_total ≈ (z_α/2 + z_β)² × p(1 − p) × (1/h + 1/(1 − h)) / (p × MDE)²

where
p = baseline conversion rate
MDE = minimum detectable effect, as a relative lift (e.g. 0.05 for 5%)
z_α/2 = 1.96 for 5% significance (two-sided); z_β = 0.84 for 80% power
h = share of visitors held out (e.g. 0.05)
The term (1/h + 1/(1 − h)) is the cost of imbalance. It equals 4 for a 50/50 split, about 11 for a 10% holdout, 21 for 5% and 51 for 2%. In other words, a 5% holdout needs roughly five times as many visitors as a 50/50 test to detect the same lift.
A worked example (illustrative)
Take an illustrative retailer with 100,000 unique visitors a week, a 2.5% conversion rate and an average order value of EUR 80, so about EUR 200,000 of weekly online revenue. Assume personalisation truly lifts conversion by 5%. We computed, in Python, how long each holdout size needs to detect that lift at 5% significance and 80% power, and how much revenue the held-out visitors forgo in the meantime.
| Holdout share | Visitors needed | Weeks to detect a 5% lift | Revenue forgone per week | Revenue forgone until readable |
|---|---|---|---|---|
| 2% | 6.2 million | 62 | EUR 200 | EUR 12,500 |
| 5% | 2.6 million | 26 | EUR 500 | EUR 12,900 |
| 10% | 1.4 million | 14 | EUR 1,000 | EUR 13,600 |
| 20% | 0.8 million | 7.7 | EUR 2,000 | EUR 15,300 |
| 50% | 0.5 million | 4.9 | EUR 5,000 | EUR 24,500 |
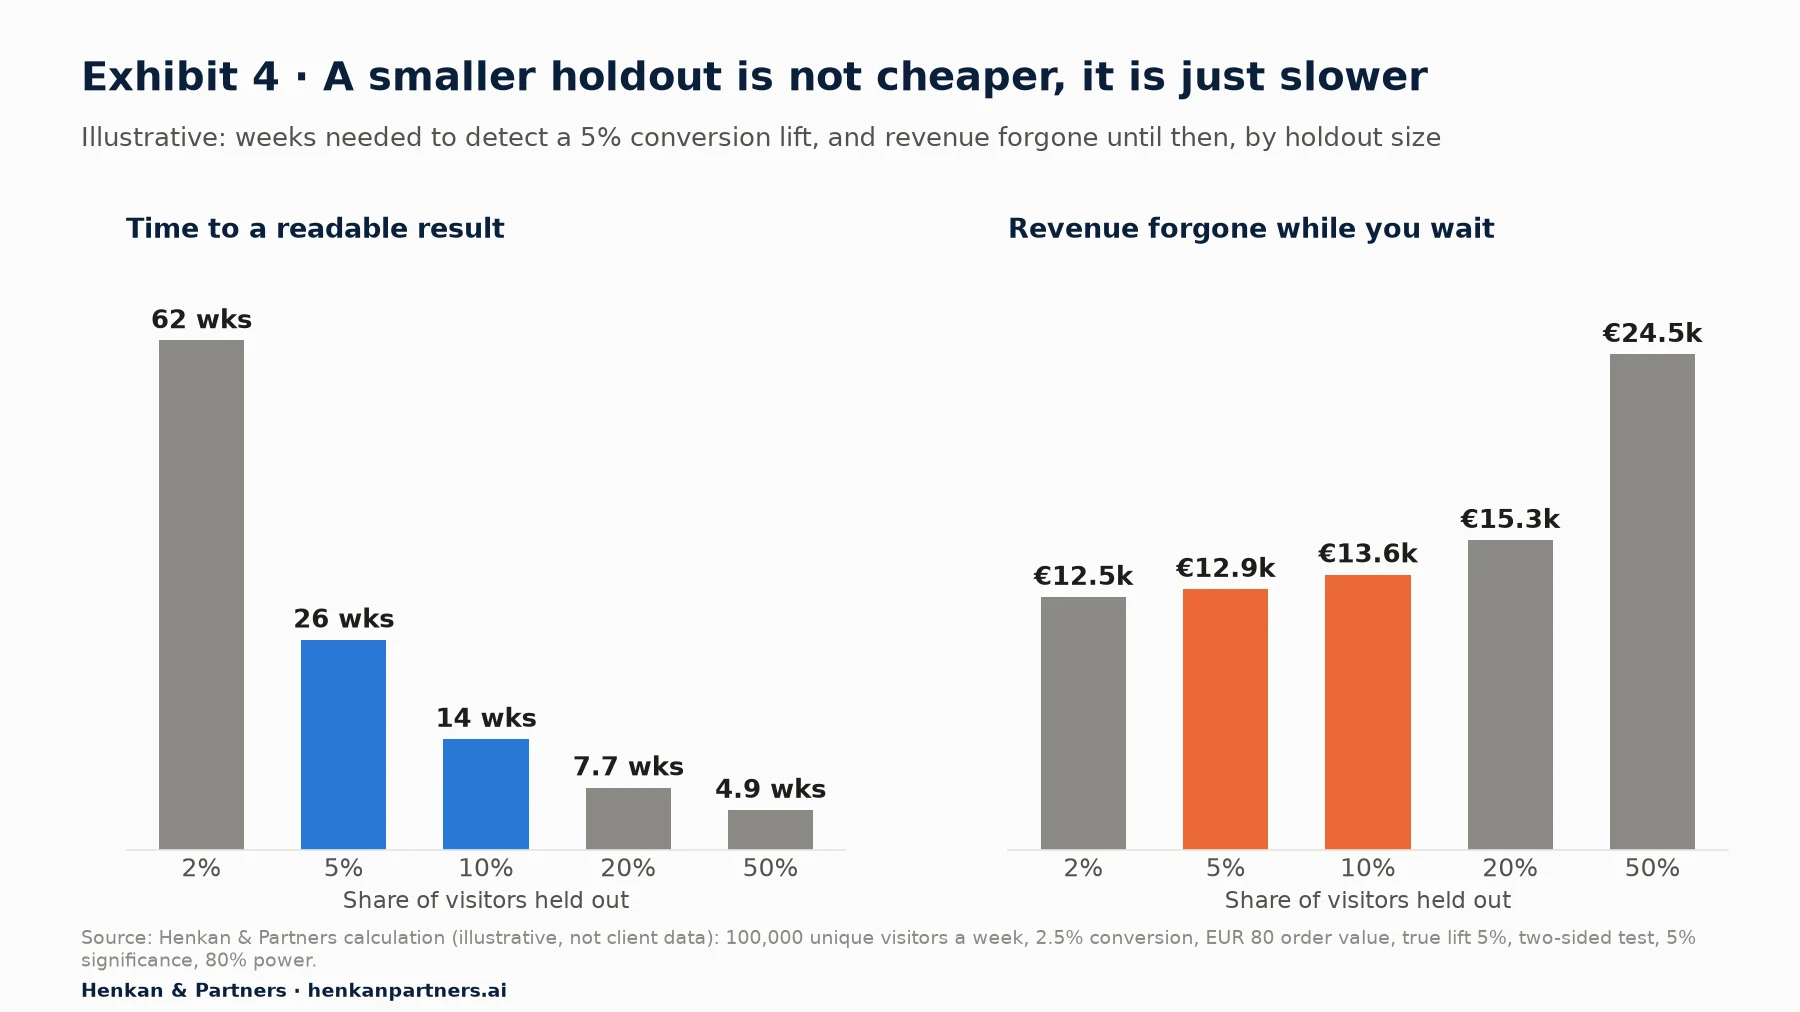
What this shows. The cost of learning is roughly fixed: a smaller holdout loses less revenue per week but needs proportionally more weeks. Below about 5%, you pay nearly the same price for an answer that arrives too late to act on. Above about 20%, the cost rises quickly because you are withholding a proven benefit from a large group.
Two further consequences follow from the same arithmetic. First, if you keep a 5% holdout for a quarter (13 weeks), the smallest lift you can reliably detect in this example is about 7% rather than 5%; with 10%, it is about 5%. Second, once the result is in, keeping the holdout running is an ongoing cost (EUR 500 a week at 5% here) that you pay for monitoring, not for learning. Many teams choose to reset the holdout each quarter or half-year, which also keeps the control group representative of the current customer base.
Revenue metrics need more traffic than conversion rate. Randall Lewis and Justin Rao's study of 25 large advertising field experiments with US retailers and brokerages found that "the standard deviation of individual-level sales is typically 10 times the mean", which is why their median confidence interval on ROI was more than 100 percentage points wide. Expect revenue per visitor to need considerably more traffic than conversion rate, and consider capping extreme orders before analysis.
What the vendors recommend
Vendor guidance clusters between 5% and 10%, which matches the arithmetic above for mid-sized and large sites.
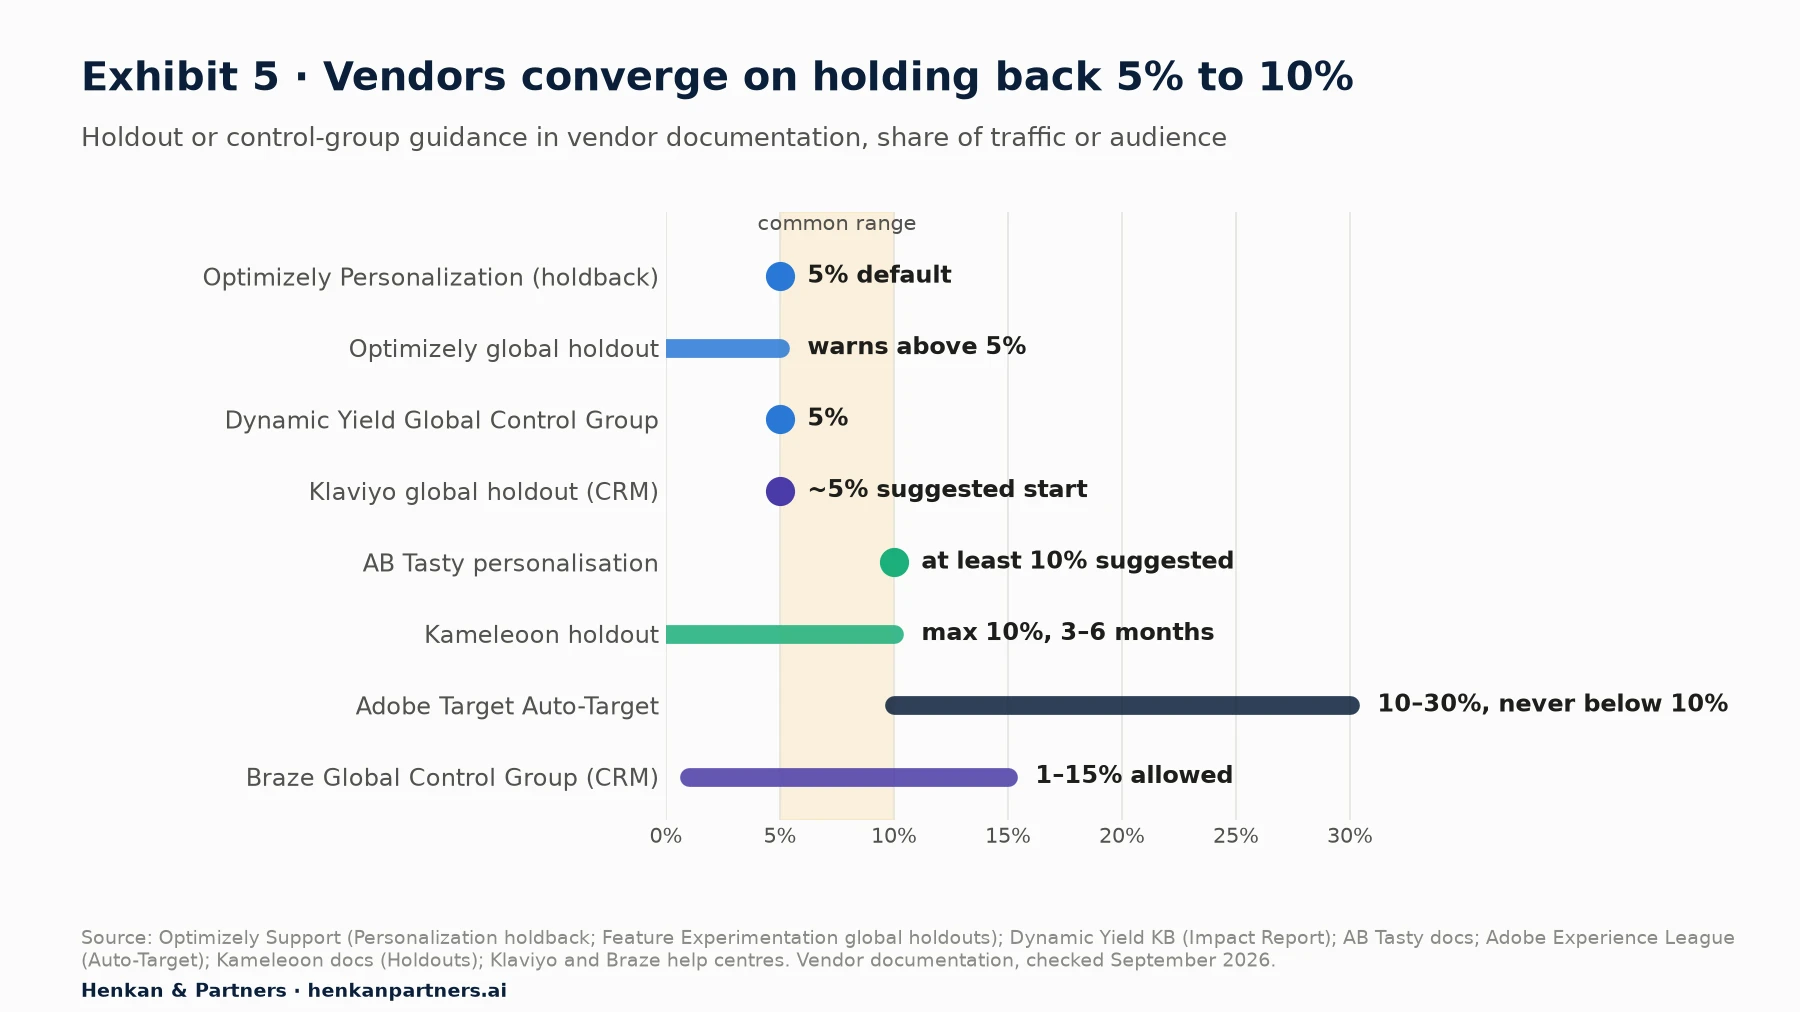
What this shows. The differences reflect different jobs. A programme-wide holdout (Optimizely, Dynamic Yield, Kameleoon) can be small because it pools all traffic. A control inside a single AI-driven activity (Adobe Target Auto-Target) is larger; Adobe recommends a 50/50 split when the goal is to measure the algorithm's lift accurately. CRM holdouts (Klaviyo, Braze) are sized on profiles rather than sessions.
For marketers. Pick 5% if your site has millions of visitors a month and you can wait a quarter; pick 10% if you have fewer or need an answer sooner. Write the holdout size, start date and review date into your programme plan.
For leaders. A holdout is a modest insurance premium, about EUR 13,000 in our example, against spending hundreds of thousands a year on a programme you cannot prove. Protect it from being switched off when a campaign manager wants "more reach".
Section 5 · Incrementality and lift
Report lift on the whole business, because a big lift on a small segment is a small lift overall
Lift is the relative difference between treated and control: (treated − control) / control. Incremental revenue converts that lift into money. Both are straightforward, but three habits distort them in practice.
Lift = (Metric_treated − Metric_control) / Metric_control

Incremental revenue = (RPV_treated − RPV_control) × Visitors_treated

Site-wide lift ≈ Segment lift × Share of revenue from the treated segment

RPV = revenue per visitor (or per customer, for user-level holdouts)
Habit 1: quoting segment lift as if it were site lift
Illustrative example: a personalised experience for returning visitors who browsed a category lifts their conversion by 10%. If those visitors generate 20% of online revenue, the site-wide effect is about 2%, not 10%. Both numbers are true; only one belongs in a board deck. Always convert segment lift into business lift before you compare it with costs.
Habit 2: measuring per session when the effect is per customer
Personalisation often changes when, not only whether, people buy. A recommendation that brings a purchase forward from next week to today looks like a win in a session-level test and a wash over a month. User-level holdouts, read over weeks rather than days, capture this timing effect; session-level metrics do not.
Habit 3: reporting the point estimate without the uncertainty
A 4% lift with a confidence interval from −1% to +9% is not a 4% lift; it is "somewhere between nothing and a lot". Report the interval, and in the P&L use the lower end or a conservative central estimate. Our conversion rate optimization guide covers how to present uncertain results to decision-makers without losing them.
Section 6 · Programme-level measurement
Winning tests do not add up, so measure the programme as a whole
If you ran ten personalisation tests this year and each showed a 1% lift, the tempting conclusion is a 10% lift. It is almost never true, for four reasons.
- Cannibalisation. Several experiences often chase the same purchase. Disney Streaming's universal holdout pilot found that "the engagement-driving impacts of one feature often partially cannibalize the impacts of another feature", so the cumulative impact was less than the sum of individual effects. Etsy reached the same general conclusion in 2022: the effect of the combined treatment "is generally not equal to the sum of the individual effects".
- Winner's curse. When you ship only the tests that looked best, the ones that got lucky are over-represented. Their measured lifts are, on average, higher than their true lifts.
- False positives. At 5% significance, roughly one test in twenty with no true effect will still look like a winner. Across a large programme, some of your wins are noise.
- Decay. Some effects fade after launch as novelty wears off or as the audience changes (Section 7).
The programme holdout is the correction. It measures what all shipped experiences deliver together, today, against a control that never saw any of them. Disney sized its holdout to detect a 1% change in hours watched per subscriber, reset it every quarter, and followed each three-month enrolment period with a one-month evaluation. That structure translates well to e-commerce: a quarterly holdout read against revenue per customer and gross margin.
Interaction effects between experiences are rarer than teams fear
An interaction effect occurs when two experiences shown to the same person perform differently together than apart; for example, a personalised hero banner and a personalised pop-up that promote conflicting offers. Teams often worry about this and run experiences in isolation, which slows the programme down.
The evidence suggests most of this worry is unnecessary for ordinary tests. Monwhea Jeng of Microsoft's Experimentation Platform analysed hundreds of thousands of combinations of concurrent A/B test pairs and metrics across four major products in 2023. Three products showed results consistent with no interactions at all; in the fourth, interactions were detected in 0.002% of test-pair metrics, about 1 in 50,000, and there were no cases of two significant effects moving in opposite directions.
Our rule of thumb: run personalisation tests concurrently by default, but isolate experiences that touch the same page area, the same offer or the same customer decision. For these, use mutually exclusive groups or test them together as a combined variant. The programme holdout will catch what you miss.
Section 7 · Novelty and decay
Early results are often inflated, so give personalisation time to settle
A novelty effect is a temporary lift that appears because something is new, then fades as people get used to it. The opposite, a primacy effect, is a temporary dip because people are used to the old version. Both are forms of user learning: the treatment effect changes over time as customers adapt.
One of the best-documented measurements of this comes from Google. Henning Hohnhold, Deirdre O'Brien and Diane Tang (KDD 2015) measured how users' propensity to click on ads changed with the quality of ads they had seen. They estimated the learning effect had a half-life of about 60 days, used 90-day experiments as their standard, and noted that a 90-day study captures roughly 65% of the ultimate learning effect. The same work led Google to cut the ad load on mobile search by 50%: a change that was negative for revenue in the short term, but neutral in the long term once user learning was taken into account.
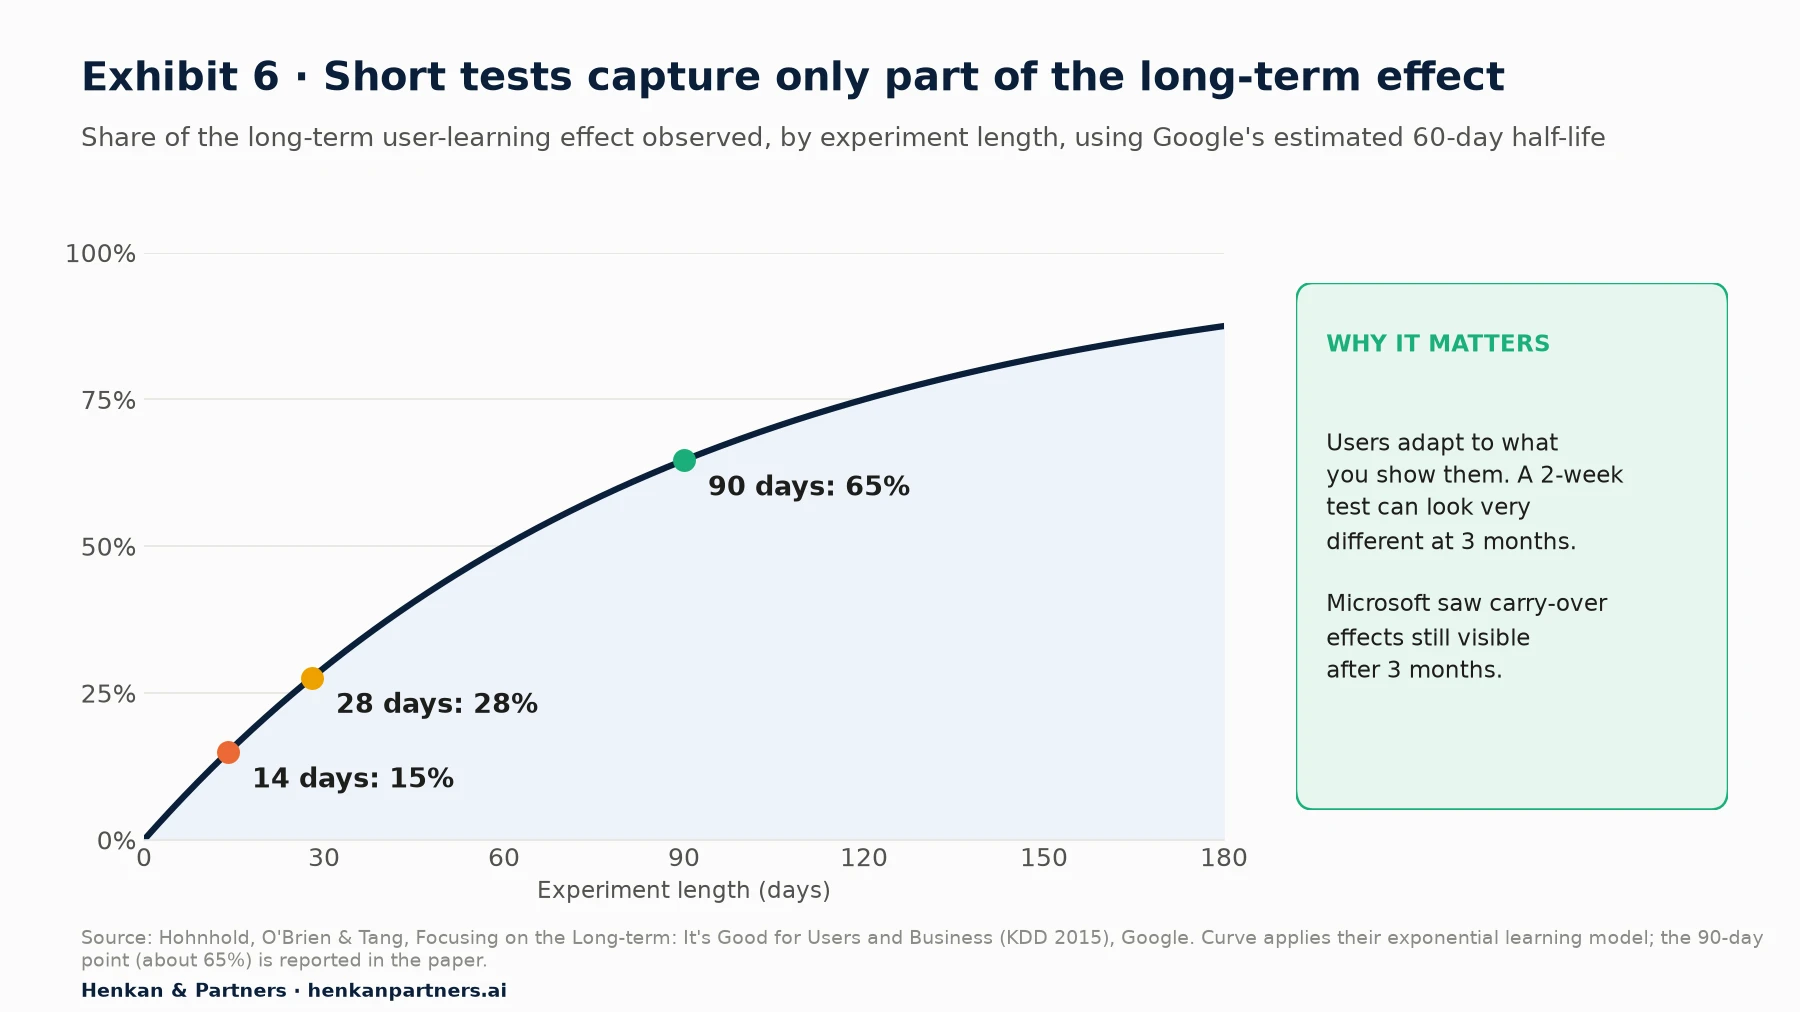
What this shows. Your customers will not learn at exactly Google's rate, and many personalisation effects are immediate. The point is directional: a two-week test tells you the short-term effect, not the long-term one. Use the programme holdout, read over months, to see where each shipped experience settles.
Two cautions balance this. First, Ron Kohavi and colleagues at Microsoft found that "most cases of suspected Primacy and Novelty effects are not real, but just a statistical artifact": early daily results are noisy and tend to look like a trend. Do not stop or extend a test because the first few days look different. Second, the same Microsoft paper documented carry-over effects, where users exposed to a poor experience still had not fully recovered after three months. A bad personalisation can harm the relationship longer than the test lasts.
Practical rules we apply:
- Run every personalisation test for at least two full weekly cycles, and plot the daily lift to spot a clear downward trend.
- For experiences that rely on surprise (countdown timers, "you might also like" pop-ups, gamified offers), keep a small per-experience holdback running after launch and re-read it after a quarter.
- Expect recommendations and relevance-based content to hold up better than urgency and scarcity devices, and check that expectation with data rather than assuming it.
Section 8 · Guardrails
Guardrail metrics stop personalisation from buying revenue it cannot keep
A guardrail metric is a metric you do not try to improve but refuse to let worsen. Kohavi, Tang and Xu's Trustworthy Online Controlled Experiments (Cambridge University Press, 2020) discusses them at length. For personalisation, guardrails matter more than usual, because the easiest way to lift conversion is to discount, to push cheaper products or to message more often, and each of these has a cost that the primary metric hides.
| Guardrail | What can go wrong | How to measure |
|---|---|---|
| Gross margin per visitor | Personalised offers or recommendations shift the mix towards discounted or low-margin products | Margin from order lines, compared between treated and holdout |
| Return rate | Recommendations or urgency drive purchases customers later send back | Returns joined to orders, with a lag of 30 to 60 days |
| Discount and voucher cost | Targeted codes go to people who would have paid full price | Voucher cost per order in treated vs holdout |
| Unsubscribes and spam complaints | More frequent, more personalised messages tire the audience | Opt-out rate per message and per profile, CRM holdout vs treated |
| Page speed | Client-side personalisation adds scripts and flicker | Largest Contentful Paint and time to first render by group |
| Sample ratio mismatch | The split is not what you configured, so the result cannot be trusted | Chi-squared test on group sizes, checked daily |
| Customer service contacts | Confusing or inconsistent offers generate complaints | Contacts per 1,000 orders by group |
Set a threshold for each guardrail before the test starts, for example "gross margin per visitor must not fall by more than 1%". A test that wins on revenue but breaches a guardrail is a failed test until someone explicitly accepts the trade-off. This is where personalisation measurement meets experimentation culture: the rule only works if leaders enforce it when the headline number is attractive.
Section 9 · The personalisation P&L
Build a personalisation P&L, because ROI needs costs as well as benefits
Most personalisation business cases list the benefits in detail and the costs in a footnote. A personalisation P&L puts both on one page and uses only incremental numbers on the benefit side. It is the document that lets a CFO compare personalisation with any other investment.
The benefit side: incremental margin, not revenue
- Start from the programme holdout. Take the measured lift in revenue per visitor or per customer, with its confidence interval, and apply it to the treated population for the period.
- Convert revenue into gross margin. Subtract cost of goods, the incremental discount and voucher cost, and returns. Use the treated group's actual margin mix, not the site average, because personalisation can change the mix.
- Add retained value carefully. If a long-term holdout shows higher repeat purchase, include it; if you only have a short-term test, do not extrapolate a lifetime value.
The cost side: everything it takes to run the programme
- Tooling: personalisation, recommendation, testing and customer data platform licences, including overage for impressions or profiles.
- Content and creative: every segment needs its own banners, copy, product selections and translations; this cost grows with the number of segments.
- Engineering and QA: implementation, data feeds, integrations, performance work and testing across devices.
- Analytics and programme management: test design, analysis, reporting and the holdout itself.
- Opportunity cost of the holdout: the revenue forgone in the control group (Section 4).
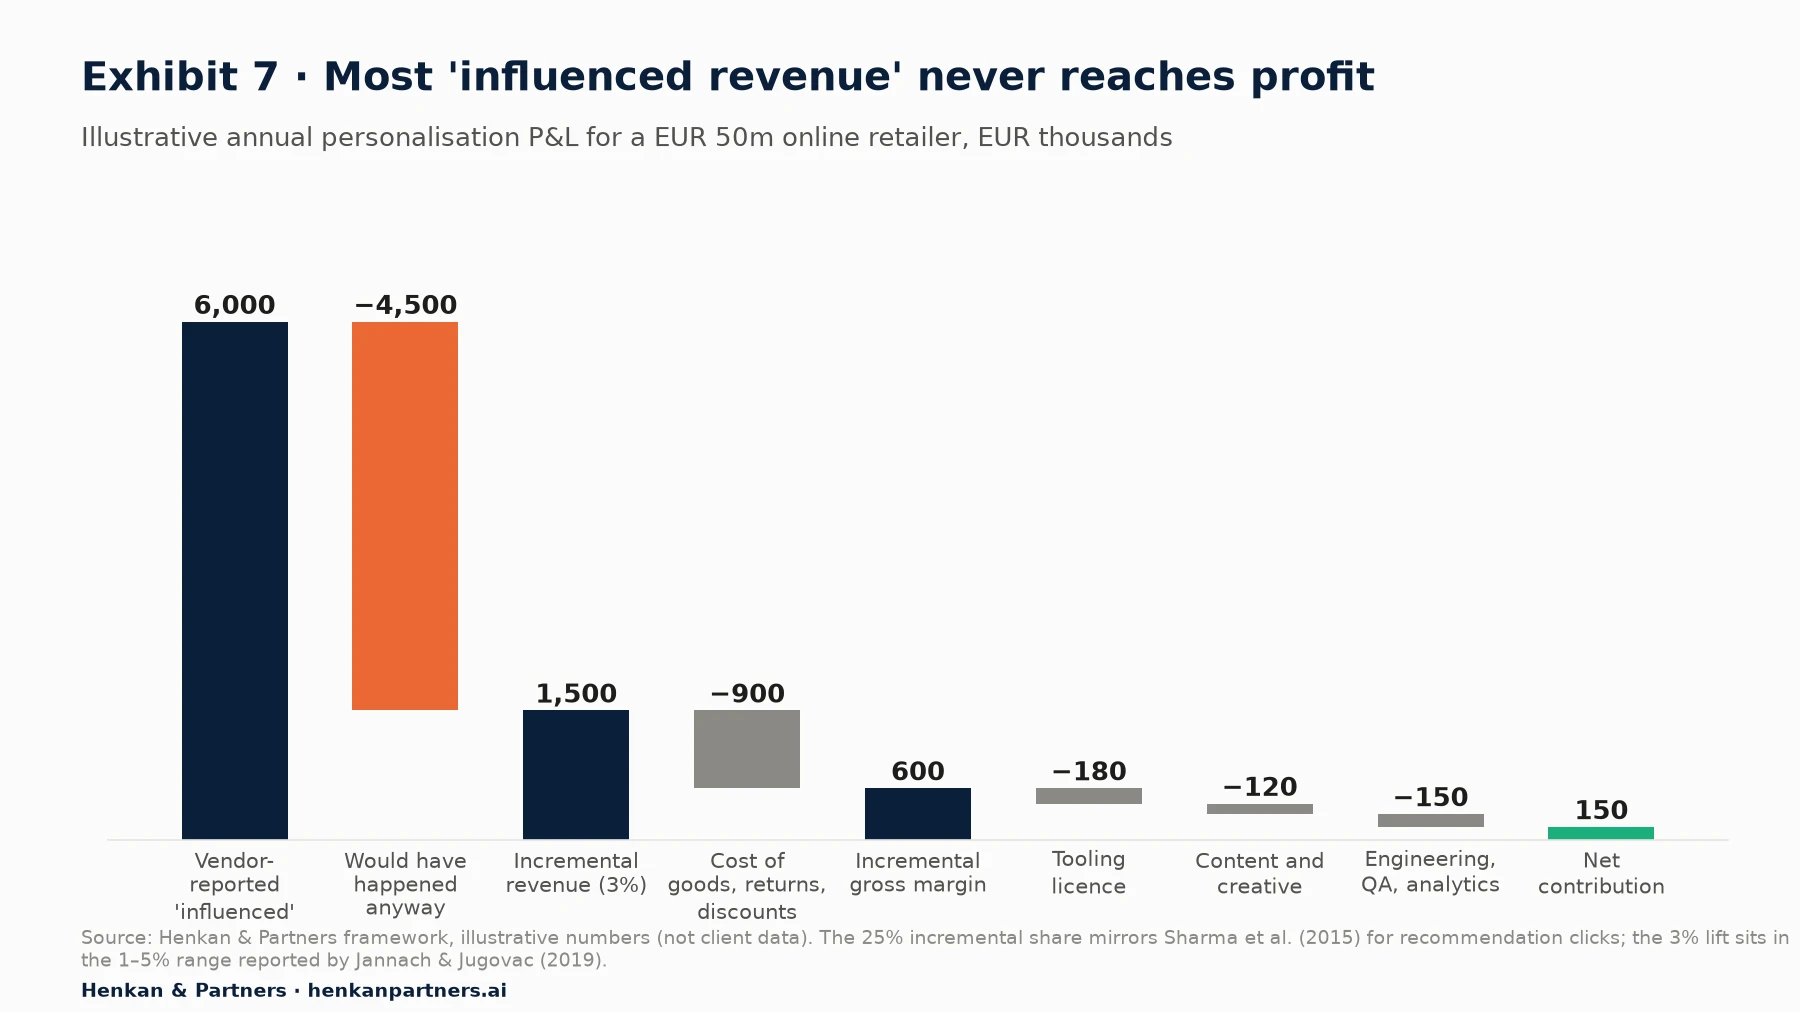
What this shows. The programme in this example is profitable, returning about EUR 1.33 for every euro of cost, but only just. The same programme reported on influenced revenue looks thirteen times its cost. Once measured incrementally, the levers become clear: raise the lift with better experiences, protect margin with guardrails, and cut content cost by personalising fewer, larger segments.
Personalisation ROI = (Incremental gross margin − Programme costs) / Programme costs

Illustrative example: (600 − 450) / 450 = 33%

Payback (months) = Upfront costs / Monthly net contribution
A P&L also changes the conversation about scope. In our experience, a small number of experiences on high-traffic pages (homepage, category listings, product pages, basket) and in lifecycle emails produce most of the incremental margin, while a long tail of niche segments consumes most of the content budget. The holdout will not tell you which is which; the per-experience tests and a cost line per experience will.
For leaders. Ask for the personalisation P&L quarterly, in the same format each time, with the holdout lift and its confidence interval at the top. If the net contribution is negative for two quarters in a row, simplify the programme before adding tools.
For marketers. Track content hours per segment. It is the cost line most often missing, and the one most under your control.
Section 10 · Tools and AI
Every major platform now supports holdouts, so the gap is process, not tooling
We checked the current documentation of the main testing, personalisation and CRM platforms in September 2026. All of them support some form of control group; they differ in scope (one campaign or the whole programme) and in defaults.
| Platform | Holdout capability | Default or guidance |
|---|---|---|
| Optimizely | Personalization: one holdback per campaign. Feature Experimentation: native global holdouts across a project; cannot be paused, only concluded | 5% holdback by default; global holdout warns above 5% |
| Dynamic Yield | Global Control Group excluded from Dynamic Yield experiences; Impact Report computes uplift as the ratio of the experiences group to the control, minus 1 | 5% control, 95% experiences |
| Adobe Target | Auto-Target and Automated Personalization: random control or a specific experience as control | 10% to 30% control advised; Auto-Target control cannot go below 10%; 50/50 to evaluate the algorithm |
| AB Tasty | Per-campaign traffic allocation for personalisations; no global holdout described in the documentation we reviewed | At least 10% on the original version recommended |
| Kameleoon | Holdout experiences that see no experiments; personalisation reports compare exposed and non-exposed targeted visitors | Maximum 10% of traffic, typically for three to six months |
| Klaviyo | Global holdout groups withheld from campaigns and flows (transactional messages still sent); one active group at a time | About 5% suggested; run for 3 months; requires at least 400,000 profiles |
| Braze | Global Control Group excluded from campaigns and Canvases, with a report against a random treatment sample of similar size | 1% to 15%; reshuffle no more than once a month; read over at least a month |
Two practical gaps remain. First, holdouts are usually per tool. If your on-site personalisation runs in one platform and your emails in another, a customer can be held out of one and not the other. For a true programme-level read, assign the holdout once, at customer level, in your customer data platform or data warehouse, and pass the flag to every tool. Second, most vendor impact reports still lead with attributed revenue. Configure the holdout report as the default view, and label attributed figures clearly as "attributed, not incremental".
AI decisioning makes holdouts more important, not less
AI-driven personalisation (contextual bandits, predictive targeting, generated content) chooses experiences per visitor, which makes per-experience A/B tests harder and programme holdouts essential. The platforms reflect this: Adobe's Auto-Target requires a control of at least 10%, against which the lift of the personalised traffic is measured. When an AI system both decides what to show and reports its own uplift, an independent, randomised control is the only check on the model's claims.
AI agents are also starting to read and act on experiment data directly. Statsig's MCP server (Model Context Protocol, a standard way for AI assistants to connect to tools) lets an agent explore experiments, metrics and results, and with the right permissions create or modify resources. This is useful for monitoring a holdout or drafting the quarterly P&L. It also raises the stakes on definitions: an agent that summarises "personalisation revenue" will pick up attributed figures unless you give it the holdout metric explicitly and restrict what it can change.
Disclosure: Henkan & Partners designs, implements and measures personalisation programmes for clients, including on some of the platforms named in this article.
Section 11 · What to do next
What to do next
1. Audit the numbers you report today
List every personalisation and CRM revenue figure that reaches a management report. For each one, write down the tool, the attribution window and whether it is attributed, influenced or incremental. Remove any sum of attributed figures across tools.
2. Start a programme holdout this quarter
Choose 5% or 10% using the arithmetic in Section 4, assign it at customer level if you can, and record the start date, size and review date. Agree with finance that the holdout result, not the dashboard, will be the reference figure.
3. Add guardrails to every personalisation test
Add gross margin per visitor, return rate and, for CRM, unsubscribe rate as standard guardrails, with thresholds set before launch. Check for sample ratio mismatch daily.
4. Build the first personalisation P&L
Use the template in Section 9. Include all costs, especially content hours, and use the lower bound of the holdout lift. Review it quarterly with the same people each time.
5. Simplify before you scale
Rank experiences by incremental margin and by cost. Retire the ones that cannot show a lift after a fair test, and put the effort into the few pages and journeys that drive the result. When you are ready for an independent read of your programme, talk to us.
FAQ
Frequently asked questions about personalization ROI
Frequently asked questions
What is personalization ROI?
Personalization ROI is the incremental profit created by personalised experiences, measured against a randomised control group that sees the default experience, divided by the full cost of the programme (tooling, content, engineering and analytics). It excludes revenue that would have happened without personalisation.
How do you measure the ROI of personalization?
Run an A/B test for each personalised experience, keep a global holdout group (typically 5% to 10% of visitors or customers) that sees no personalisation, compare revenue per visitor and gross margin between the two groups, and subtract programme costs. Attributed revenue from vendor dashboards should not be used for ROI.
What is a global control group in personalization?
A global control group, or universal holdout, is a random share of users who are excluded from all personalisation campaigns for a set period. Comparing them with everyone else measures the combined effect of the whole programme, including interactions and long-term effects that individual tests miss.
How big should a holdout group be?
Most vendors recommend 5% to 10%. The right size depends on traffic and the smallest lift you need to detect. In our illustrative example of 100,000 visitors a week at 2.5% conversion, detecting a 5% lift takes about 26 weeks with a 5% holdout and 14 weeks with 10%, for roughly the same total revenue forgone.
How long should a personalization holdout run?
Usually at least a quarter. Klaviyo recommends three months for CRM holdouts, Kameleoon suggests three to six months, and Disney Streaming reset its universal holdout every quarter. Shorter reads miss slow effects: Google estimated a 60-day half-life for user learning in its ad experiments.
Why is vendor-reported personalization revenue so high?
Because it counts every purchase that follows a click or exposure within an attribution window, including purchases customers would have made anyway. Research on Amazon recommendations estimated that at least 75% of recommendation click-throughs would likely have happened without the recommendation.
What is the difference between attributed and incremental revenue?
Attributed revenue is credited to a touchpoint because a purchase followed it within a time window. Incremental revenue is the difference between a treated group and a randomised control group. Only incremental revenue measures what personalisation caused.
What revenue lift can personalization deliver?
McKinsey reports that personalisation most often drives a 10% to 15% revenue lift, with company-specific results from 5% to 25% depending on sector and execution. Field tests of recommender systems that measure sales directly typically report increases of 1% to 5%. Measure your own lift with a holdout rather than relying on either range.
Which guardrail metrics should personalization tests use?
Gross margin per visitor, return rate, discount and voucher cost, unsubscribe and complaint rates for CRM, page speed, sample ratio mismatch and customer service contacts. Set a threshold for each before the test starts.
Key terms
- Attributed revenue
- Revenue a tool credits to itself because a purchase followed a click or open within a set window. It matters because it measures association, not cause, and usually overstates impact.
- Attribution window
- The period after a touchpoint during which a purchase is credited to it, from 30 minutes to 30 days depending on the vendor. It matters because changing the window changes reported revenue without changing reality.
- Carry-over effect
- A lasting effect of a past experiment on the users who were in it. It matters because a poor personalised experience can harm behaviour for months after the test ends.
- Counterfactual
- What would have happened to the same customers without the intervention. It matters because ROI is always a comparison with a counterfactual, estimated with a randomised control.
- Global control group (universal holdout)
- A random share of users excluded from all personalisation for a period. It matters because it is the only way to measure the combined value of the whole programme.
- Guardrail metric
- A metric you do not aim to improve but will not allow to worsen, such as margin or return rate. It matters because it stops personalisation from buying revenue it cannot keep.
- Incrementality
- The part of an outcome that would not have happened without the intervention. It matters because it is the only basis for an honest ROI.
- Influenced revenue
- Revenue from any order where the customer was exposed to a personalised element, whether or not they engaged with it. It matters because it measures reach, not effect.
- Interaction effect
- When two experiences perform differently together than apart. It matters because conflicting experiences can cancel out, although evidence from Microsoft shows interactions are rare.
- Lift
- The relative difference between treated and control groups on a metric. It matters because segment lift must be converted into site-wide lift before it is compared with costs.
- Minimum detectable effect (MDE)
- The smallest true lift a test can reliably detect with the planned sample. It matters because a small holdout run for a short time cannot see small effects.
- Novelty effect
- A temporary lift caused by something being new, which fades as users adapt. It matters because short tests can overstate long-term value.
- Personalisation P&L
- A profit-and-loss view of the programme with incremental margin on one side and all costs on the other. It matters because it lets leaders compare personalisation with any other investment.
- Selection bias
- Distortion that arises when the people who receive or engage with a treatment differ from those who do not. It matters because clickers were already more likely to buy.
- Triggering
- Including users in an analysis only from the point where control and treatment differ. It matters because it removes dilution and increases statistical power.
Sources
All sources were checked in September 2026. Figures from Optimizely, Dynamic Yield, Adobe, AB Tasty, Kameleoon, Klaviyo, Braze, Nosto and Statsig come from their own product documentation (vendor data) and describe product defaults, not independent benchmarks. Exhibits 3, 4 and 7 and the worked examples are Henkan & Partners frameworks or illustrative calculations, not client data. Exhibit 6 applies the exponential learning model and 60-day half-life reported by Hohnhold, O'Brien and Tang.
- McKinsey & Company (2021). The value of getting personalization right—or wrong—is multiplying.
- Sharma, Hofman & Watts, ACM EC (2015). Estimating the Causal Impact of Recommendation Systems from Observational Data.
- Jannach & Jugovac, ACM TMIS (2019). Measuring the Business Value of Recommender Systems.
- Blake, Nosko & Tadelis, Econometrica (2015). Consumer Heterogeneity and Paid Search Effectiveness: A Large-Scale Field Experiment.
- Gordon, Zettelmeyer, Bhargava & Chapsky, Marketing Science (2019). A Comparison of Approaches to Advertising Measurement: Evidence from Big Field Experiments at Facebook.
- Lewis & Rao, Quarterly Journal of Economics (2015). The Unfavorable Economics of Measuring the Returns to Advertising.
- Hohnhold, O'Brien & Tang, KDD (2015). Focusing on the Long-term: It's Good for Users and Business.
- Kohavi, Deng, Frasca, Longbotham, Walker & Xu, KDD (2012). Trustworthy Online Controlled Experiments: Five Puzzling Outcomes Explained.
- Sadeghi et al., arXiv (2021). Novelty and Primacy: A Long-Term Estimator for Online Experiments.
- Kohavi, Tang & Xu, Cambridge University Press (2020). Trustworthy Online Controlled Experiments: A Practical Guide to A/B Testing.
- Jeng, Microsoft Research (2023). A/B Interactions: A Call to Relax.
- Yang & Daniels, Disney Streaming (2021). Universal Holdout Groups at Disney Streaming.
- Shao & Burke, Etsy Engineering (2022). Understanding the collective impact of experiments.
- Optimizely Support (2026). Holdback: Measure overall impact in Personalization.
- Optimizely Support (2026). Native global holdouts in Feature Experimentation.
- Dynamic Yield Knowledge Base (2026). Experience OS Impact Report.
- Dynamic Yield Knowledge Base (2026). Recommendation Report.
- Adobe Experience League (2026). What is an Auto-Target activity?.
- Adobe Experience League (2026). How can I use a specific experience as control in an Automated Personalization activity?.
- AB Tasty Documentation (2026). Campaign flow: Traffic Allocation step.
- Kameleoon Documentation (2026). Create reliable baselines with Holdouts.
- Klaviyo Help Center (2026). Getting started with global holdout groups.
- Klaviyo Help Center (2026). Understanding Klaviyo message attribution.
- Braze Documentation (2026). Global Control Group.
- Nosto Help Center (2026). Conversion attribution and definition.
- Statsig Docs (2026). Statsig MCP Server overview.