Focus
Segments, Bandits or A/B Tests? How to Personalise E-commerce with Evidence
Alexandre Suon · 2026-09-28
E-commerce personalisation starts with customer segmentation, but a segment only deserves its own experience if you can prove the difference pays. This guide explains the four ways to segment shoppers (rules, RFM, behavioural intent and predictive models), how to decide which segments are worth it, and when to prove the result with an A/B test and a holdout, a multi-armed bandit or a contextual bandit. It includes an illustrative simulation of multi-armed bandit vs A/B testing, the pitfalls that create false wins, and what the main testing and personalisation tools actually offer.
Executive summary
- Segmentation decides who gets what; experiments decide whether it worked. Personalisation is two jobs: choosing the groups that should see something different, and proving that the difference adds revenue. Most programmes invest in the first and skimp on the second.
- There are four ways to segment, and each needs more data than the last. Rules (country, device, new or returning) need almost none. RFM scores past orders. Behavioural and intent segments react to what the visitor does now. Predictive segments rely on models that vendors only switch on above a threshold, such as 500 customers with orders and 180 days of history in Klaviyo, or 1,000 buyers and 1,000 non-buyers in Google Analytics 4.
- A segment deserves its own experience only if it is big, different, actionable and measurable. A segment converting at 3% needs about 52,000 visitors per variant to detect a 10% lift. With 10,000 visitors a week, that is roughly ten weeks. Many attractive segments are simply too small to prove anything on their own.
- A/B tests with planned segment analysis and a holdout remain the most trustworthy proof. Decide which segments you will analyse before the test, correct for the number of segments you look at, and keep a small global control group (Dynamic Yield and Optimizely both work with 5%) to measure the cumulative effect of all personalisation.
- Bandits trade evidence for earnings. In our illustrative simulation of 150,000 visitors, Thompson sampling gave up 96 conversions against a perfect choice, versus 225 for an equal-split A/B test, but its chance of confirming the winner fell from 78% to 59% and the uncertainty on the lift grew by half. Use bandits for short-lived decisions such as promotions and headlines, not for decisions you need to defend.
- Contextual bandits personalise automatically, but only with traffic, clean data and a holdback. Optimizely, Adobe Target, Kameleoon and Statsig all offer per-visitor models; Kameleoon waits for 100,000 visits and 7 days, and Adobe recommends keeping 10% of traffic as control for always-on activities. Watch for novelty effects, Simpson's paradox when allocation changes and biased estimates from adaptively collected data.
Section 1 · Definitions
Personalisation is two decisions: who should see something different, and whether it pays
E-commerce customer segmentation is the practice of dividing shoppers into groups that behave differently, such as first-time visitors, loyal customers or people browsing a single category, so that each group can be given a more relevant experience. Personalisation testing is the use of controlled experiments (A/B tests, holdouts or bandit algorithms) to prove that the experience shown to a segment produces more value than the default.
Personalisation means showing different products, content, messages or offers to different people. Our Essential Guide to Personalisation covers what to personalise and how to launch a programme, and the Essential Guide to Web Personalisation covers on-site execution. This article goes one level deeper into the two decisions every personalisation programme has to make, again and again.
The first decision is who. You need segments that are meaningfully different and large enough to act on. The second decision is whether it worked. You need a method that separates the effect of the personalised experience from everything else that changes at the same time: seasonality, campaigns, price changes and the simple fact that loyal customers buy more whatever you show them.
Three families of methods answer the second question:
- A/B tests split traffic randomly and in fixed proportions between a control and one or more variants, then compare outcomes. They are the reference method for causal proof. Our Essential Guide to A/B Testing covers the basics.
- Multi-armed bandits also randomise, but shift traffic towards the variant that is performing best as data comes in. They find one winner for everyone and lose fewer conversions along the way.
- Contextual bandits go further: they learn which variant works best for each visitor, based on attributes such as device, location or behaviour. They are, in effect, automated segmentation and testing in one model.
These methods are not rivals. They answer different questions, at different costs, and a mature programme uses all three. The rest of this article explains how to choose.
Section 2 · Why it matters
Customers expect relevance, but the revenue only appears if you measure it properly
Demand for personalisation is well documented. In McKinsey's Next in Personalization 2021 research, 71% of consumers said they expect companies to deliver personalised interactions, and 76% said they get frustrated when this does not happen. McKinsey also found that personalisation typically drives a 10–15% revenue lift, with a range of 5–25% depending on sector and execution, and that fast-growing companies derive 40% more of their revenue from personalisation than their peers.
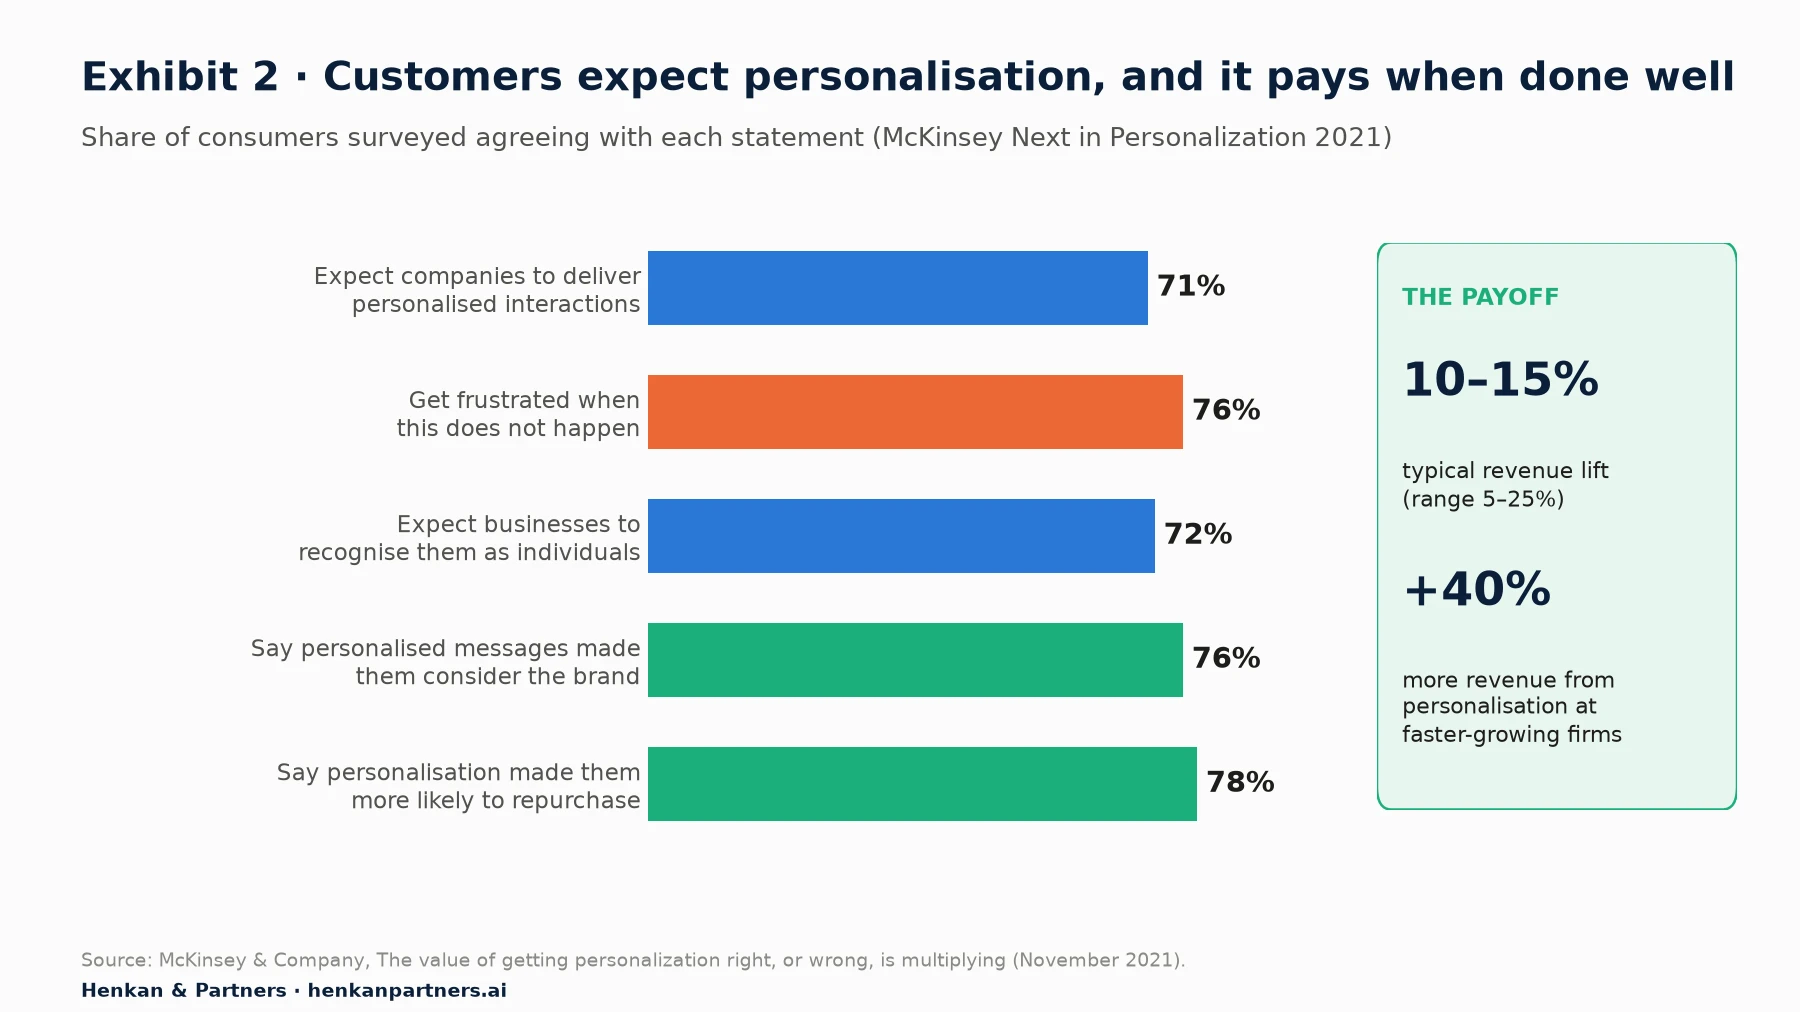
What this shows. Expectations are high and broadly shared, and the revenue upside is real for companies that execute well. But these are survey answers and cross-company comparisons, not controlled experiments on your site. They justify investing in personalisation; they do not tell you whether a given segment or experience works for you.
That gap matters because personalisation is unusually easy to over-credit. Segments are defined by behaviour, and behaviour predicts purchase. If you show a special banner to returning customers who have bought three times, they will convert well whatever the banner says. Reporting that "the loyalty banner generated €400,000" (an illustrative figure) confuses the audience with the treatment. As we explain in the personalisation guide, attributed revenue flatters personalisation; only a comparison against a randomly selected control group shows the true increment.
For marketers. Before you celebrate a personalised campaign, ask one question: compared with what? If the answer is not "a random group of the same audience who saw the default", the number is a correlation, not a result.
For leaders. Ask your team for the incremental revenue of personalisation measured against a holdout, not the revenue of personalised sessions. The two numbers can differ widely.
Section 3 · Segmentation methods
There are four ways to segment e-commerce customers, and each one needs more data than the last
Most e-commerce segmentation falls into four families. They are not stages you must climb in order, but each adds data requirements and operational complexity. The right choice depends on what you want to change and what data you actually have.
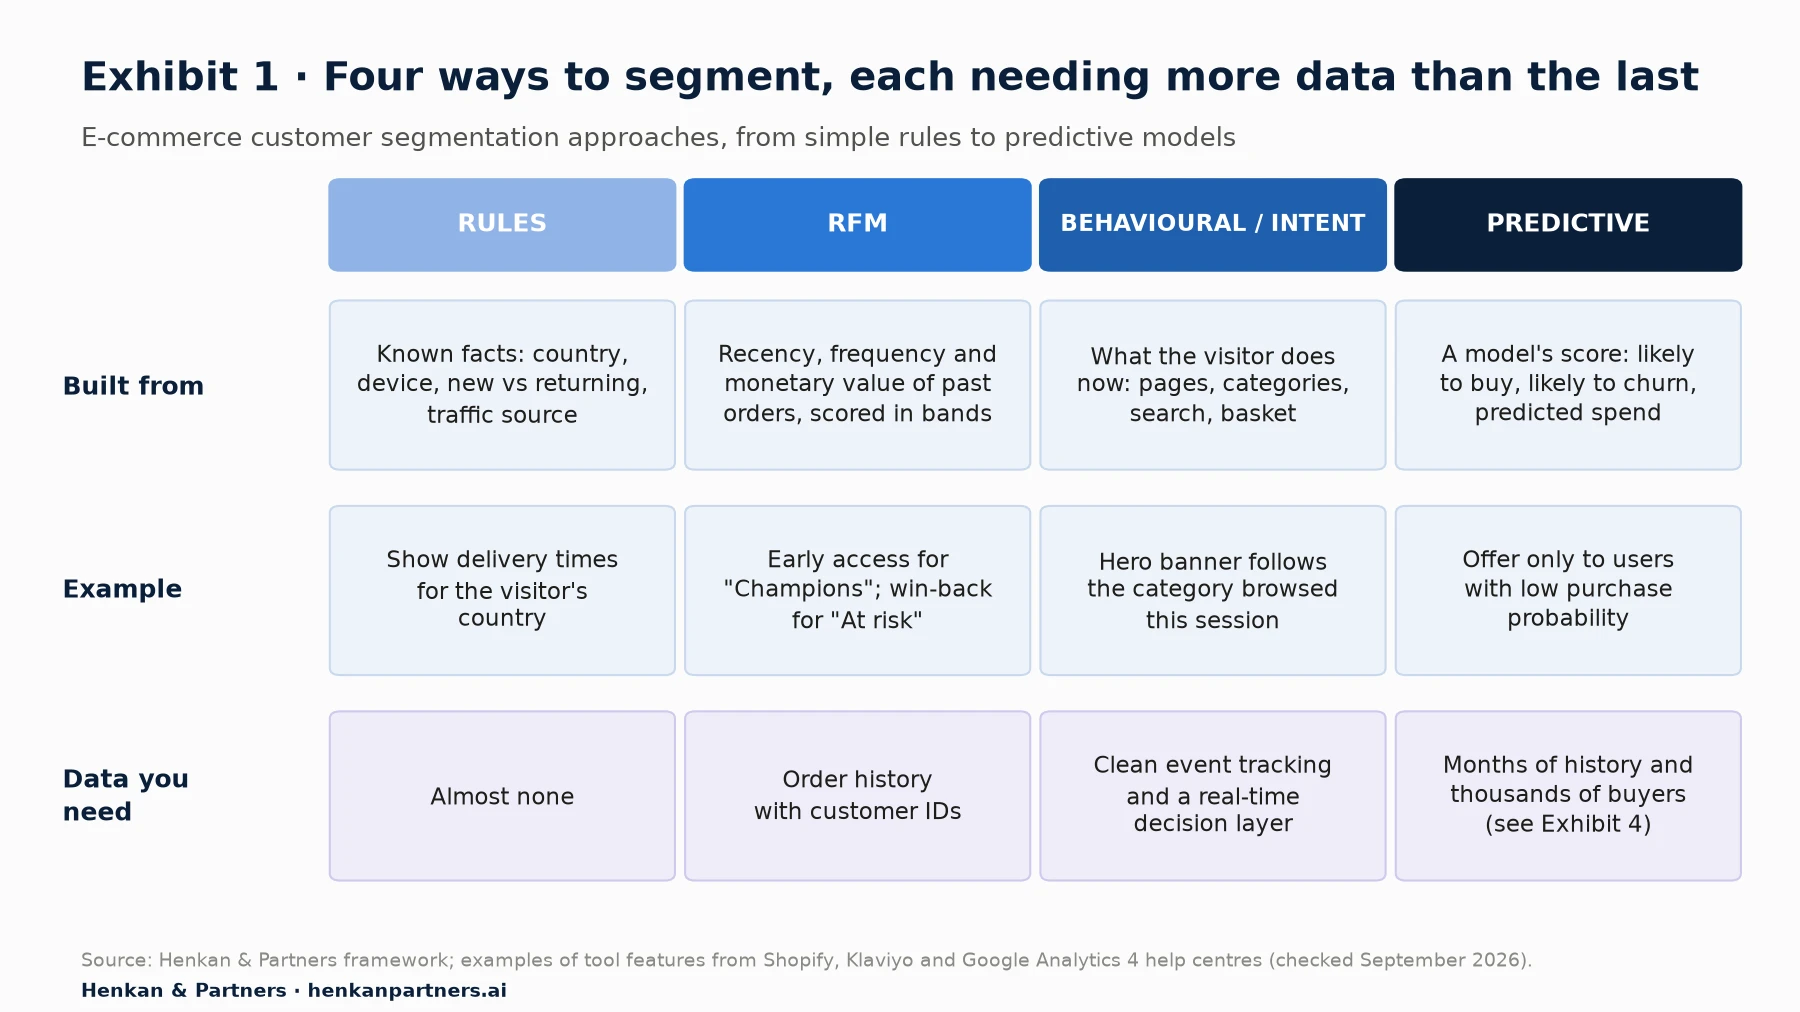
What this shows. Moving from left to right, segments become more responsive and more precise, but they also need more data, more engineering and more trust in a model. Many teams jump to predictive segments before they have exhausted simple rules that fix obvious problems, such as showing the wrong currency or delivery promise.
Rules-based segments: simple, transparent and often enough
Rules use facts you already know about a session: country, language, device, traffic source, new or returning, logged in or not. They are easy to explain and cheap to build in any testing tool. Their weakness is that they describe context rather than intent: two mobile visitors from Paris can want very different things. Rules work best for practical relevance, such as delivery times, payment methods, sizing systems or regulatory messages, where the difference between groups is known in advance.
RFM segments: the classic way to rank customers by value
RFM stands for recency, frequency and monetary value: how recently a customer bought, how often, and how much they spend. The method comes from direct and catalogue marketing. A common commercial approach scores each dimension in five bands, which yields 125 combinations; tools simplify this. Klaviyo scores each dimension from 1 to 3 (for example, a purchase within the last 180 days scores 3 for recency) and groups customers into six segments: Champions, Loyal, Recent, Needs Attention, At Risk and Inactive. Shopify's customer segment editor offers an RFM group filter with groups such as Champions, Loyal, At Risk, Dormant and Prospects.
RFM is ideal for CRM and for logged-in or identified visitors: early access for Champions, win-back offers for At Risk customers, or stopping discounts for customers who would buy anyway. It says nothing about anonymous visitors, who have no order history, and it can capitalise on chance: the Wikipedia entry on RFM notes that the "most valuable" segments found in one dataset should be validated on another.
Behavioural and intent segments: react to what the visitor does now
Behavioural segments use in-session and recent signals: the category browsed, products viewed, search terms, items in the basket, time since last visit, or whether the visitor arrived from a promotional email. They capture intent, which is often more useful than identity. A visitor who has looked at three pairs of running shoes in ten minutes is telling you something no demographic field can.
The cost is data quality. Intent segments need consistent event tracking and a decision layer that can act within the session. If product categories or events are tracked inconsistently, the segment is wrong before the test starts. Our article on which custom dimensions to collect in e-commerce analytics covers the tracking foundations.
Predictive segments: model scores, with strict data requirements
Predictive segments group people by a model's forecast: likelihood to buy, likelihood to churn or expected spend. Most marketing and analytics platforms now provide them out of the box, but each only activates above a documented threshold:
- Google Analytics 4 offers purchase probability (the chance that a user active in the last 28 days purchases in the next 7), churn probability and predicted revenue. It needs at least 1,000 returning users who triggered the relevant event and 1,000 who did not, over a seven-day period within the last 28 days, and model quality must hold over time.
- Klaviyo offers predicted customer lifetime value, churn risk and average time between orders. It needs at least 500 customers with orders, 180 days of order history with orders in the last 30 days, and some customers with three or more orders. Klaviyo itself notes that predictions work best when averaged across groups rather than read for individuals.
- Shopify offers a predicted spend tier (high, medium, low) as a segment filter once a store has made more than 100 sales.
Predictive scores are useful for deciding who to target, for example restricting a discount to visitors with a low purchase probability. But a score is not proof. A model that predicts churn well does not tell you whether your win-back offer changes that outcome. That still needs an experiment.
| Approach | Best for | Main risk | How to prove it works |
|---|---|---|---|
| Rules | Practical relevance: delivery, payment, language, device | Describes context, not intent | A/B test within the segment |
| RFM | CRM, loyalty, win-back, discount control | Blind to anonymous visitors; chance findings | Randomised holdout within each RFM group |
| Behavioural / intent | On-site content, recommendations, merchandising | Tracking errors create wrong segments | A/B test, or contextual bandit at high traffic |
| Predictive | Targeting offers and budgets | Scores mistaken for causal effects | Test the action, not the score, against a control |
Section 4 · Which segments
A segment deserves its own experience only if it is big, different, actionable and measurable
It is easy to define hundreds of segments and tempting to personalise for all of them. Each segment you personalise, however, creates another experience to design, build, QA, maintain and measure. In our experience, most programmes get more value from five well-chosen segments than from fifty. We use four filters.
- Big enough. The segment must carry enough traffic and revenue for a better experience to matter, and to be measured within a reasonable time.
- Genuinely different. The segment must need something different, for a reason you can state: a different question, barrier or motivation, backed by analytics, research or voice of customer data. "They are VIPs" is a label, not a need.
- Actionable. You must be able to build a distinct experience that addresses that need, and identify the segment reliably at the moment it matters (in session, not a week later).
- Measurable. You must be able to hold out a random part of the segment and read the result within weeks, not years.
Estimate the value before you build
A quick sizing calculation stops many weak ideas early. Multiply the segment's traffic by its conversion rate, the lift you hope for and the average order value.
Annual value of a segment experience = weekly visitors in segment × conversion rate × expected relative lift × average order value × 52

Illustrative: 10,000 × 3% × 10% × €80 × 52 = €124,800 a year
Compare that figure with the cost of building and maintaining the experience, and remember that most ideas do not deliver the hoped-for lift. As we describe in How to Build a Culture of Experimentation, only a minority of tests at leading companies improve their target metric.
Small segments take months to measure
The measurability filter eliminates more segments than any other. A widely used rule of thumb, attributed to Ron Kohavi and colleagues and restated by Zhou, Lu and Shallah (CIKM 2023), is that each variant needs about 16σ²/δ² users, where σ² is the variance of the metric and δ the absolute difference you want to detect, at 95% confidence and 80% power. For a conversion rate p, σ² = p(1 − p).
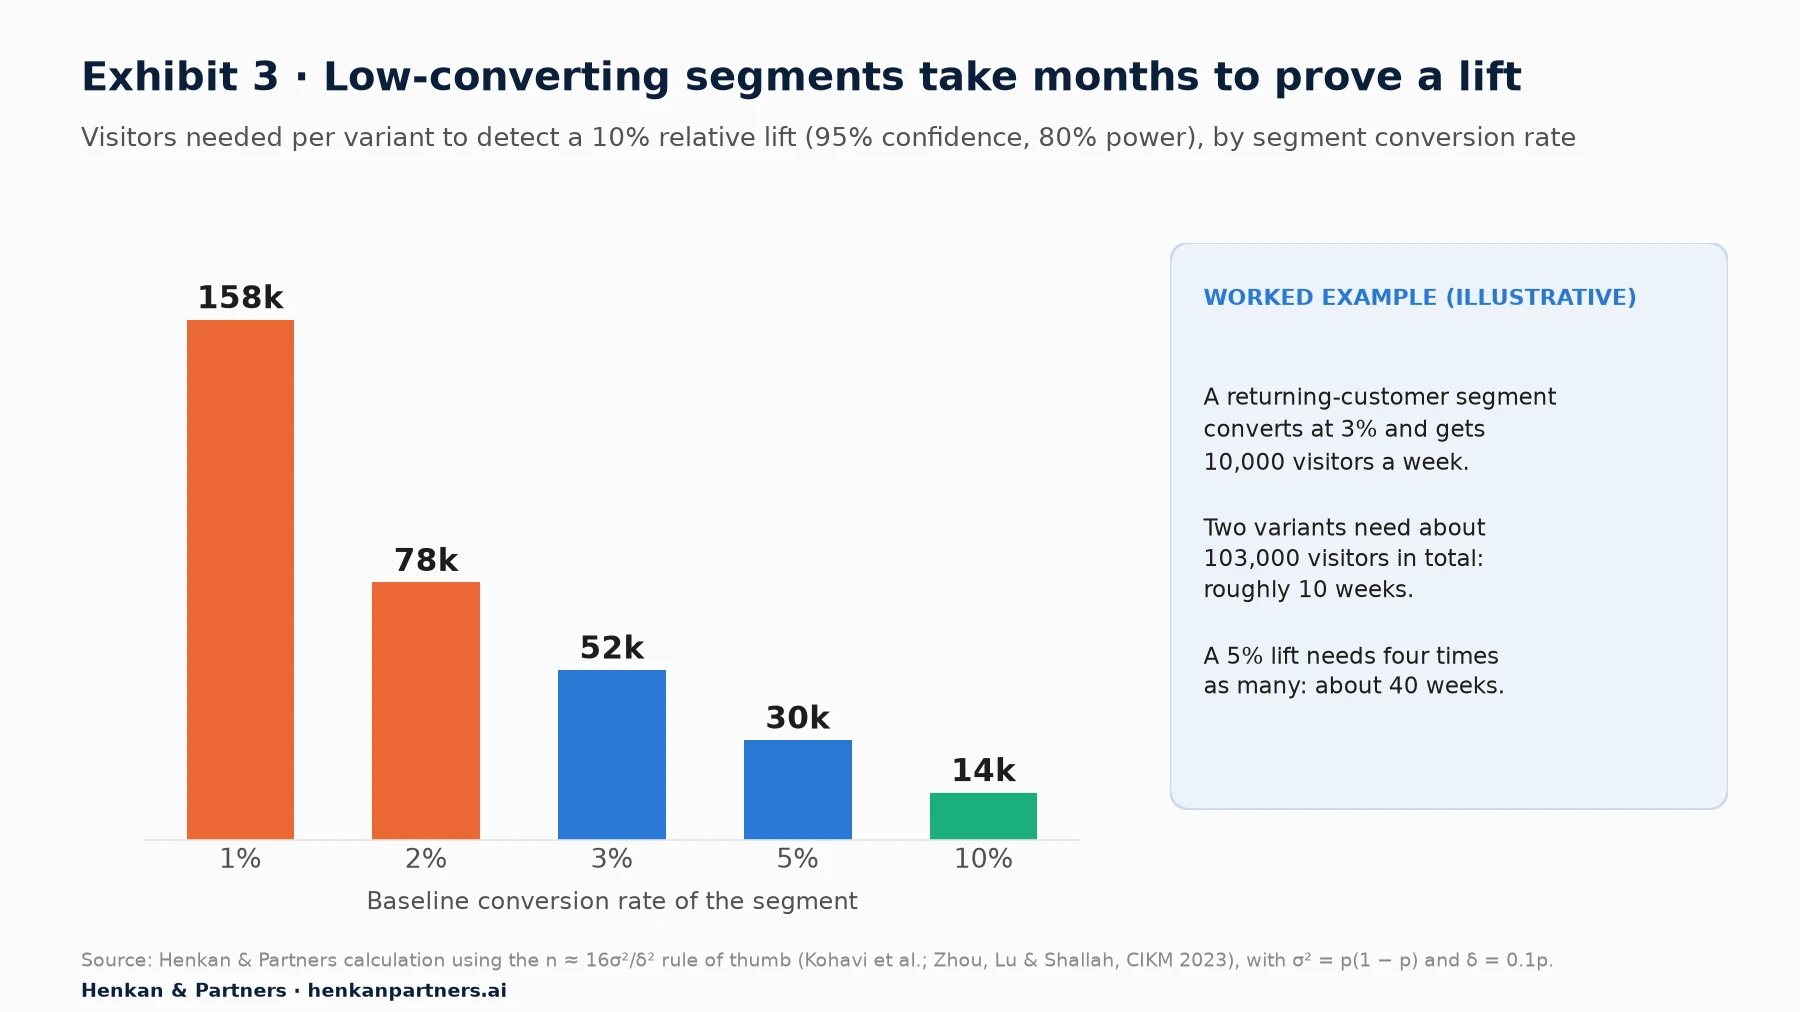
What this shows. Low-converting segments need very large samples. A segment converting at 1% needs about 158,000 visitors per variant to detect a 10% relative lift; at 3%, about 52,000. Halving the lift you want to detect multiplies the sample by four, which is why subtle personalisation in a small segment is often impossible to prove.
There are three practical responses. First, pool similar segments into fewer, larger groups. Second, measure a metric closer to the change, such as add-to-basket rate, which converts more often than purchase, while keeping revenue as a guardrail. Third, accept a lower standard of evidence for low-risk, reversible changes, and say so explicitly. What you should not do is run a test that cannot reach a conclusion and then read the noise.
Our view. If a segment cannot be measured within about eight weeks, treat it as part of a larger group or use it for low-risk relevance fixes, such as the right delivery promise, rather than for a personalisation you need to justify with numbers.
Section 5 · A/B tests and holdouts
A/B tests with planned segment analysis and a holdout remain the most trustworthy proof
A randomised A/B test is still the cleanest way to show that a personalised experience causes an improvement. There are two ways to use it for personalisation, and one discipline that makes both credible.
Test within the segment you want to personalise for
The simplest design targets only the segment, for example returning visitors from France, and randomly splits it between the default and the personalised experience. The result tells you whether the personalisation works for that segment. It says nothing about other segments, which is fine: that is the question you asked. The limitation is the sample size problem described above.
Analyse segments after a broad test, but plan them in advance
The second design runs a test on all traffic and then looks for segments where the effect differs. This is how many personalisation ideas are born: a variant that loses overall wins on mobile, or among new visitors. It is also how many false wins are born.
The reason is multiple comparisons. At a 5% significance level, each segment you examine has a 5% chance of showing a "significant" difference by pure chance. Look at 20 segments and the chance that at least one is a false positive is 1 − 0.95²⁰, about 64%. The safeguards are simple:
- Name the segments before the test starts, with a reason for each, and record them in the test plan.
- Correct for the number of segments. A Bonferroni correction divides the significance threshold by the number of segments (0.05 / 10 = 0.005 for ten segments). It is conservative but easy to explain.
- Treat unplanned segment wins as hypotheses, and confirm them with a new test targeted at that segment.
- Look for differences between segments, not just significance within them. A variant that is significant for mobile but not for desktop has not been shown to work differently on the two; the effects may be statistically indistinguishable.
More advanced methods estimate how the treatment effect varies across many attributes at once. Causal forests, developed by Stefan Wager and Susan Athey (Journal of the American Statistical Association, 2018), extend random forests to estimate individual-level treatment effects with valid confidence intervals. Some tools automate a simpler version: Dynamic Yield's Predictive Targeting scans completed A/B tests for audiences where a non-winning variation performs better, and only suggests an opportunity when the test has run for more than 14 days, the suggested variation has won for that audience, and the combined plan beats serving the overall winner by at least 1%.
Keep a global holdout to measure the whole programme
Individual tests measure individual experiences. A global holdout (or global control group) measures the cumulative effect of all personalisation by keeping a random share of visitors on the default experience everywhere. Dynamic Yield's impact report reserves 5% of users as a global control group. Optimizely's Feature Experimentation recommends holdouts of "typically up to 5%" of traffic and warns that larger holdouts slow down every other test.
A global holdout answers the question leaders actually ask, "what is all this personalisation worth?", and it catches effects that single tests miss, such as experiences that cannibalise each other. Its cost is real but small: the 5% of visitors in the holdout do not benefit from the improvements. The article on A/B testing statistics for marketers explains how to read these comparisons, including Bayesian and sequential approaches.
Section 6 · Multi-armed bandits
Multi-armed bandit vs A/B testing: bandits trade evidence for earnings
The name comes from a gambler facing a row of slot machines ("one-armed bandits") with unknown payouts. Each pull either exploits the machine that looks best so far or explores another one to learn more. A multi-armed bandit algorithm makes the same trade-off with website variants: it keeps showing all variants, but sends more traffic to those performing best. The cost of showing inferior variants is called regret.
Three classic algorithms illustrate the options:
- Epsilon-greedy sends a fixed share of traffic (epsilon, often 10%) at random to all variants and the rest to the current leader. Simple, but it keeps exploring losers forever and jumps to early leaders.
- Upper confidence bound (UCB) picks the variant whose optimistic estimate, its mean plus an uncertainty bonus, is highest. Variants with few observations get the benefit of the doubt.
- Thompson sampling draws a plausible conversion rate for each variant from its current probability distribution and shows the variant with the highest draw. Traffic flows to each variant in proportion to its probability of being best. Russo and colleagues' Tutorial on Thompson Sampling (2017) describes it as balancing "exploiting what is known to maximize immediate performance and investing to accumulate new information".
An illustrative simulation: what a bandit gains and what it gives up
To make the trade-off concrete, we simulated a simple test. The set-up is illustrative, not client data: three variants with true conversion rates of 3.0% (control), 3.3% (variant B, a 10% relative lift) and 3.15% (variant C, a 5% lift); 150,000 visitors; allocation updated every 100 visitors, as many tools update in batches; 400 repetitions for each method. We compared an equal-split A/B test with epsilon-greedy (10% exploration), UCB1 (the textbook version) and Thompson sampling. The code is a short Python script, and we are happy to share it.
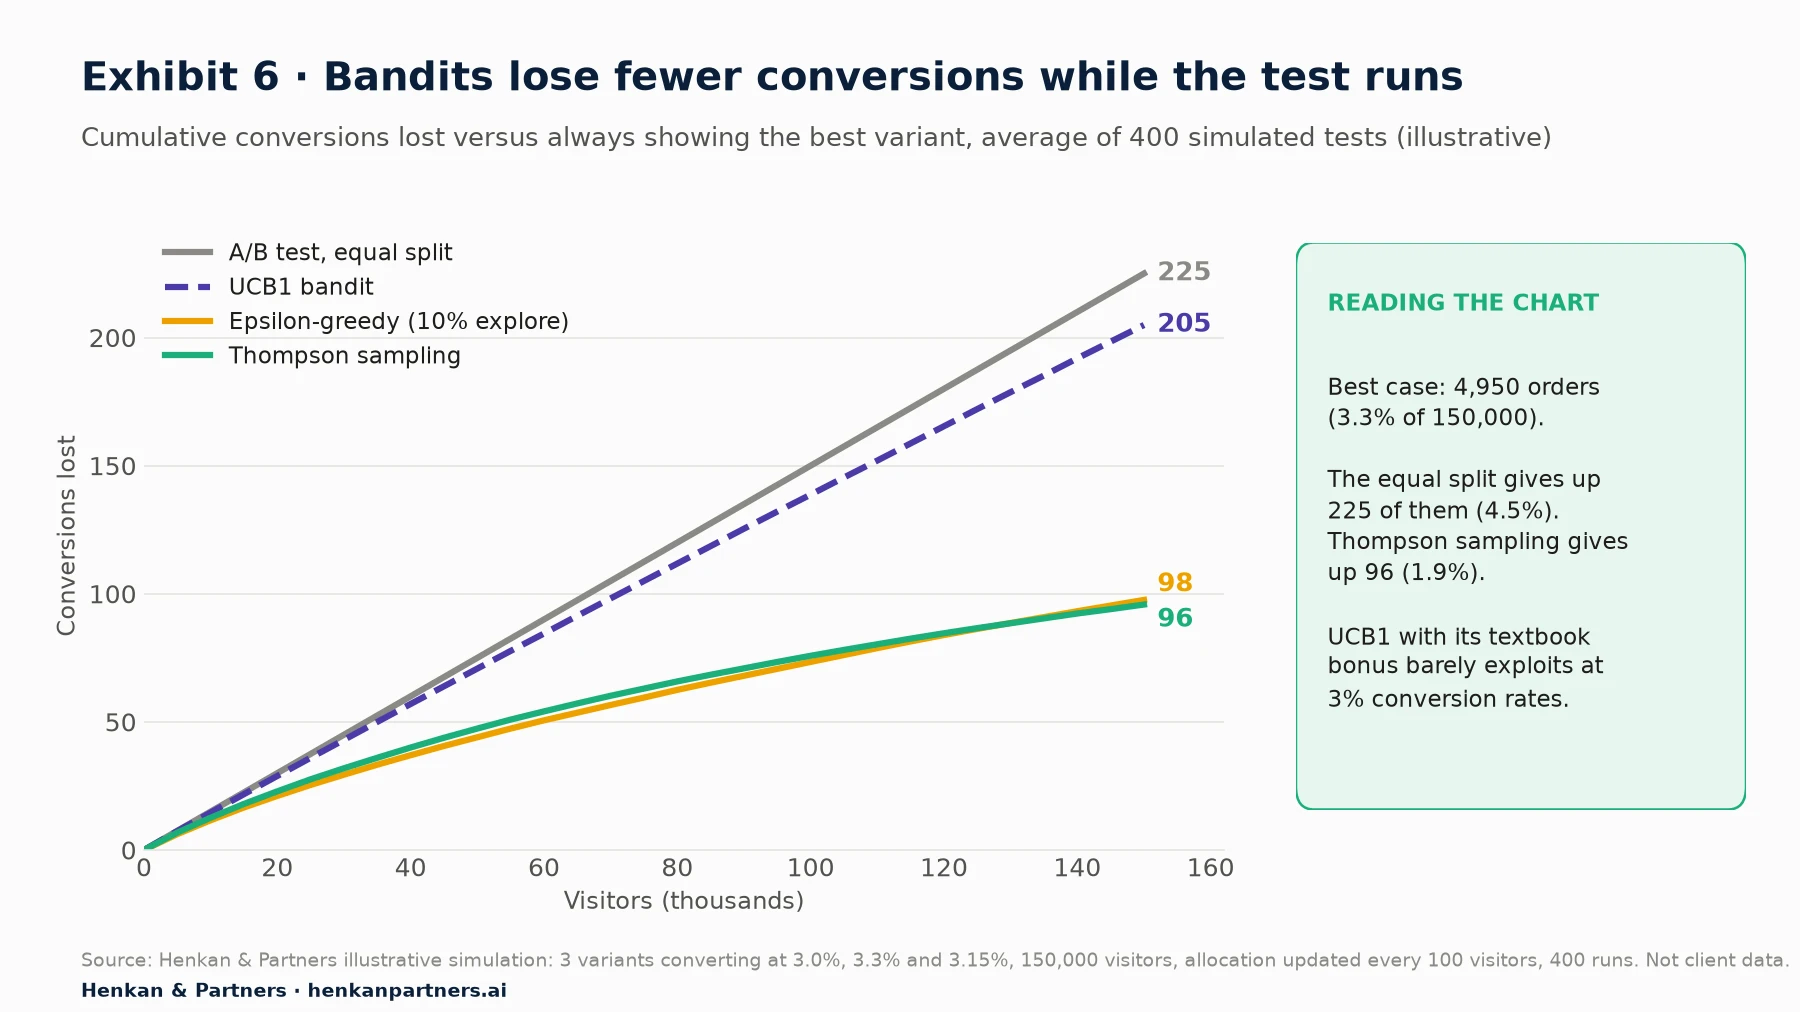
What this shows. If you had known the best variant in advance, you would have taken 4,950 orders. The equal-split test gave up 225 of them (4.5%) because two-thirds of visitors saw weaker variants throughout. Thompson sampling and epsilon-greedy gave up fewer than 100, because they moved about two-thirds of traffic to the winner. UCB1 with its textbook bonus behaved almost like an equal split: at conversion rates around 3%, its uncertainty bonus swamps the real differences, a reminder that algorithm settings matter.
So far, the bandit looks like a free lunch. It is not. Because bandits starve weaker variants of traffic, they measure them less precisely, and that includes the control.
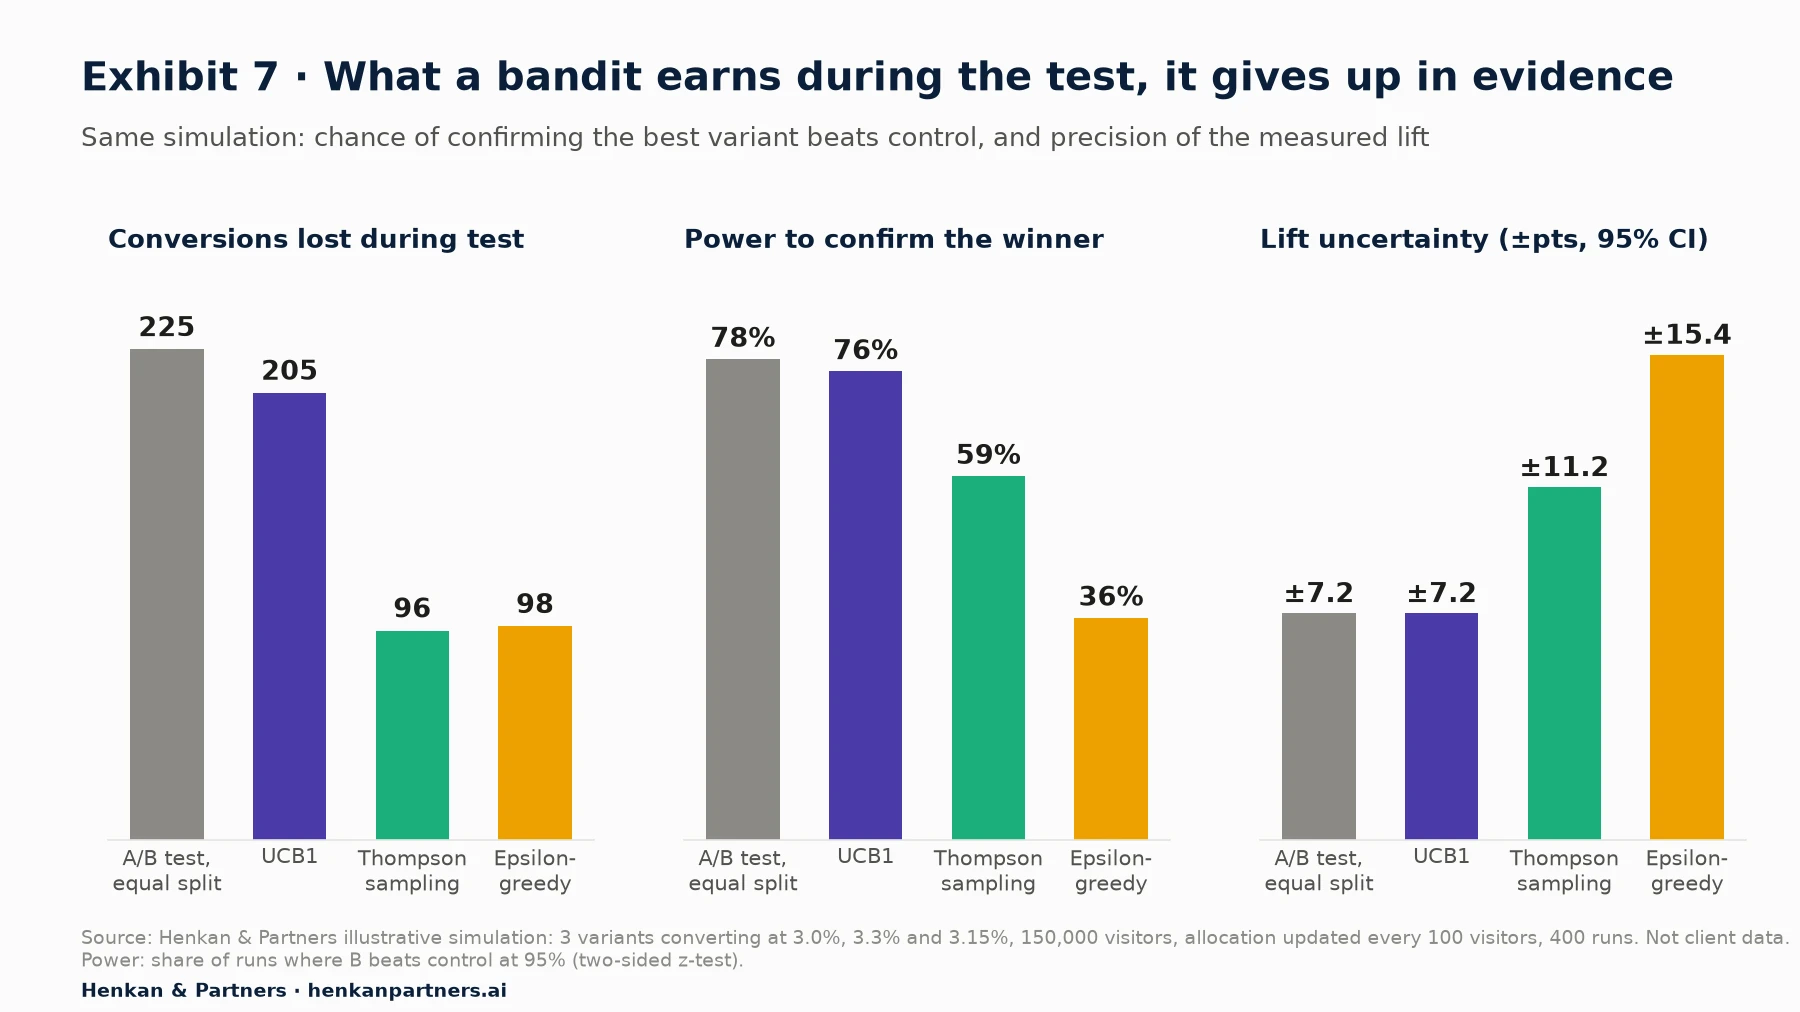
What this shows. The equal-split test confirmed that B beats control in 78% of runs, close to the 80% power it was sized for. Thompson sampling confirmed it in only 59% of runs, and epsilon-greedy in 36%. The uncertainty around the measured lift grew from ±7 points to ±11 and ±15. The bandit earned about 130 extra conversions during the test and paid for them with a much weaker answer to the question "how much better is B?".
Two further details from the simulation matter in practice. Thompson sampling sent on average only 10% of traffic to the control, and in one run the control received just 255 of 150,000 visitors, so any comparison with the default rests on very little data. And the bandits were no better at picking the right winner: the variant with the best observed rate at the end was the true best in 91% of A/B runs, 92% of Thompson sampling runs and 80% of epsilon-greedy runs.
Vendors are explicit about this trade-off. Optimizely's documentation states that its multi-armed bandits do not show statistical significance and that, because fixed allocations are optimal for reaching significance, bandit-driven experiments "generally take longer to find winners and losers than A/B tests". VWO's help centre (now published under the Wingify name) describes its bandit as suited to teams who "care more about maximizing a metric in a short time and can give up on statistical significance".
When a bandit is the right tool
Bandits fit decisions where earning during the test matters more than knowing exactly why:
- Short-lived content: a flash sale banner, a seasonal headline, a promotion that ends in ten days. There is no "after the test" in which to exploit the winner.
- Many variants of low strategic importance, such as creative or copy variations, where you want to drop losers quickly.
- Always-on optimisation of a stable choice where traffic is high and conversion is quick.
They fit badly when you need to decide something durable (a new checkout, a pricing rule, a navigation change), when you need an effect size for a business case, when conversions are delayed by days, or when behaviour changes over time. In those cases, use an A/B test.
Section 7 · Contextual bandits
Contextual bandits personalise automatically, but only with enough traffic and a holdback to prove it
A classic bandit looks for one winner for everyone. A contextual bandit learns which variant works best for each visitor, using attributes such as device, location, referrer, pages viewed or basket contents. It combines segmentation and testing: rather than you defining segments and testing each, the model discovers where each variant wins and routes visitors accordingly.
One of the most cited early results comes from Yahoo. Lihong Li, Wei Chu, John Langford and Robert Schapire (2010) applied a contextual bandit, LinUCB, to personalise articles on the Yahoo Front Page Today module and reported a 12.5% click lift over a standard context-free bandit, using a dataset of more than 33 million events. Note the scale: news recommendation generates millions of quick, frequent feedback signals, which is very different from a mid-sized online shop with a 2% purchase rate.
What the main tools do
- Optimizely offers contextual bandits in Web Experimentation, Personalization and Feature Experimentation. Exploration starts at 100% and falls towards a floor of at least 5% (and at most 50%) so the model keeps learning, and a holdback group measures the improvement of the personalised variations. Results pages do not show statistical significance.
- Adobe Target Auto-Target uses a random forest model to serve each visitor the experience most likely to convert, rebuilds models every 24 hours, and recommends a 90/10 split for always-on activities so that 10% of traffic remains a control. It needs at least 7,000 visits and 350 conversions per activity.
- Kameleoon contextual bandits use the same model as its AI Predictive Targeting, with behavioural signals such as pages viewed, scroll depth and cart contents. Traffic is split evenly until the activity has both 7 days of data and 100,000 visits.
- Statsig Autotune AI uses a LinUCB-based approach with ridge or logistic regression models retrained hourly. Its documentation notes that the linear model "may not capture complex user interactions" and is not a full recommendation engine.
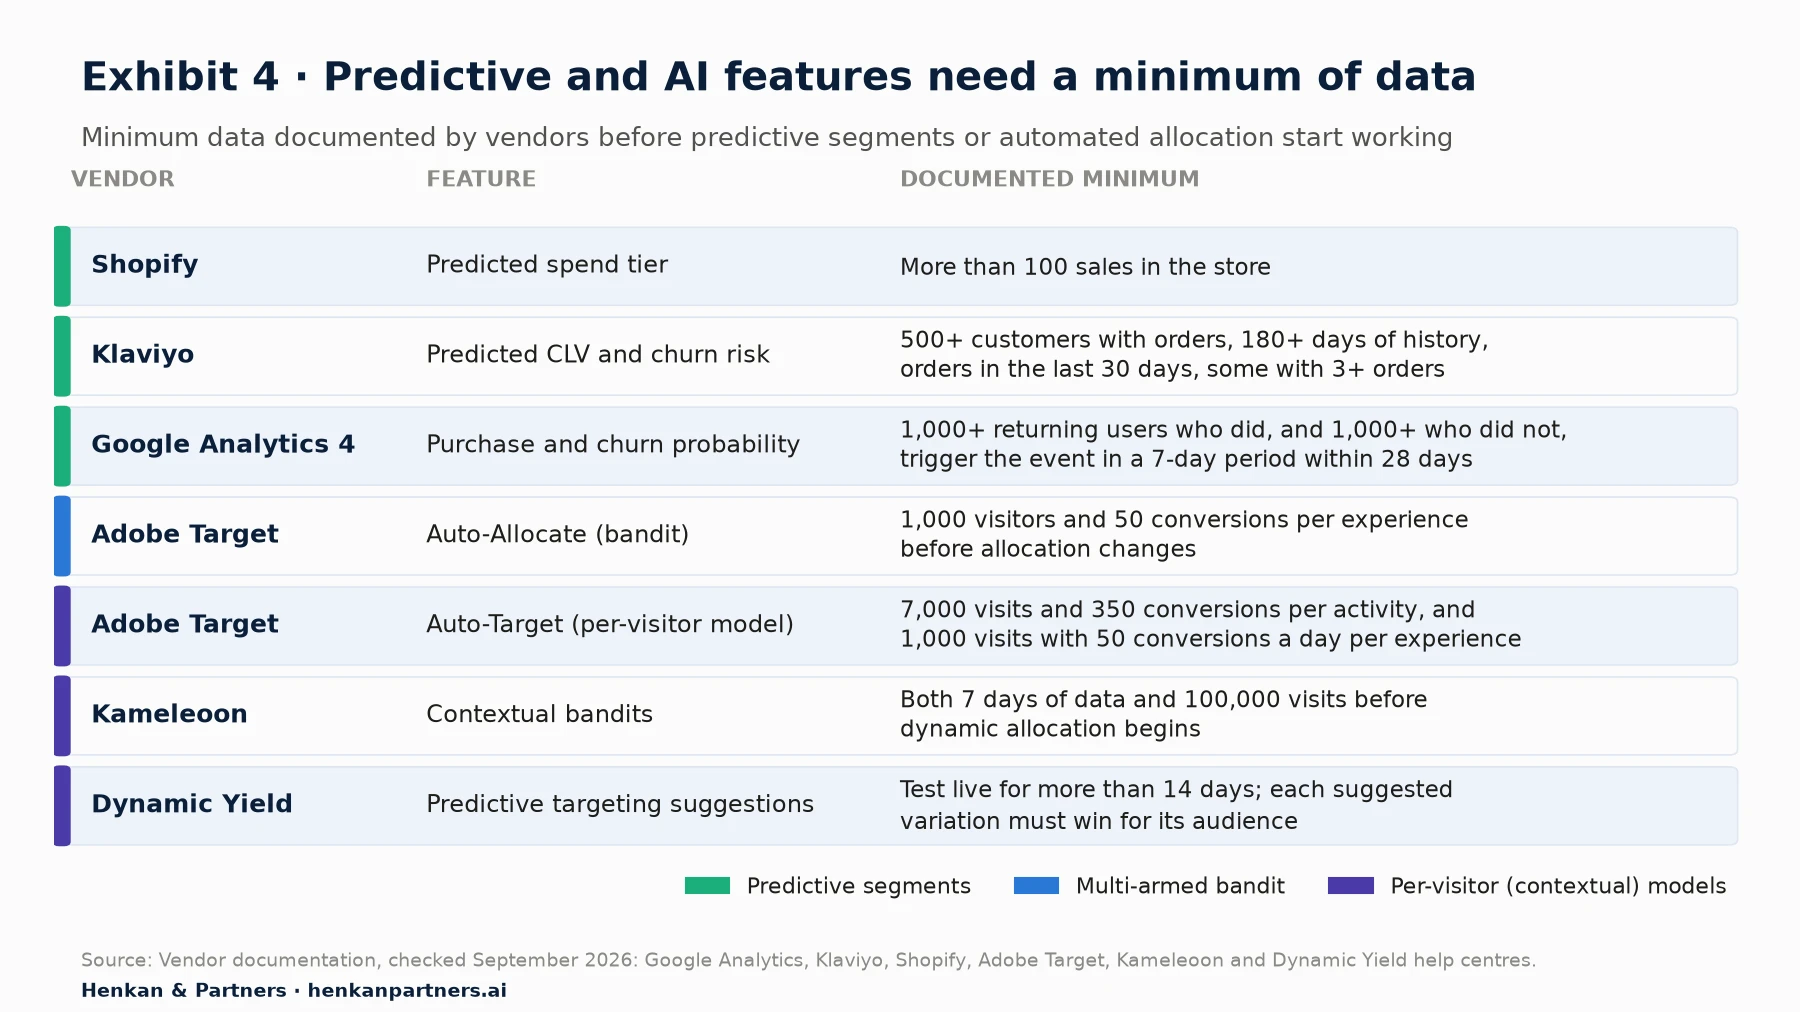
What this shows. Every predictive or automated feature has an entry ticket. The thresholds differ in units (sales, customers, visits, days) but tell the same story: models need volume and history before they are better than a simple rule. If your site or segment is below these levels, the "AI" option will either not switch on or will spend a long time behaving like a plain A/B test.
For marketers. A contextual bandit is not a way to avoid thinking about segments. It needs good attributes to learn from, variants that are genuinely different for different people, and a holdback to prove it beats the best single variant.
For leaders. Ask vendors how their personalisation model is evaluated against a random control, how large that control is, and whether you can export visitor-level data to verify the result independently.
Section 8 · Pitfalls
Five pitfalls turn personalisation results into false wins
1. Novelty effects fade
A new experience often gets extra attention simply because it is new, and that attention wears off. Researchers at Microsoft (Sadeghi et al., 2021) describe novelty as "the desire to use new technology that tends to diminish over time" and primacy as the opposite, growing engagement as users adapt. Bandits are especially exposed: they shift traffic towards an early leader during exactly the period when novelty inflates its numbers. Run tests over at least one or two full weekly cycles, and check whether the effect shrinks over time before rolling out.
2. Simpson's paradox when the traffic split changes
When the share of traffic going to each variant changes during a test, pooled results can point the wrong way. Crook, Frasca, Kohavi and Longbotham (KDD 2009) give an example in which the treatment received 1% of traffic on Friday and 50% on Saturday. It won on both days, yet looked worse when the two days were added together.
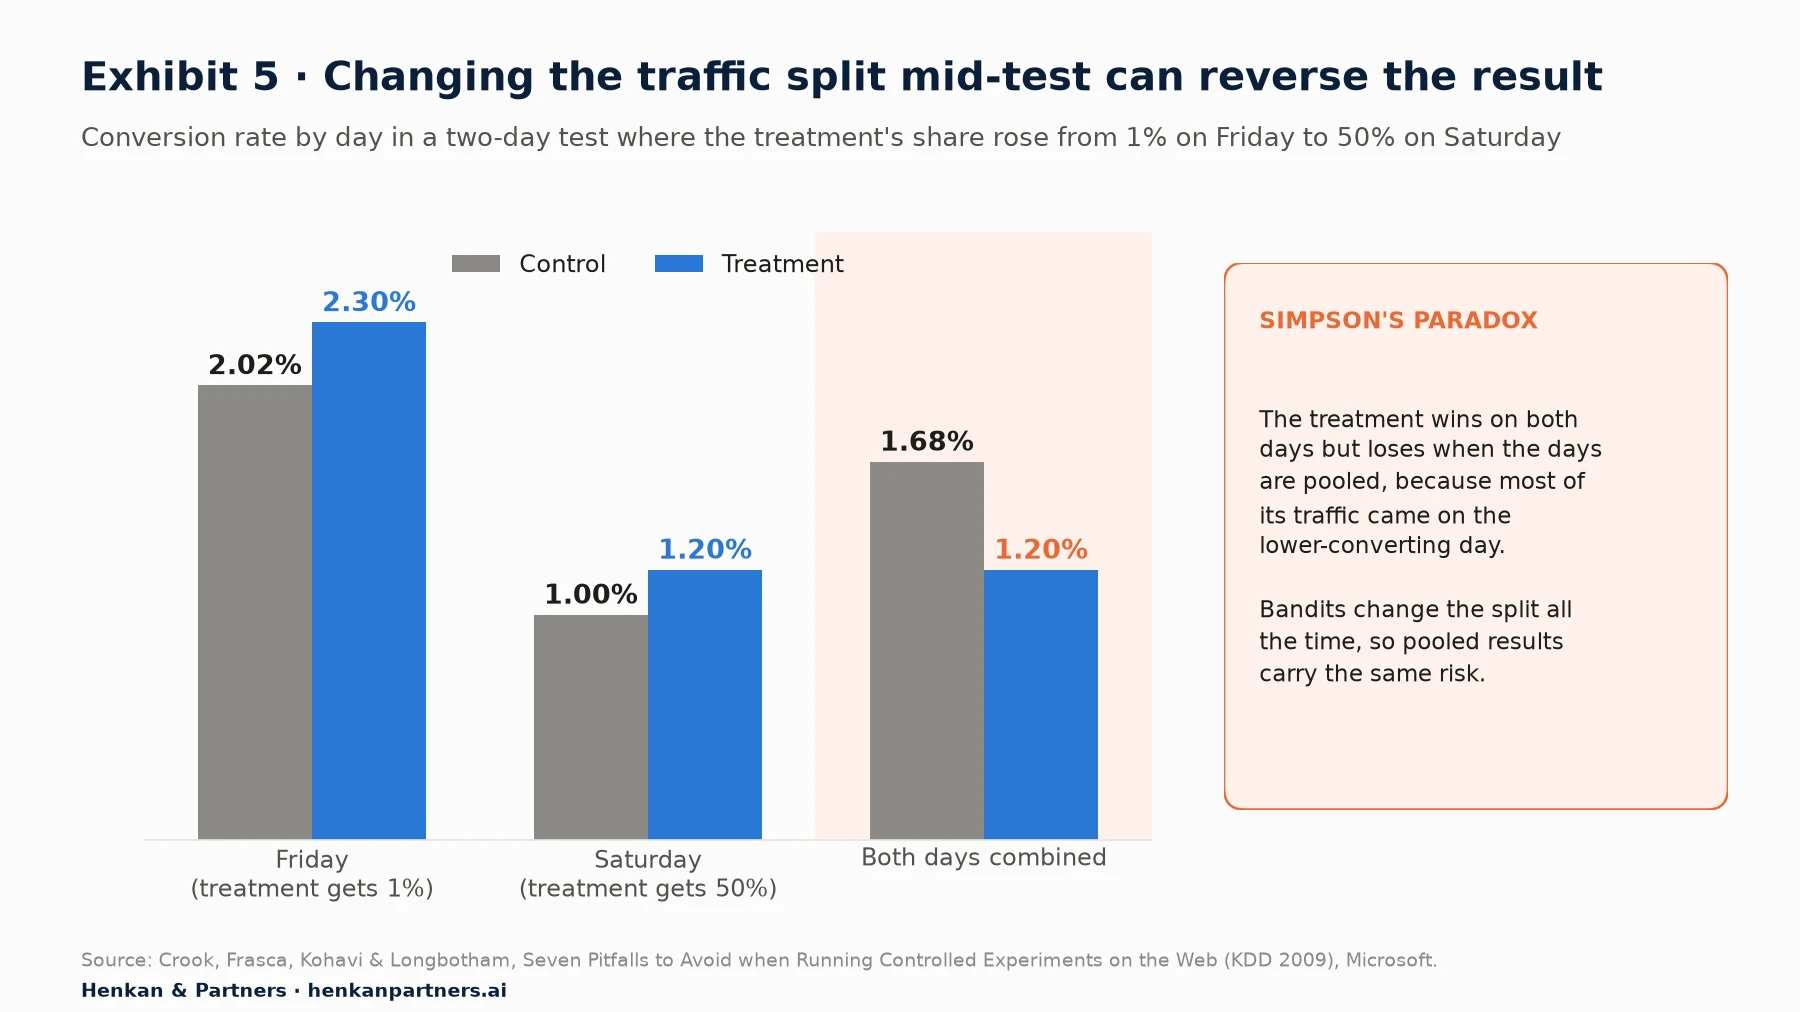
What this shows. The treatment converts better on each day, but most of its visitors arrived on Saturday, when everyone converted less. Pooling mixes a traffic-mix effect with the treatment effect. The same mechanism affects bandits, which change allocation continuously, and any test where you ramp up exposure. Compare variants within periods of stable allocation, or use methods that weight by period.
Vendors warn about related problems. Adobe notes that time-correlated conversion rates can skew Auto-Allocate, and that returning visitors can inflate the conversion rate of the experience they were assigned. AB Tasty advises against dynamic allocation where behaviour varies strongly by time of day, citing meal-ordering and taxi services, and does not allow you to switch back to static allocation once a test is live.
3. Small segments produce big, false effects
Small samples produce extreme results. The segment with the biggest lift in a post-test breakdown is very often the smallest one, because noise is largest there. Combined with the multiple comparisons problem described in Section 5, this makes "our VIPs on tablets loved it" a classic false discovery in personalisation. Report the confidence interval for every segment, not just the point estimate, and confirm surprising segment wins with a dedicated test.
4. Bandit estimates are biased
Data collected by a bandit is not a clean random sample. Nie, Tian, Taylor and Zou (AISTATS 2018) proved that, under common conditions, when data collection adapts to earlier results, simple sample means have systematic negative bias: a variant that is unlucky early gets less traffic and less chance to recover, so its measured performance stays too low. If you use bandit results to estimate an effect size for a business case, the number is not reliable without correction. Tools that do not show significance for bandits are being honest about this.
5. Optimising the wrong or a delayed metric
Bandits and contextual models optimise whatever metric you give them, quickly. Choose click-through and you may get clickbait; choose revenue per visitor and a few large orders can steer the model. Conversions that happen days after exposure arrive too late for the algorithm to learn from. Use a primary metric close to the change, with revenue and returns as guardrails, and prefer A/B tests where the real outcome is delayed.
| Pitfall | Most exposed method | Safeguard |
|---|---|---|
| Novelty effect | Bandits, short tests | Run full weekly cycles; check the effect over time |
| Simpson's paradox | Bandits, ramped tests | Compare within stable allocation periods |
| Small segments | Post-test segment analysis | Plan segments; correct for multiple comparisons; retest |
| Adaptive bias | Bandits and contextual bandits | Do not use bandit data for effect sizes; keep a fixed holdout |
| Wrong or delayed metric | All automated allocation | Metric close to the change; revenue and returns as guardrails |
Section 9 · Tools
Most testing platforms now offer bandits; the differences are in control, thresholds and reporting
Bandits and predictive targeting are no longer specialist features. The table below summarises what the main platforms document, based on their help centres in September 2026. Our Personalisation Market report covers the vendor landscape, ownership and pricing models in more depth.
| Tool | Bandit (one winner) | Per-visitor model | Holdout and reporting |
|---|---|---|---|
| Optimizely | Thompson sampling for binary metrics, epsilon-greedy for numeric metrics | Contextual bandits (Web, Personalization, Feature Experimentation); exploration 5–50% | Holdback for contextual bandits; global holdouts, typically up to 5%; no significance shown for bandits |
| Adobe Target | Auto-Allocate: 80% of visitors allocated by the algorithm, 20% at random; starts after 1,000 visitors and 50 conversions per experience | Auto-Target (random forest), models rebuilt every 24 hours | Recommends a 90/10 split so 10% stays as control in always-on activities |
| VWO | Multi-armed bandit (epsilon-greedy with Thompson-sampling allocation; 10% exploration in its simulations) | Not assessed here | Trades statistical significance for speed, per its help centre |
| AB Tasty | Dynamic allocation (multi-armed bandit) on a primary goal | Not assessed here | Cannot switch back to static allocation or change the goal once live |
| Kameleoon | Not assessed here | Contextual bandits using the AI Predictive Targeting model; start after 7 days and 100,000 visits | Learning phase checked hourly |
| Dynamic Yield | Not assessed here | Predictive Targeting suggests audience-level variations from A/B tests | Impact report with a 5% global control group |
| Statsig | Autotune (bandits) | Autotune AI contextual bandit (LinUCB-based) | MCP server exposes experiments and autotunes to AI assistants |
Disclosure: Henkan & Partners sells personalisation and experimentation consulting services and may work with some of these vendors on client projects.
AI agents and MCP: faster set-up, same statistics
AI is changing how personalisation is operated as much as how it is decided. Predictive segments in GA4, Klaviyo and Shopify are machine-learning models. Contextual bandits are learning systems. And through the Model Context Protocol (MCP), an open standard for connecting AI assistants to tools, assistants can now read and change experiments directly. Statsig's MCP server, for example, lets an assistant explore experiments, feature gates, segments and autotunes, and, with a write-enabled key, create or change configurations.
This makes it much faster to draft variants, configure segments and summarise results, as we found when testing prompt-built experiments. It does not change the statistics. An agent that ramps up a promising variant mid-test creates exactly the Simpson's paradox risk shown in Exhibit 5, and an agent that scans fifty segments for a winner will find one by chance. Give agents read access freely, and write access to allocation and targeting only with human review.
Section 10 · Choosing a method
Choose the method by the decision's lifespan, your traffic and how much evidence you need
Three questions settle most choices. How long will the decision last? How much traffic does the audience get? And will anyone need to defend the result in a business case?
| Situation | Recommended method | Why |
|---|---|---|
| Durable change for everyone (checkout, navigation, pricing display) | A/B test, fixed split | You need an unbiased effect size and a defensible decision |
| Durable change for a known segment (returning customers, a country) | A/B test within the segment, plus global holdout | Proves the segment experience and its contribution to the total |
| Discovering who responds differently after a broad test | Planned segment analysis, then a confirmatory test | Avoids false wins from multiple comparisons |
| Short-lived content (promotion, seasonal banner, headline) | Multi-armed bandit | No time to exploit a winner after the test; earnings matter more than precision |
| Always-on, high-traffic slot with many options | Contextual bandit with a 5–10% holdback | Learns per visitor; the holdback proves value against the default |
| Low traffic, practical relevance (currency, delivery, language) | Rules, no test or a light test | The need is obvious and the change is low risk |
Our view. Start with A/B tests and a global holdout. Add bandits for short-lived content once your testing process is trusted. Consider contextual bandits only for high-traffic placements where you already know, from A/B tests, that different visitors want different things.
Section 11 · What to do next
Five steps turn segmentation into personalisation you can prove
1. List your segments and size them
Write down every segment currently targeted in your testing, personalisation and CRM tools. For each, record weekly traffic, conversion rate and the need it addresses. Retire or merge segments that fail the four filters in Section 4.
2. Put a global holdout in place
Reserve around 5% of visitors as a global control group that sees no personalisation. It is the most reliable way to report the incremental value of the whole programme, and it takes weeks to accumulate, so start now.
3. Write segment analysis into every test plan
Before each test, name the segments you will analyse and why, and agree the correction for multiple comparisons. Treat anything else you find afterwards as a hypothesis for the next test.
4. Reserve bandits for short-lived decisions
Use a multi-armed bandit for promotions, seasonal content and creative variations, where earning during the test matters more than a precise effect size. Keep A/B tests for anything durable.
5. Pilot a contextual bandit where the data supports it
Pick one high-traffic placement where A/B tests have already shown different visitors respond differently, check that you clear the vendor's data thresholds, and run the model with a fixed holdback. If you would like help designing the segments, holdouts or bandit set-up, talk to us.
FAQ
Frequently asked questions about segmentation, bandits and A/B testing for personalisation
Frequently asked questions
What is customer segmentation in e-commerce?
Customer segmentation divides shoppers into groups that behave differently so each can get a more relevant experience. The four main approaches are rules (country, device, new or returning), RFM (recency, frequency and monetary value of orders), behavioural or intent segments (what the visitor does now) and predictive segments (model scores such as purchase probability).
What is personalization testing?
Personalisation testing uses controlled experiments to prove that a personalised experience beats the default for the people who see it. The main methods are A/B tests within a segment, planned segment analysis of broader tests, global holdout groups, multi-armed bandits and contextual bandits.
What is a multi-armed bandit test?
A multi-armed bandit test shows several variants but shifts traffic towards the one performing best as data arrives, instead of keeping a fixed split. Common algorithms are epsilon-greedy, upper confidence bound and Thompson sampling. It loses fewer conversions during the test but measures weaker variants, including the control, less precisely.
Is a multi-armed bandit better than an A/B test?
Neither is better in general. In our illustrative simulation, Thompson sampling lost 96 conversions against 225 for an A/B test, but its chance of confirming the winner fell from 78% to 59%. Use bandits for short-lived decisions such as promotions, and A/B tests for durable decisions that need a reliable effect size.
What is a contextual bandit?
A contextual bandit is a bandit algorithm that uses visitor attributes, such as device, location or behaviour, to choose the best variant for each visitor rather than one winner for everyone. Optimizely, Adobe Target (Auto-Target), Kameleoon and Statsig offer versions. They need high traffic and should always run with a holdback group.
How many visitors do I need to test personalisation for a segment?
A common rule of thumb is about 16σ²/δ² visitors per variant at 95% confidence and 80% power. For a segment converting at 3%, detecting a 10% relative lift needs about 52,000 visitors per variant; at 1%, about 158,000. Halving the detectable lift multiplies the sample by four.
What is a holdout group in personalisation?
A holdout, or global control group, is a random share of visitors who see no personalisation, so you can measure the incremental effect of the whole programme. Dynamic Yield's impact report reserves 5% of users and Optimizely recommends holdouts of typically up to 5% of traffic.
What is RFM segmentation?
RFM segmentation scores customers on recency, frequency and monetary value of their purchases and groups them, for example into Champions, Loyal, At Risk and Inactive. It is well suited to CRM and identified customers but says nothing about anonymous visitors.
Can AI personalise my website automatically?
Partly. Contextual bandits and predictive targeting can learn which experience to show each visitor, and AI assistants connected through MCP can set up tests faster. But the models need data volumes that many sites and segments do not reach, and you still need a random control group to prove they add value.
Key terms
- A/B test
- A randomised experiment that splits traffic in fixed proportions between a control and one or more variants. It matters because it gives an unbiased estimate of the effect of a change.
- Contextual bandit
- A bandit algorithm that chooses a variant per visitor based on their attributes. It matters because it automates segmentation and testing, but needs high traffic and a holdback to prove its value.
- Customer segmentation
- Dividing customers into groups with different behaviour or needs. It matters because personalisation only helps if the groups genuinely need different experiences.
- Epsilon-greedy
- A bandit algorithm that sends a fixed share of traffic to random variants and the rest to the current leader. It matters because it is simple but keeps exploring losers and reacts to early noise.
- Exploration and exploitation
- The trade-off between trying options to learn about them and using the option that currently looks best. It matters because every bandit setting is a choice about this balance.
- Global holdout
- A random share of visitors kept on the default experience across all personalisation. It matters because it measures the programme's total incremental value.
- Heterogeneous treatment effect
- An effect that differs across people or segments. It matters because it is the statistical basis of personalisation: without it, one experience fits all.
- Multiple comparisons
- The rising chance of a false positive when many segments or metrics are tested. It matters because 20 segments at a 5% threshold give about a 64% chance of at least one false win.
- Multi-armed bandit
- An algorithm that shifts traffic towards better-performing variants during a test. It matters because it reduces lost conversions at the cost of statistical precision.
- Novelty effect
- A temporary boost in engagement because something is new. It matters because it makes early results look better than the long-run effect.
- Predictive segment
- A group defined by a model's forecast, such as purchase or churn probability. It matters because it targets the right people but does not prove that an action changes their behaviour.
- Regret
- The value lost by not always showing the best option. It matters because it is what bandits minimise and A/B tests accept in exchange for cleaner evidence.
- RFM
- Recency, frequency and monetary value, a way to score and group customers by purchase history. It matters because it is simple, explainable and useful for CRM and loyalty.
- Simpson's paradox
- A reversal of a result when data from groups with different mixes are pooled. It matters because changing traffic splits, as bandits do, can make a winner look like a loser.
- Thompson sampling
- A bandit algorithm that allocates traffic in proportion to each variant's probability of being best. It matters because it adapts exploration to uncertainty and is used by tools such as Optimizely for conversion metrics.
Sources
All sources were checked in September 2026. Vendor documentation (Optimizely, Adobe, VWO, AB Tasty, Kameleoon, Dynamic Yield, Statsig, Klaviyo, Shopify, Google) describes each vendor's own features and is treated as vendor data. Exhibit 4 and Table 3 summarise vendor data. Exhibit 1 and Tables 1, 2 and 4 are Henkan & Partners frameworks. Exhibit 3 is our calculation using a published rule of thumb. Exhibits 6 and 7 come from an illustrative Henkan & Partners simulation (three variants converting at 3.0%, 3.3% and 3.15%, 150,000 visitors, 400 runs, fixed random seed), not from client data. Worked examples are illustrative.
- McKinsey & Company (2021). The value of getting personalization right, or wrong, is multiplying.
- Crook, T., Frasca, B., Kohavi, R. & Longbotham, R. (2009). Seven Pitfalls to Avoid when Running Controlled Experiments on the Web, KDD 2009.
- Kohavi, R., Henne, R. M. & Sommerfield, D. (2007). Practical Guide to Controlled Experiments on the Web, KDD 2007.
- Zhou, J., Lu, J. & Shallah, A. (2023). All about Sample-Size Calculations for A/B Testing: Novel Extensions and Practical Guide, CIKM 2023.
- Li, L., Chu, W., Langford, J. & Schapire, R. E. (2010). A Contextual-Bandit Approach to Personalized News Article Recommendation.
- Russo, D., Van Roy, B., Kazerouni, A., Osband, I. & Wen, Z. (2017). A Tutorial on Thompson Sampling.
- Nie, X., Tian, X., Taylor, J. & Zou, J. (2018). Why Adaptively Collected Data Have Negative Bias and How to Correct for It, AISTATS 2018.
- Sadeghi, S., Gupta, S., Gramatovici, S., Lu, J., Ai, H. & Zhang, R. (2021). Novelty and Primacy: A Long-Term Estimator for Online Experiments.
- Wager, S. & Athey, S. (2018). Estimation and Inference of Heterogeneous Treatment Effects using Random Forests, Journal of the American Statistical Association.
- Wikipedia. RFM (market research)).
- Klaviyo Help Center. Understanding scoring and customer groups in the RFM report.
- Klaviyo Help Center. Understanding Klaviyo's predictive analytics.
- Shopify Help Center. Shopify-based customer segment filters.
- Google Analytics Help. Predictive metrics.
- Optimizely Support. Maximize lift with multi-armed bandit optimizations.
- Optimizely Support. Contextual bandits.
- Optimizely Developer Docs. Run Contextual Multi-Armed Bandit optimizations.
- Optimizely Support. Global holdouts in Feature Experimentation.
- Adobe Experience League. What is an Auto-Allocate activity?.
- Adobe Experience League. What is an Auto-Target activity?.
- VWO Help Center. Understanding the working of multi-armed bandit.
- AB Tasty Documentation. Dynamic allocation.
- Kameleoon Documentation. Contextual bandits.
- Dynamic Yield Knowledge Base. Personalization Opportunities (Predictive Targeting).
- Dynamic Yield Knowledge Base. Experience OS Impact Report.
- Statsig Docs. Contextual Bandit (Autotune AI).
- Statsig Docs. Statsig MCP Server overview.