Guide
The Essential Guide to Product Analytics
Alexandre Suon · 2026-09-28
Product analytics shows what people actually do inside your website or app, and whether they come back. This guide explains the event data model, tracking plans, funnel analysis, cohort analysis and retention, the North Star metric, how it all maps onto e-commerce, the product analytics tools worth considering in 2026, and what AI agents change.
Executive summary
- Product analytics follows users over time, not pages in a session. It records each action as an event tied to a person, so you can see the order in which people do things, which features they adopt and whether they return. Web analytics answers "where did visitors come from and did they convert?"; product analytics answers "what do users do, and do they stay?"
- The data model decides what you can ever know. Events, properties, users and identity resolution (joining anonymous and logged-in activity) are the foundation. A written tracking plan with one naming convention is the cheapest insurance against data nobody trusts.
- Six analyses answer most questions: funnels, retention cohorts, paths, feature adoption, segments and stickiness. Retention is the hardest test. In Amplitude's 2025 benchmark (vendor data), the median product kept 3.8% of new users at month 3 and the top 10% kept 18.5%; in e-commerce the gap was 2.8% versus 18.9%.
- A North Star metric with three to five input metrics turns analysis into priorities. For a retailer, input metrics map onto browse, search, add to bag, checkout and repeat purchase, and each has its own events and analysis.
- The tool market has consolidated and split at the same time. Amplitude, Mixpanel and PostHog all offer free plans of 1 to 2 million events a month; Heap is now part of Contentsquare; Amplitude took on Statsig's brand and customers in May 2026; and warehouse-native tools such as Optimizely Warehouse-native Analytics (ex-NetSpring), Kubit and Mitzu query your own data warehouse instead of copying it.
- AI now answers product questions in plain language, but only on governed data. Amplitude, Mixpanel and PostHog run MCP servers that let assistants such as Claude or ChatGPT query your analytics. The answers are only as good as your event definitions, and every finding still needs an experiment before it becomes a decision.
Section 1 · The basics
What is product analytics? It follows users over time, not pages in a session
Product analytics is the collection and analysis of the actions people take inside a digital product, such as a website, mobile app or software platform, recorded as time-stamped events tied to individual users. It shows how people discover and use features, where they drop out of key journeys and whether they come back, so teams can decide what to build, fix or remove.
Product analytics grew up in software and mobile apps, where the business depends on people returning. Its unit of analysis is the user and the sequence of their actions, not the page view. That makes it good at questions such as "which first-week behaviours predict that a customer is still active three months later?" or "did the new filter panel change how many people find a product?"
The discipline sits between two neighbours that are often confused with it. The tools overlap more every year, but each still answers a different core question. Our Essential Guide to Web Analytics covers the web side in depth, and our history of the digital analytics market explains how the three categories grew apart and are now converging again.
| Product analytics | Web and marketing analytics | Experience analytics | |
|---|---|---|---|
| Main question | What do users do over time, and do they come back? | Where do visitors come from, and do they convert? | Why do people struggle on a page or screen? |
| Unit of analysis | Users, events and cohorts | Sessions, pages, channels and campaigns | Sessions, clicks, scrolls and page zones |
| Typical analyses | Funnels, retention, paths, feature adoption, stickiness | Traffic sources, attribution, conversion rate, revenue by channel | Heatmaps, session replay, frustration signals such as rage clicks |
| Typical tools | Amplitude, Mixpanel, PostHog, Heap, Pendo | Google Analytics 4, Adobe Analytics, Piano, Matomo | Contentsquare, Microsoft Clarity, FullStory, Hotjar |
| Who uses it most | Product managers, product analysts, growth teams | Marketing, e-commerce and acquisition teams | UX designers, CRO specialists |
| Blind spot | Media spend and channel attribution | Individual journeys over weeks and months | Long-term outcomes such as retention |
In practice most retailers need all three. Web analytics tells the marketing team which campaigns bring buyers. Experience analytics, covered in our session replay guide, shows what went wrong on a specific page. Product analytics links the two over time: it tells you whether the shoppers who used a new feature bought again.
For leaders. Do not buy a product analytics tool to replace Google Analytics. Buy it when you have questions that GA4 answers badly: repeat behaviour, feature adoption, logged-in journeys across web and app, and experiments on product changes.
Section 2 · The data model
Everything is an event: get the data model right and every analysis becomes easier
Every product analytics tool stores the same basic building blocks. Learning them takes an hour, and it prevents most of the problems we see in audits.
Events and properties
An event is one action at one moment: Product Viewed, Product Added, Checkout Started. Each event carries properties, key-value pairs that describe it, such as the product ID, price, list the product was clicked from, device or app version. Twilio Segment, whose tracking specification many tools follow, advises keeping event names generic and putting the detail into properties.
The distinction matters because it decides how you can slice the data. One event called Product Added with a property `list_name` lets you compare every list on one chart. Twenty events called Added From Search, Added From Homepage and so on make the same comparison painful and fill the tool with near-duplicates.
Users, user properties and identity resolution
A user is the person behind the events. User properties describe that person: first order date, loyalty tier, number of orders, country. They let you compare segments, such as first-time and repeat buyers.
The hard part is identity resolution: knowing that the anonymous visitor who browsed on Monday is the customer who logged in on Wednesday. Mixpanel's simplified ID merge is a clear example of how it works. Its SDK gives each device an anonymous `$device_id`. When you call `identify(user_id)` at sign-up or login, Mixpanel creates a mapping between the two and retroactively attaches the earlier anonymous events to the user. Mixpanel recommends calling `reset()` at logout "to prevent the unintentional merging of multiple users sharing one device". Other tools use different names but the same logic.
Groups and accounts
Some questions are about accounts, not people. Mixpanel's Group Analytics lets you choose an identifier other than the user, "such as company ID, account ID, project ID, or billing ID", to analyse data by. In B2B this means companies; in retail it can mean households, stores or franchise locations. Check your plan: at Mixpanel it is an add-on for Growth and Enterprise customers.
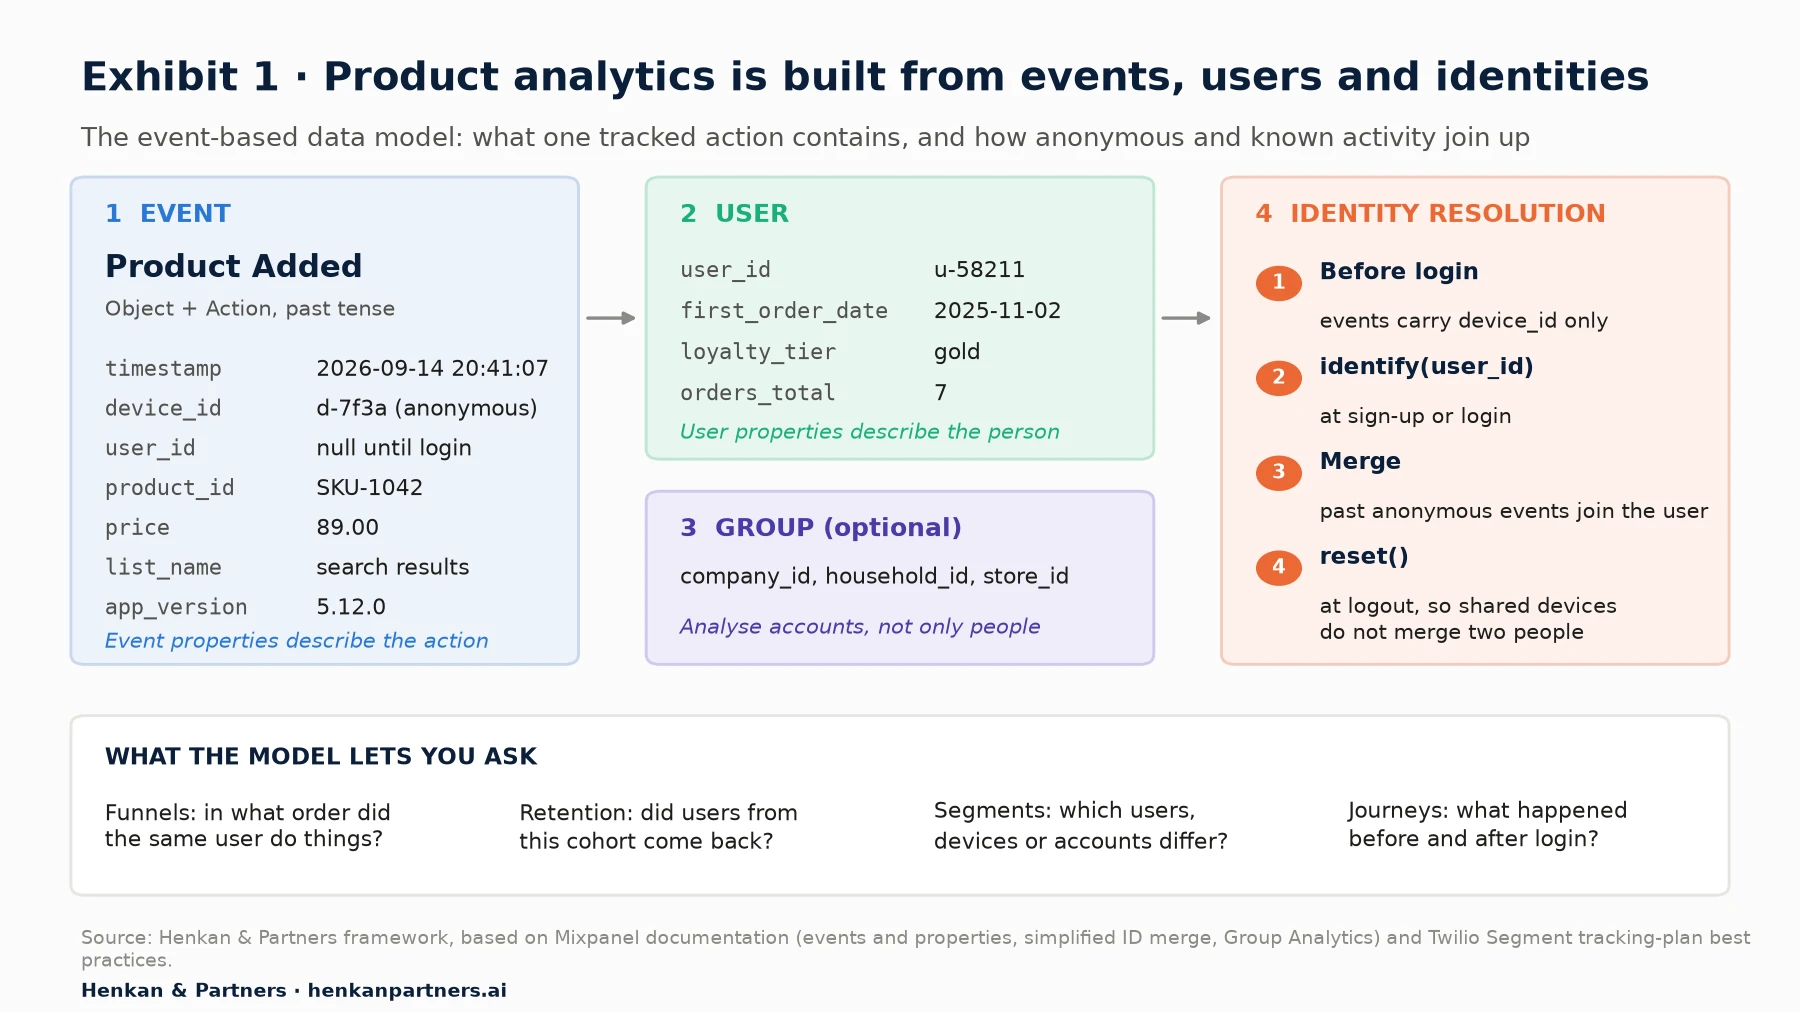
What this shows. Funnels, cohorts and segments all depend on events being attached to the right person. Most "the numbers look wrong" problems trace back to identity: users counted twice across devices, or two people merged on one shared tablet. Decide your login, logout and cross-device rules before you track your first feature.
Autocapture or explicit tracking?
Some tools, notably Heap and PostHog, can capture clicks, form changes and page views automatically; Heap says a single snippet "automatically captures the entire digital experience". You can then define events after the fact. Others rely mostly on events your developers send on purpose. Autocapture gets you started fast and lets you answer questions retroactively. It struggles with meaning: a click on a button labelled "Continue" means different things on different screens, and a redesign can silently break the definitions. In our experience the best set-ups use both: autocapture for exploration, and a small set of explicitly tracked, named business events for anything that goes into a dashboard or an experiment.
Section 3 · Tracking plan
A tracking plan and one naming convention stop your data from rotting
A tracking plan is a shared document, usually a spreadsheet or a schema inside your analytics or customer data platform, that lists every event and property you collect: its name, when it fires, what it is for and which part of the product sends it. It is the contract between product, engineering, design and analytics. Without one, event names drift, duplicates pile up and nobody knows whether checkout_start, Checkout Started and begin_checkout are the same thing.
Naming conventions
Segment recommends the Object + Action framework, with the action in the past tense: Product Viewed, Order Completed, Coupon Applied. It suggests Title Case for event names and snake_case for property names, and warns against three habits: putting dynamic values such as dates into event names, using event names to hold values that should be properties, and generating property keys on the fly (feature_1, feature_2). The exact convention matters less than applying one consistently. If you also run GA4, map your events to Google's recommended e-commerce events (`view_item`, `add_to_cart`, `begin_checkout`, `purchase`) so both tools tell the same story.
| Event | Fires when | Key properties | Question it answers |
|---|---|---|---|
| Product List Viewed | A category, search or recommendation list is shown | list_name, list_type, item_count, sort_order | Which lists lead to product views? |
| Products Searched | A search is submitted | query, results_count, has_typo_correction | How often does search return nothing useful? |
| Product Viewed | A product page or quick view loads | product_id, price, in_stock, list_name | Which entry points create interest? |
| Product Added | An item is added to the bag | product_id, quantity, value, add_source | Which pages and components build baskets? |
| Checkout Step Viewed | Each checkout step is displayed | step_number, step_name, payment_options_shown | Where exactly does checkout lose people? |
| Order Completed | The order is confirmed | order_id, revenue, items, coupon, is_first_order | Who buys, and who buys again? |
How many events do you need?
Fewer than you think. Segment advises starting with a handful of events tied to business objectives and expanding gradually. A good first plan for a retailer has 15 to 30 events, each with a clear question behind it. Add events when a real decision needs them, not because a tool makes tracking easy.
Also respect the limits of the tools you send data to. GA4, for example, accepts up to 25 parameters per event and 25 user properties per property, and it does not log events or parameters that exceed its limits. Our focus on which custom dimensions to collect in e-commerce analytics goes deeper into the properties that pay off for retailers.
Our view. Put tracking in the definition of done. A feature is not shipped until its events are in the tracking plan, implemented, and checked in a test environment. It adds perhaps half a day to a sprint and saves weeks of arguing about numbers later.
Section 4 · Funnels, paths and segments
Funnel analysis shows where users drop off; paths and segments show how and for whom
Once the data model is in place, a small set of analyses answers most product questions. This section covers the three that describe a journey. Section 5 covers retention and Section 6 metrics.
Funnel analysis
Funnel analysis measures the share of users who complete a defined sequence of steps, for example Product Viewed → Product Added → Checkout Started → Order Completed, and where they drop out. Unlike a page-based report, a product analytics funnel follows the same users through the steps, in order, within a time window you choose.
Three settings change the answer, so write them down with every funnel you share:
- Conversion window. Must users complete the funnel within 30 minutes, one day or 30 days? A short window suits checkout; a long one suits a considered purchase such as furniture.
- Step order. Strict order (step 2 must follow step 1 directly) or any order after step 1. Strict order is cleaner; loose order reflects how people actually shop.
- Counting unit. Unique users, sessions or every attempt. A user who tries to check out three times is one user, three sessions and three attempts.
Always split funnels by device, traffic source and new versus returning users before drawing conclusions. A falling conversion rate is often a change in the mix of visitors, not in the product.
Paths and flows
Path or flow analysis shows the most common sequences of events before or after a chosen point. It answers "what did people do instead of adding to bag?" or "where do users go after a failed search?". It is the best tool for finding journeys you did not design, such as shoppers bouncing between two product pages to compare them because the comparison feature is hidden.
Segmentation
Segmentation breaks any metric down by properties of the event, the user or the group: device, country, acquisition channel, loyalty tier, first-order category. Behavioural segments, also called cohorts in many tools, go further, grouping users by what they did: "used the size guide in the last 30 days" or "bought at least twice". These segments can often be exported to email, advertising or personalisation tools, which turns an insight into an action. Our guide to web analytics for product owners shows how to size the opportunity before acting on a segment.
For marketers. Build one funnel from campaign landing page to order, split by channel. It will show you whether a channel brings people who browse or people who buy, and it often changes budget conversations faster than any attribution model.
Section 5 · Retention and cohorts
Retention is the truest test of value, and cohort analysis is how you read it
Acquisition can be bought. Retention cannot. Whether people come back is the clearest sign that a product, a feature or a shopping experience delivers lasting value, and it is where product analytics earns its keep.
Cohort analysis
Cohort analysis groups users by a shared starting point, usually the week or month of their first visit or first order, and tracks what share of each group comes back in each later period. Reading the table row by row shows how one cohort behaves over time; reading it column by column shows whether newer cohorts retain better than older ones, which tells you if the product is improving. Even GA4 offers a cohort exploration with daily, weekly or monthly granularity and up to 60 cohorts per exploration.
Retention in period N = users from the cohort active in period N ÷ users in the cohort at the start

Example (illustrative): 2,000 first-time buyers in March; 240 place another order in June
Month-3 repeat-purchase retention = 240 ÷ 2,000 = 12%
Define "active" carefully. For a content app it may be any session; for a retailer, a return visit is a weak signal and a second order is a strong one. Choose the event that best reflects value, and use the same definition across reports.
Retention curves
Plot the share of a cohort still active against time and you get a retention curve. Its shape matters more than any single point.
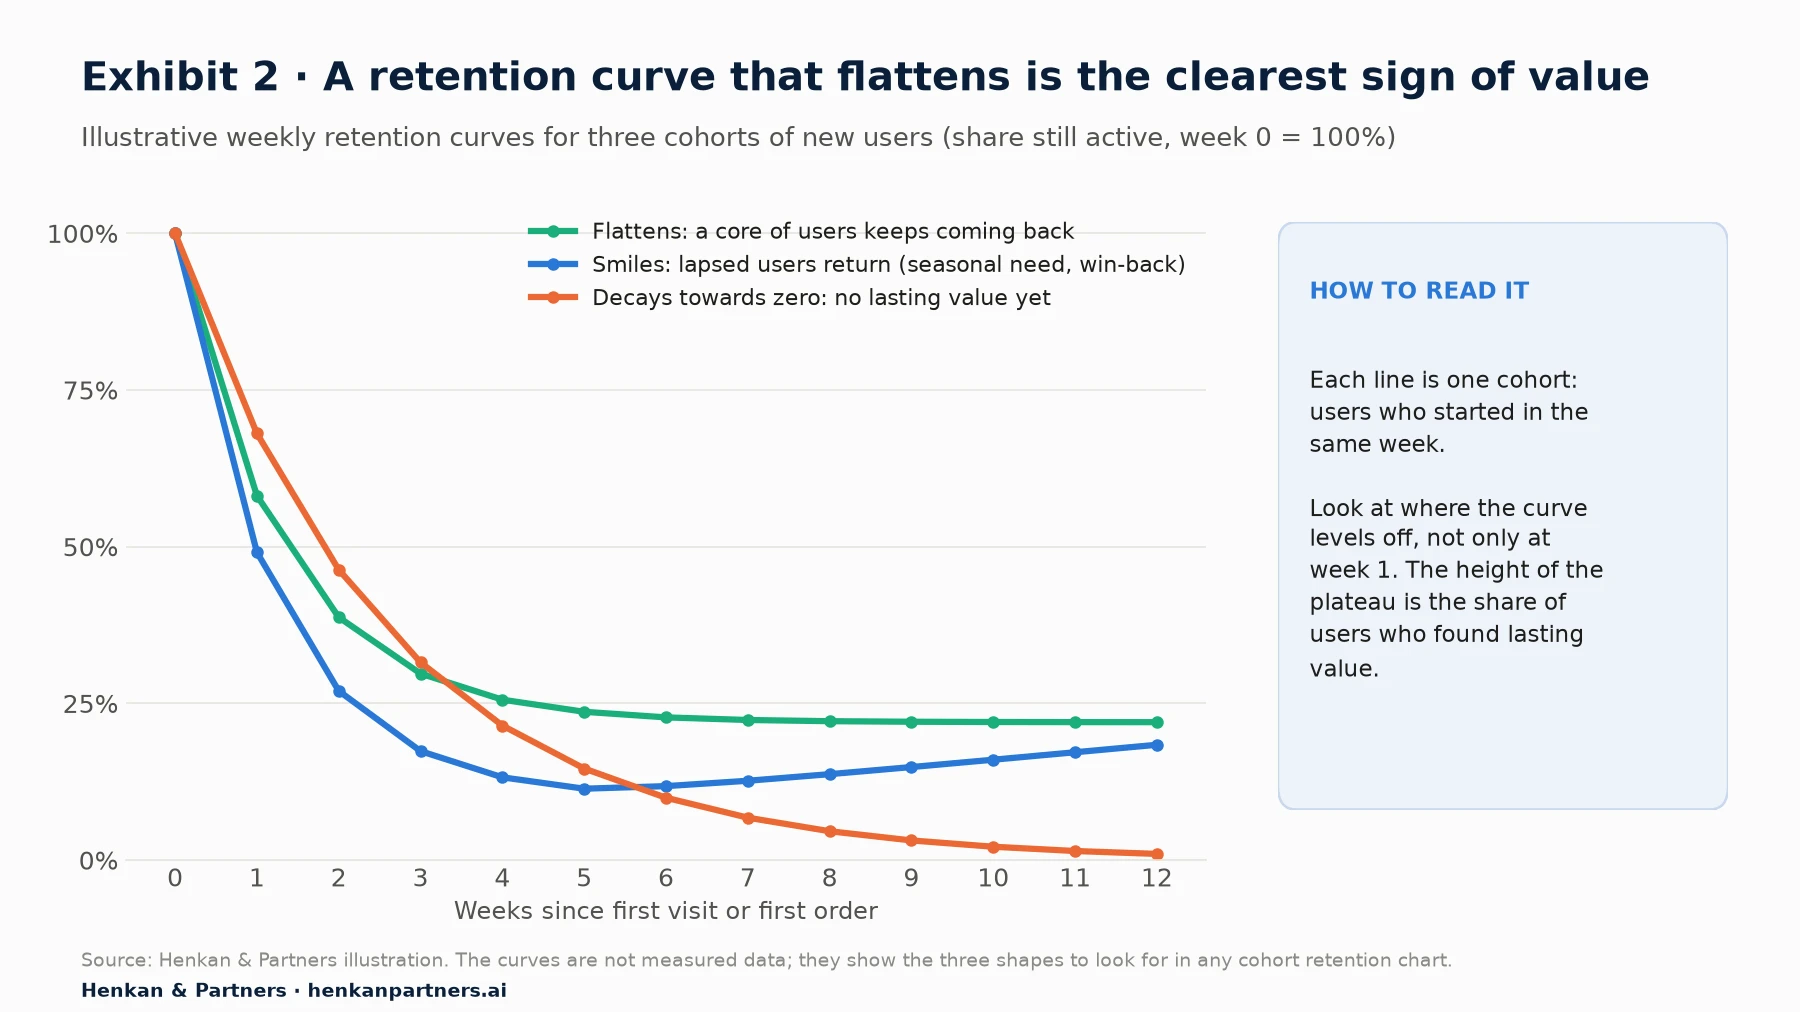
What this shows. A curve that flattens means a core of users keeps finding value; the height of the plateau is what product work should raise. A curve that keeps falling means users try the product and leave, and no amount of acquisition spend fixes that. A curve that rises again, often seen in retail around seasons and win-back campaigns, shows that lapsed customers can be reactivated.
Retention benchmarks
Benchmarks help set expectations, as long as you remember that they come from vendors' own customer bases and use each vendor's definitions. Amplitude's 2025 Product Benchmark Report, built on data from more than 2,600 companies between September 2023 and September 2024, is the most detailed public source.
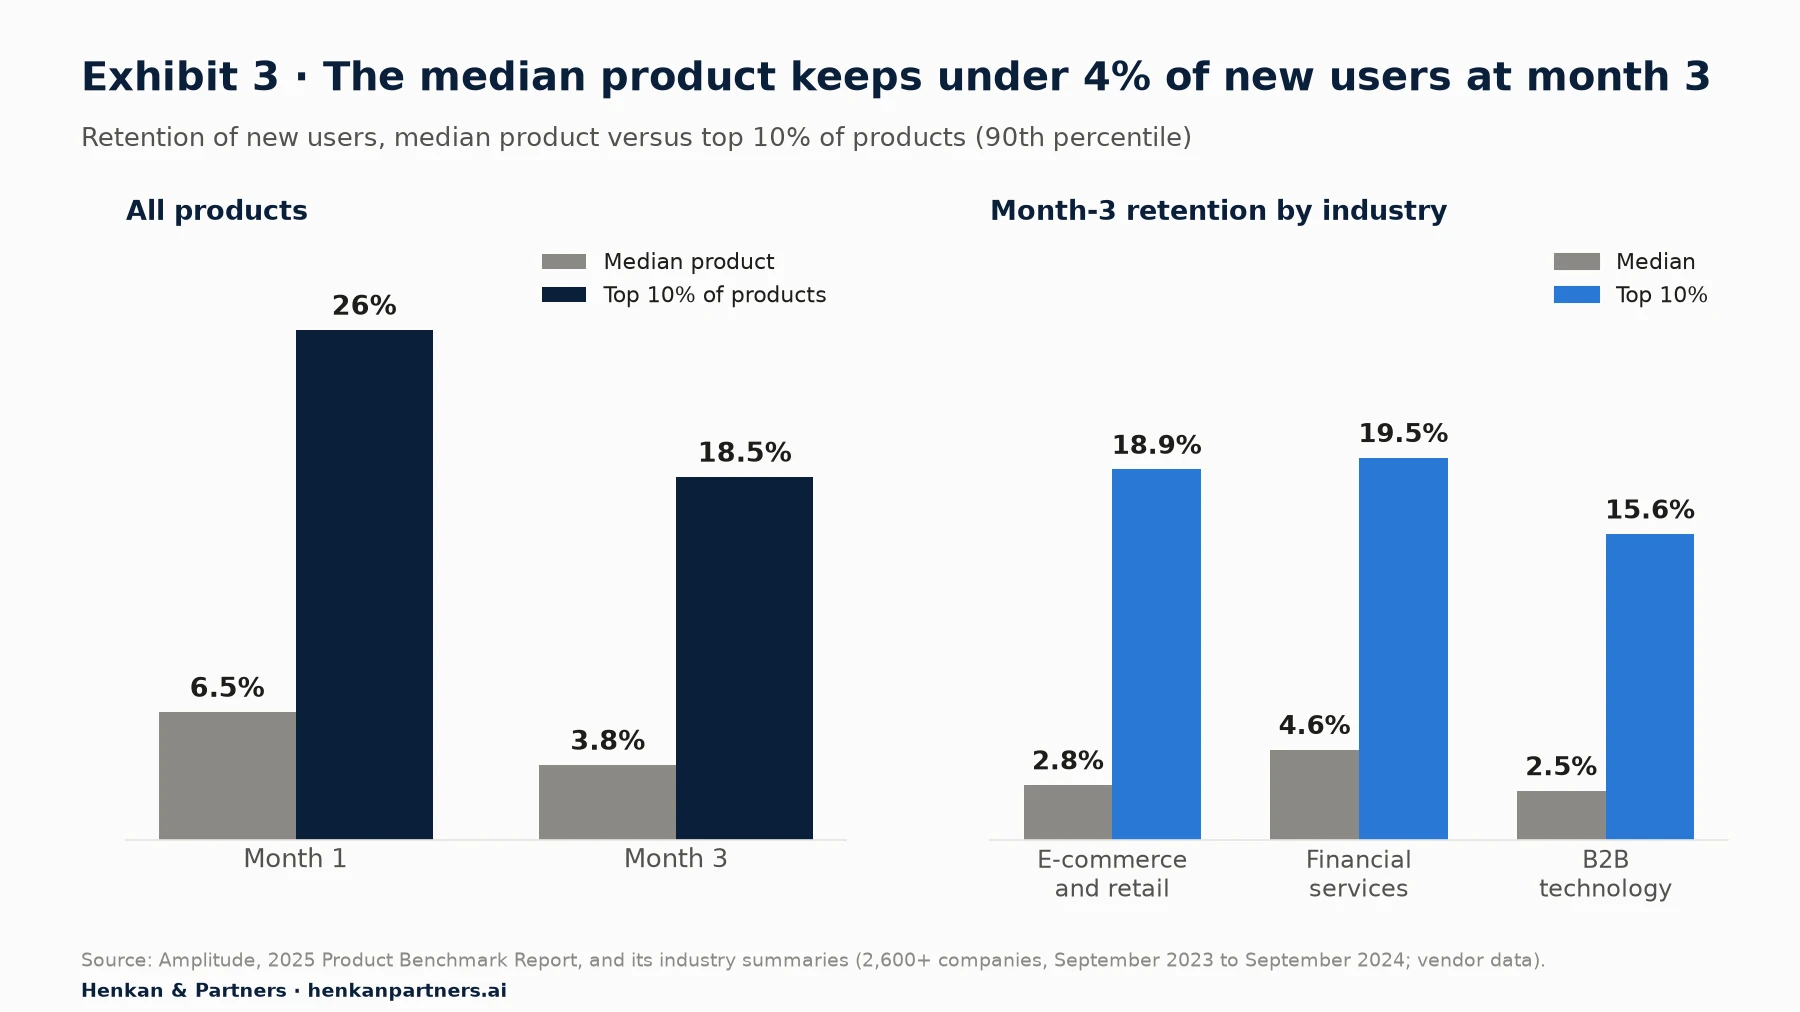
What this shows. Most new users do not come back: the median product keeps fewer than 4 in 100 after three months. The spread is huge, though. Top e-commerce products retain nearly seven times as many new users as the median, which is why retention, not traffic, separates the leaders. Amplitude also reports that 69% of products with strong early activation were strong three-month retention performers, so the first week is where to look first.
Amplitude also proposes a practical threshold: products that keep 7% of new users on day 7 sit in the top 25% for activation. Treat this as a rough guide for software-like products. A retailer with a purchase cycle of several weeks should look at repeat-purchase cohorts over months instead.
Stickiness: DAU/MAU
Stickiness measures how often active users come back within a month. The standard ratio divides average daily active users (DAU) by monthly active users (MAU).
Stickiness = average daily active users in the month ÷ monthly active users

20% means the average active user is active on about 6 of 30 days
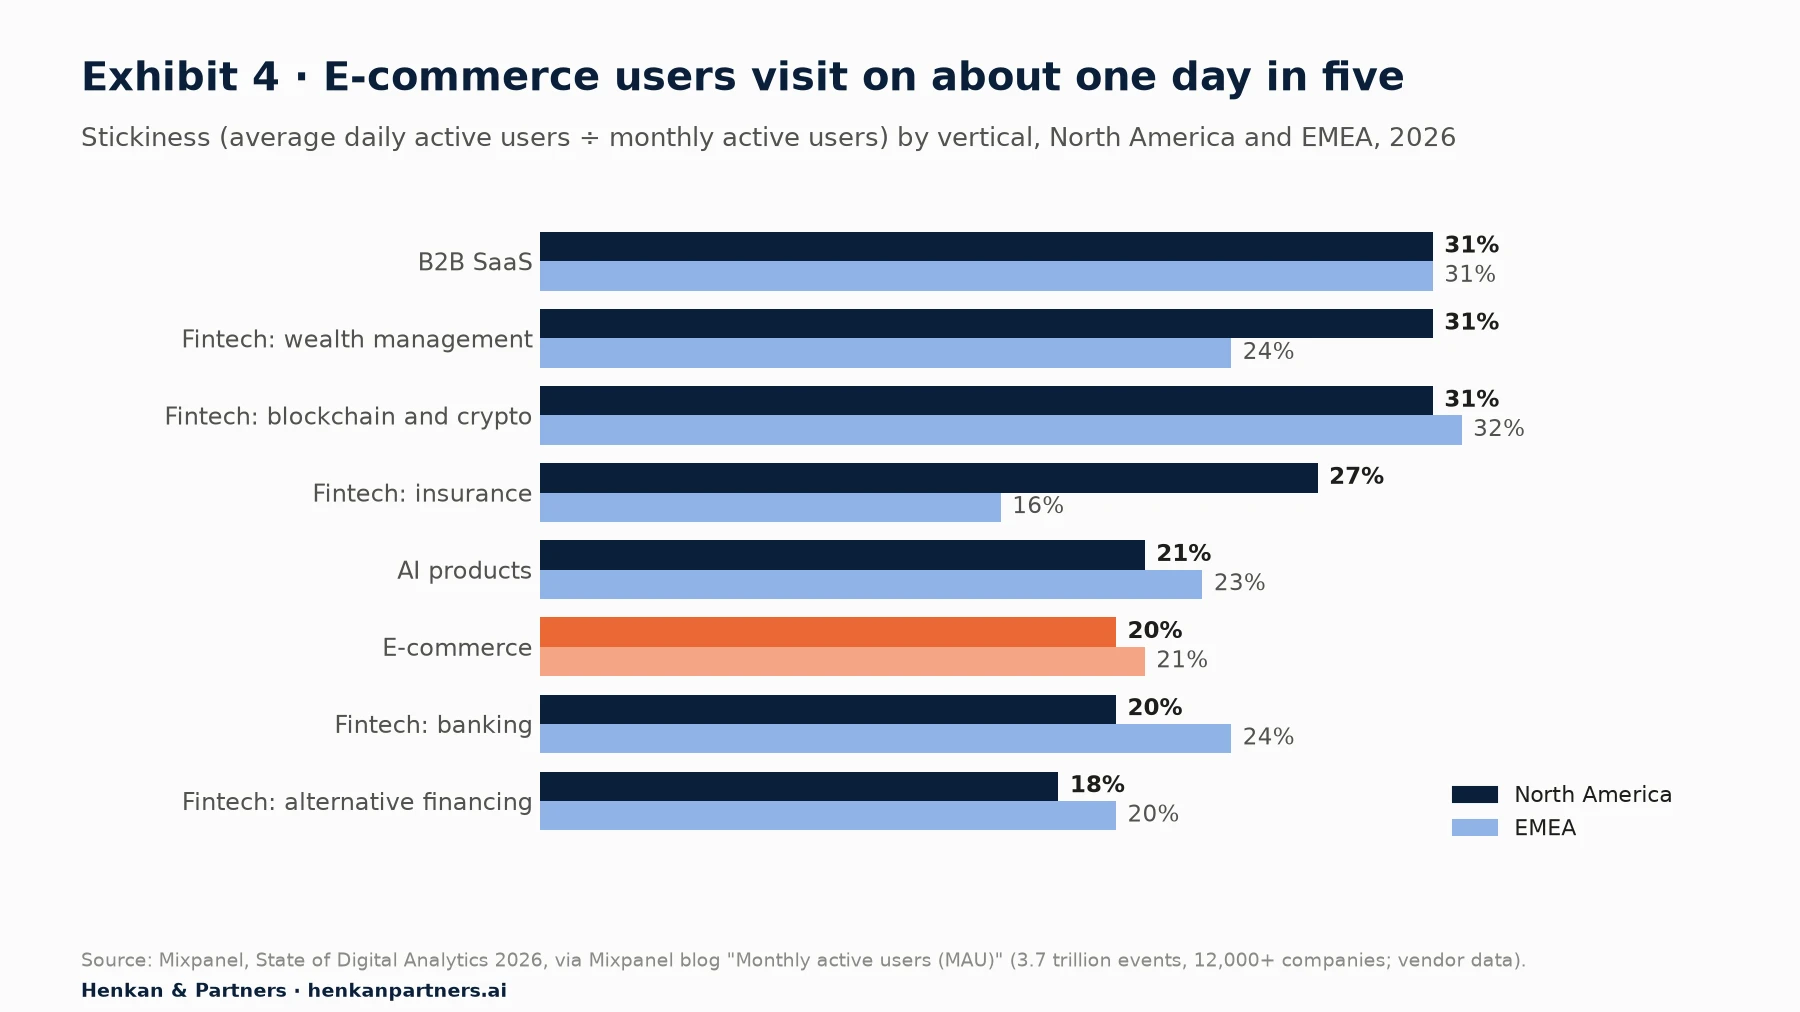
What this shows. E-commerce users are active on roughly one day in five, close to banking and AI products and well below B2B software, which people use for work every day. Mixpanel notes that 31% for B2B SaaS is lower than the 40% figure often quoted from older estimates. For most retailers, stickiness is a secondary metric: shopping is not a daily habit, and pushing for one can reward notifications that annoy customers.
Section 6 · Product metrics
A North Star metric and three to five input metrics turn analysis into priorities
Analyses produce answers; metrics decide which questions matter. Without an agreed set of product metrics, every team optimises its own number and every release "wins" on something.
The North Star metric
Amplitude's North Star Playbook, one of the best-known frameworks, defines the North Star metric as "the key measure of success for your company's product team" that "defines the relationship between the customer problems your product team is trying to solve and the revenue you aim to generate". A good North Star, it says, aligns to customer value, represents your product strategy and is a leading indicator of success rather than a lagging one such as revenue.
The playbook groups products into three "games" that shape the choice: the attention game (how much time customers spend in the product), the transaction game (how many transactions users make) and the productivity game (how efficiently people get work done). Most retailers play the transaction game. One of Amplitude's published examples is a Fortune 100 retailer whose North Star was the "number of mobile orders delivered".
Input metrics
A North Star moves slowly and no single team controls it. The framework therefore breaks it into "three to five influential, complementary factors", the input metrics, that teams can move directly. For an online shop whose North Star is orders delivered to repeat customers, inputs might be search success rate, product view to add-to-bag rate, checkout completion rate and the share of first-time buyers who order again within 90 days. Add guardrail metrics that must not get worse, such as return rate, page speed and unsubscribes.
| Business | Game | Example North Star (illustrative) | Example input metrics |
|---|---|---|---|
| Fashion or beauty retailer | Transaction | Orders from customers with 2+ orders per month | Search success rate; add-to-bag rate; checkout completion; 90-day second-order rate |
| Marketplace | Transaction | Orders delivered without a claim | Listings with complete data; seller response time; buyer search success |
| Media or content app | Attention | Weekly users who finish at least one piece of content | New-user activation; recommendations clicked; notification opt-in |
| B2B software | Productivity | Weekly active teams completing a core task | Seats activated; key feature adoption; time to first value |
Feature adoption
Feature adoption is the share of active users who use a feature in a period. It is the first check after any release: did people find it, try it and keep using it? The evidence says most features struggle.
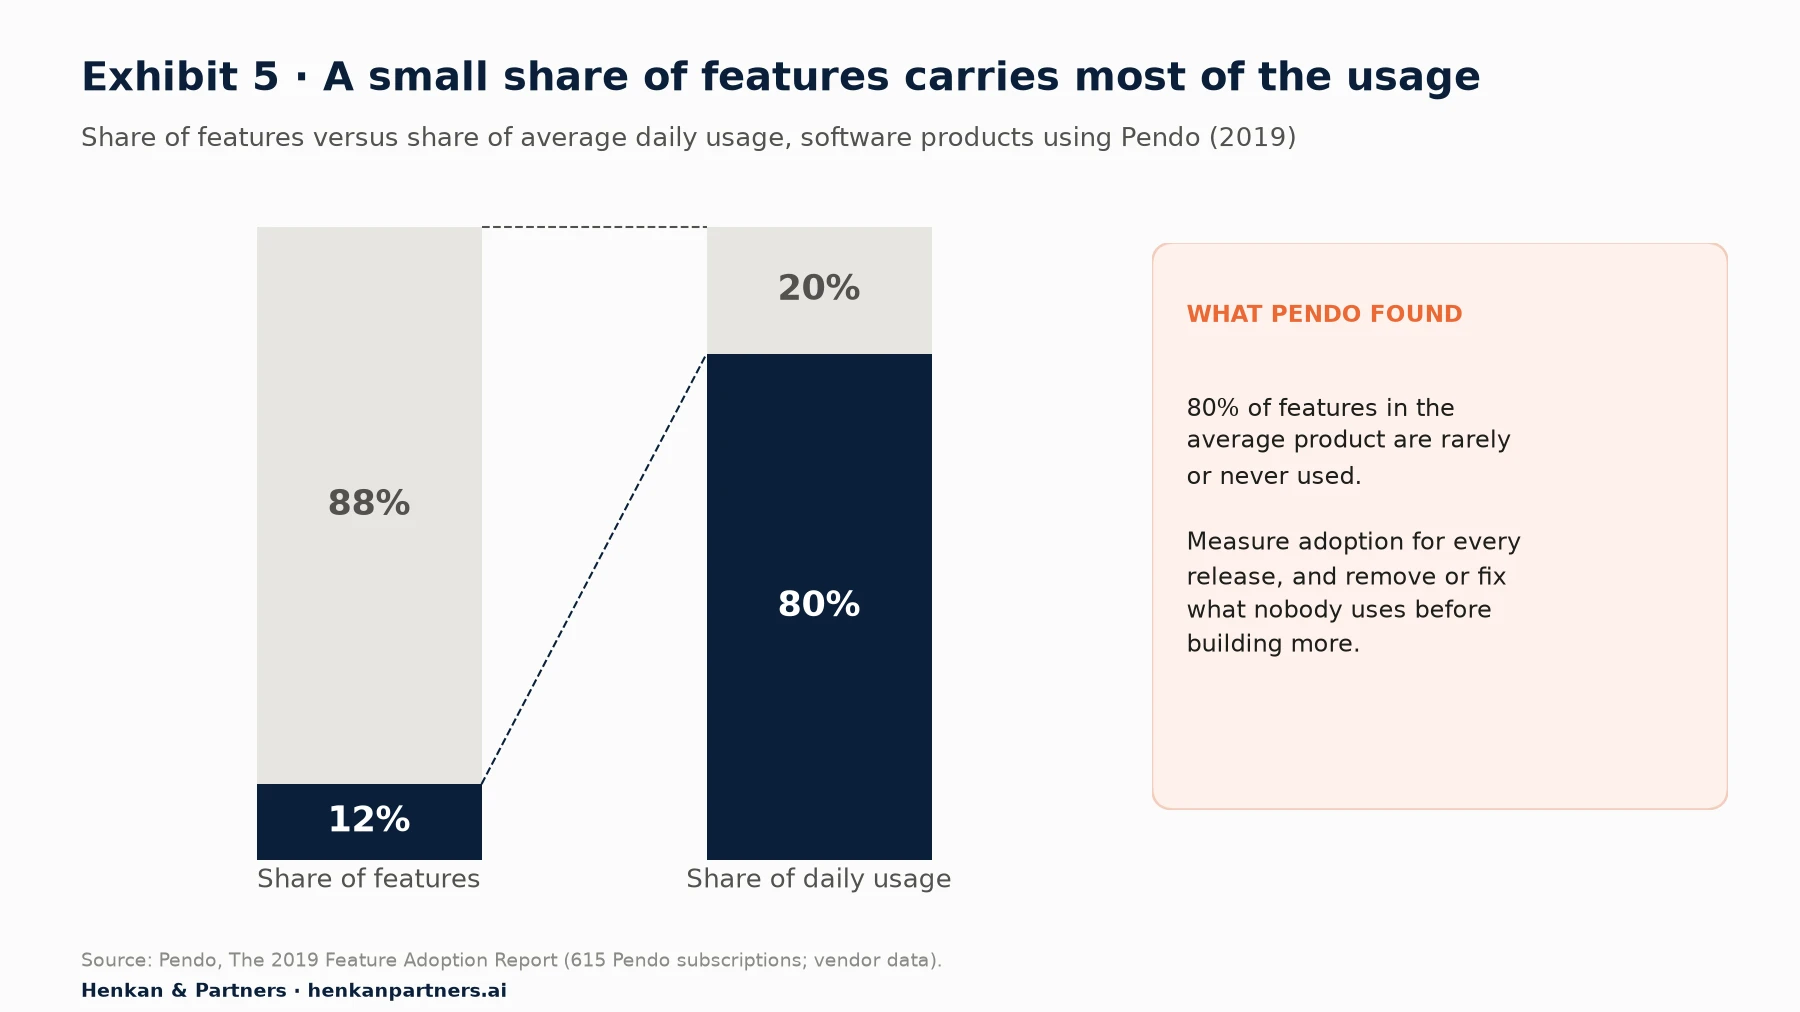
What this shows. Pendo found that 12% of features generated 80% of average daily usage and that 80% of features were rarely or never used. The data is from software products and is several years old, but the lesson carries over to e-commerce sites full of widgets, carousels and filters that few shoppers touch. Measuring adoption tells you what to improve, promote or remove.
Measure adoption in stages: exposure (saw it), first use (tried it), repeat use (came back to it), and impact on the outcome. Be careful with the last stage. Users who adopt a feature are usually more engaged to begin with, so comparing adopters with non-adopters shows correlation, not cause. When the decision matters, run an experiment (Section 11).
Section 7 · E-commerce and apps
In e-commerce, product analytics maps onto browse, add to bag, checkout and repeat purchase
Product analytics was built for software, but an online shop is a product too. The shopper's journey breaks into stages, and each stage has its own events, its own analysis and its own input metric.
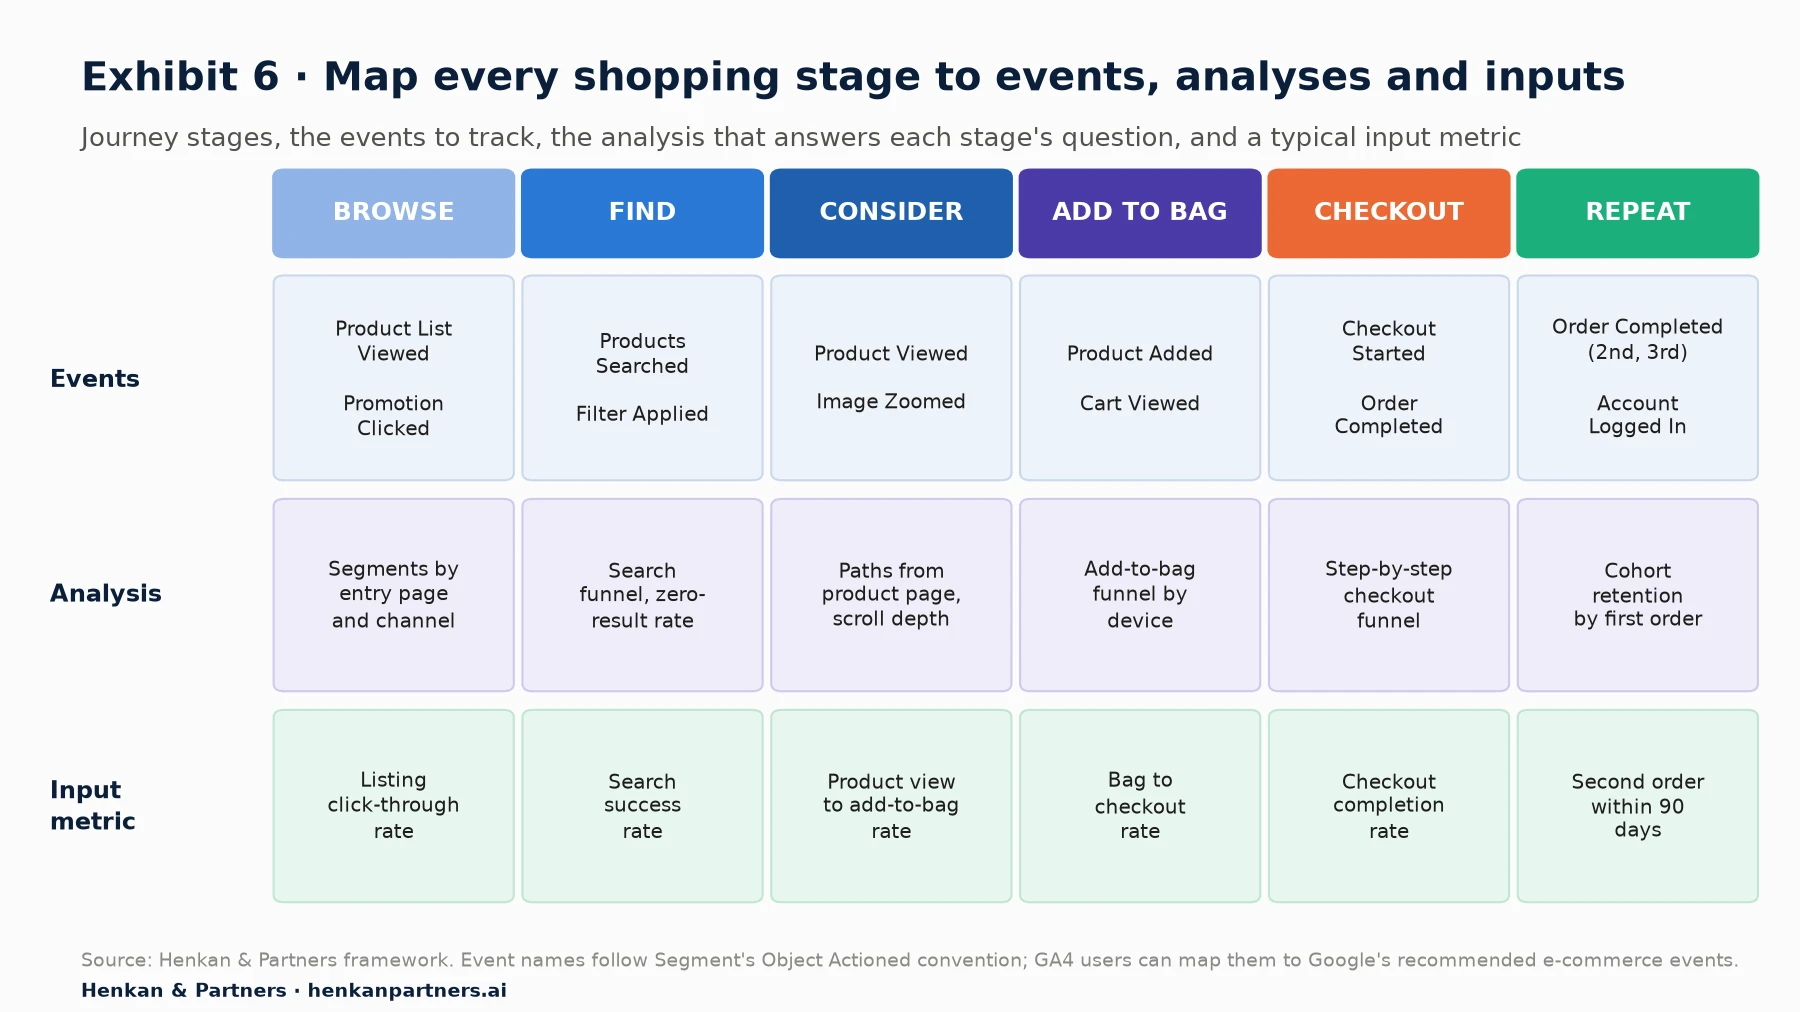
What this shows. Each stage answers a different question and needs a different analysis. Most retailers track the middle columns well, because GA4's e-commerce events cover them, and track the ends badly: what people do on listing pages and whether first-time buyers return. Those two ends are where product analytics adds the most over standard web analytics.
Browse and search
Listing pages and site search decide what a shopper ever sees. Track which lists and sort orders lead to product views, and measure search with a funnel from query to product view to add-to-bag. A high rate of zero-result searches, or searches followed by an exit, is one of the fastest wins in retail analytics.
Add to bag and checkout
The add-to-bag and checkout funnels are where money is most visibly lost. Baymard Institute's average documented cart abandonment rate is 70.22% across 50 studies. A funnel tells you at which step shoppers leave; it does not tell you why. Baymard's survey of US shoppers does.
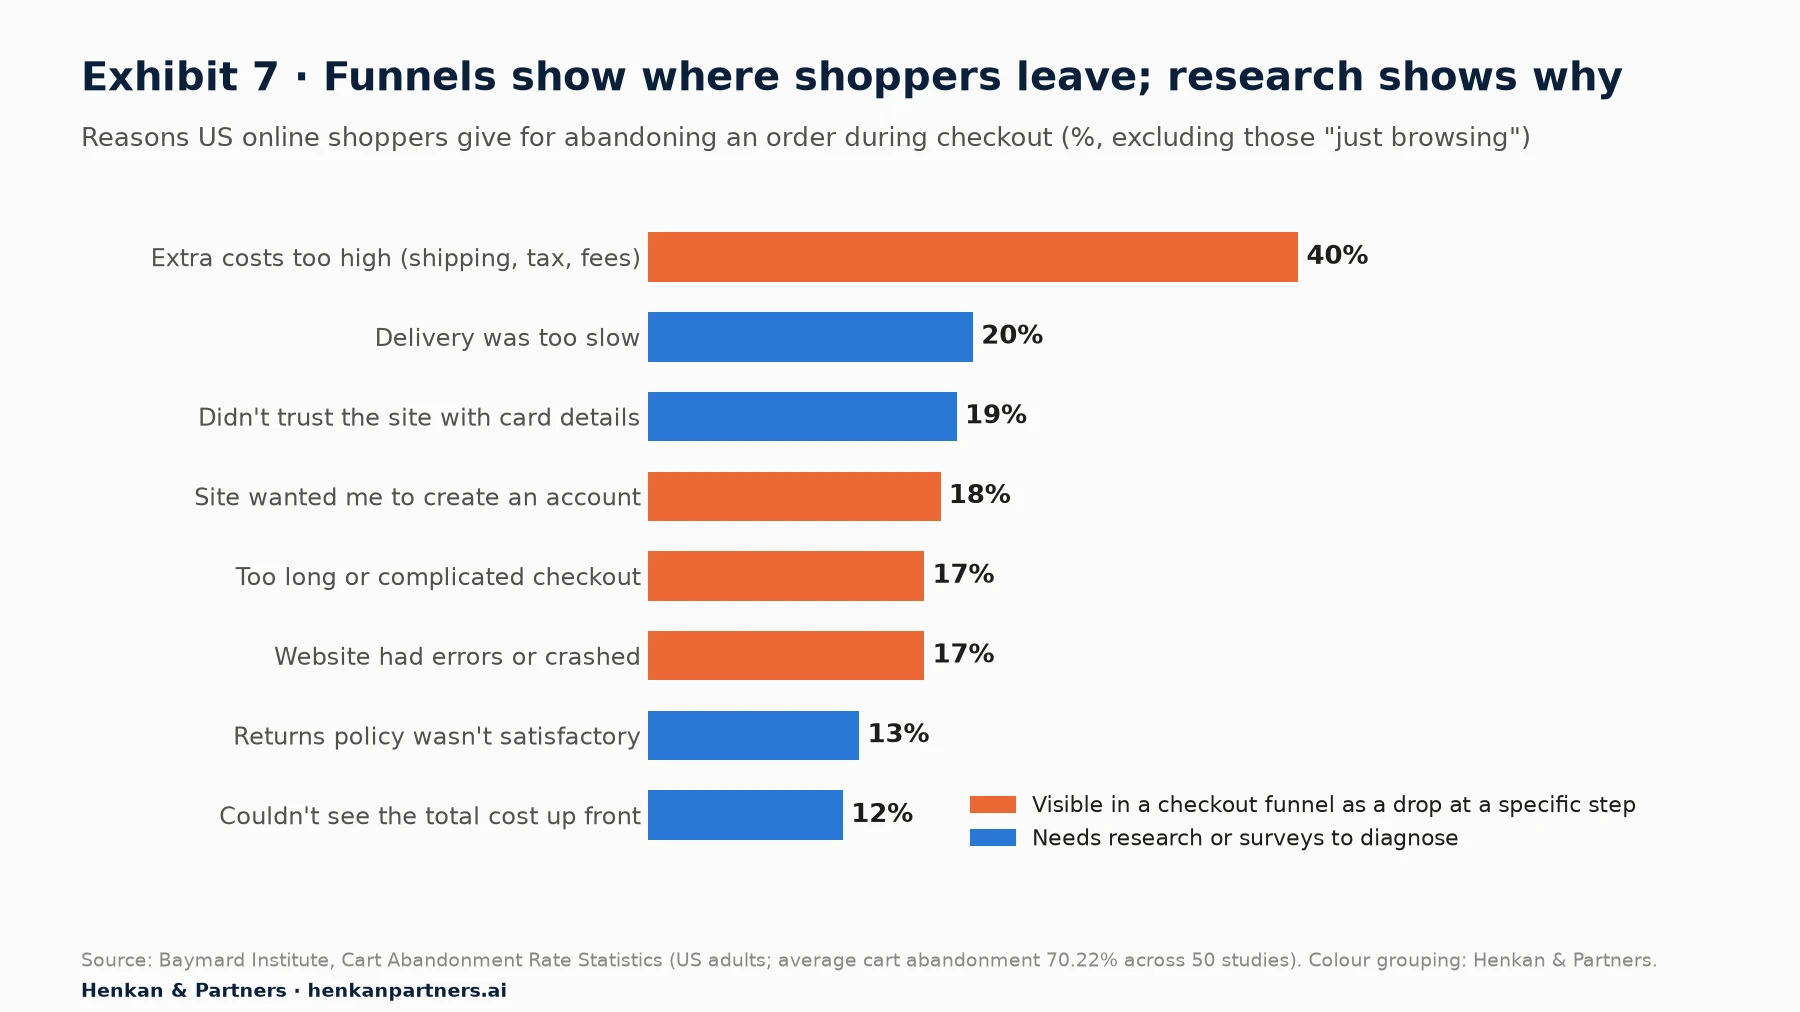
What this shows. Some causes leave a clear trace in product analytics: a drop at the shipping-cost step, at forced account creation or after a payment error. Others, such as trust or delivery speed, look like ordinary drop-off and need surveys, session replay or user research to diagnose. Baymard estimates that the average large e-commerce site can gain a 35.26% increase in conversion rate through better checkout design alone.
Repeat purchase
For most retailers the most valuable product analytics question is "what makes a first-time buyer buy again?". Build monthly cohorts by first order, measure the share placing a second order within 60, 90 and 180 days, and compare cohorts by first category, acquisition channel, discount used and whether the customer created an account. This is where identity resolution pays off: repeat purchase can only be measured if orders are tied to a stable customer ID.
Apps and the web together
Retailers with an app need one identity across app and web, or the same customer appears as two users and every retention figure is wrong. Track the app version as a property on every event, so you can see whether a release broke a funnel, and remember that, in our experience, app users tend to be a retailer's most engaged customers already: comparing app and web conversion without adjusting for that flatters the app. GA4 counts distinct event names differently for apps (up to 500 per app user) and has no such limit for web data streams, which is one more reason to keep a shared tracking plan.
For leaders. Ask for one chart every month: the share of first-time buyers who ordered again within 90 days, by month of first order. If newer cohorts are not doing better than older ones, your product work is not improving the customer experience, whatever the conversion rate says.
Section 8 · Tools
Product analytics tools in 2026: generous free plans, a consolidating market and a warehouse-native wave
Disclosure: Henkan & Partners works with several of the vendors named below and operates its own analytics platform, which is not covered here. No vendor reviewed this section.
The market has changed quickly. Contentsquare completed its acquisition of Heap on 7 December 2023. Optimizely agreed to acquire NetSpring, a warehouse-native analytics company, on 30 September 2024. OpenAI acquired the experimentation and analytics company Statsig in September 2025, and on 5 May 2026 Amplitude announced it would "take on Statsig's brand and customers" and "maintain and develop the current Statsig platform across the cloud and data warehouse". Free plans, meanwhile, have become generous enough for many mid-sized sites to start without a budget.
| Tool | Positioning | Free plan (as published, September 2026) | Worth knowing |
|---|---|---|---|
| Amplitude | Broad digital analytics platform: analytics, replay, experiments, guides | 2M events a month, 10K session replays, AI agents and MCP | Now also stewards Statsig's platform and customers |
| Mixpanel | Event analytics focused on speed and self-service | 1M events a month, 10K session replays, up to 10 feature flags | Warehouse Connectors free on paid event-based plans |
| PostHog | Open-source suite for product engineers: analytics, replay, flags, experiments, surveys | 1M events, 5K recordings, 1M flag requests a month | MIT licence (except enterprise code); US or EU cloud, or self-host |
| Heap by Contentsquare | Autocapture product analytics inside Contentsquare's experience platform | Up to 10K monthly sessions, 6 months' data retention | Paid tiers add Contentsquare's AI, Sense |
| Pendo | Product analytics plus in-app guides, mainly for software | 500 monthly active users | Priced by MAU and modules |
| Google Analytics 4 | Web and app analytics with explorations (funnel, path, cohort) | Free standard version | Explorations sampled above 10M events per query on standard properties |
| Optimizely Warehouse-native Analytics (ex-NetSpring), Kubit, Mitzu | Warehouse-native: analyse data where it already sits | Mitzu: 14-day trial; others on request | Mitzu prices by seats, with unlimited events |
Is Google Analytics 4 enough?
GA4 is a partial substitute. Its event-based model, funnel and path explorations and cohort exploration cover a lot of product analytics ground, and the BigQuery export gives you raw data. The limits show as questions get harder: 25 user properties per property, explorations sampled above 10 million events per query on standard properties, and interfaces designed more for marketing questions than for feature adoption or behavioural cohorts. Our explainer on how GA4 actually works covers these limits in detail. A common pattern is GA4 for acquisition and e-commerce reporting, plus a product analytics tool for journeys, retention and experiments, sharing one tracking plan.
Warehouse-native or packaged?
A packaged tool (Amplitude, Mixpanel, PostHog, Heap) collects events into its own storage and gives you fast, ready-made analyses. A warehouse-native tool leaves the data in your warehouse (Snowflake, BigQuery, Databricks, Redshift) and runs its analyses there as SQL. Optimizely presented the NetSpring deal as a way to tie experimentation and other digital experience activities to business metrics and outcomes held in customers' own warehouses. The line is blurring: Mixpanel's Warehouse Connectors can mirror warehouse tables into Mixpanel, and Amplitude's own warehouse-native option, which supported Snowflake only, is now documented as a legacy feature not available to new customers.
| Packaged product analytics | Warehouse-native product analytics | |
|---|---|---|
| Where data lives | Vendor's storage (a copy) | Your data warehouse (single copy) |
| Time to first insight | Days: install an SDK and start | Weeks: needs clean, modelled warehouse tables |
| Joining with business data | Import or sync orders, margins and returns | Native: returns, margin and CRM data are already there |
| Cost drivers | Event volume or MTUs | Seats plus your own warehouse compute |
| Best for | Teams without a data engineering function; fast self-service | Companies with a mature warehouse and data team; strict data residency |
| Watch out for | Two sources of truth that disagree | Slow queries and compute bills if tables are not modelled for event analysis |
Our view. Choose by who will ask the questions. If product managers and marketers must answer their own questions tomorrow, start packaged. If you already trust your warehouse and have analysts to model it, warehouse-native avoids a second copy of the truth. Either way, the tracking plan is portable; the tool is not.
Section 9 · Data quality and privacy
Trust depends on governance and consent, not on the tool
Data quality and governance
Product analytics fails quietly. A renamed button, a new checkout step or an SDK update can stop an event from firing, and nobody notices until a dashboard shows a miracle or a disaster. The fixes are procedural:
- One owner for the tracking plan, with a review step for every new or changed event.
- Tracking checked in QA before release, including on the app and on every checkout variant.
- Automated volume alerts on key events, so a sudden 40% drop in Order Completed is spotted within hours, not at month-end.
- A reconciliation routine: compare orders and revenue in analytics with the order system every week. A stable gap is normal; a changing gap is a bug.
- A change log that records every tracking change with its date, so trend breaks can be explained.
- Access rules and data retention set deliberately, not left at defaults.
Privacy and consent
Product analytics collects behaviour tied to individuals, often to a logged-in customer ID. In Europe that usually means consent. The French regulator CNIL, for example, exempts audience-measurement trackers from consent only under strict conditions, including limiting their purpose to audience measurement and A/B testing, not cross-checking the data with other processing such as customer files, keeping the tracker to a single site or application publisher, truncating the last byte of the IP address and limiting tracker lifetime to 13 months. CNIL itself notes that most large audience measurement offerings do not fall within the exemption. Joining behaviour to a CRM profile, which is exactly what makes product analytics powerful, takes you outside it.
Practical consequences: plan for incomplete data from users who refuse consent, keep personal data out of event properties (no email addresses in event names or URLs), choose data residency deliberately (PostHog, for example, offers an EU cloud, and Mixpanel runs US, EU and India regions), and document what you collect in your privacy notice. Our focus on web analytics for product designers covers consent from the UX side.
Section 10 · AI
AI makes product analytics conversational, but only on governed data
Three changes are under way, and all three are already in vendors' products.
Asking questions in plain language
Several leading tools now let you type a question and get a chart. On its free plan Amplitude lists AI agents and MCP, and Heap's paid tiers include Contentsquare's AI, Sense. For occasional users this removes the biggest barrier to product analytics: knowing how to build the chart.
AI agents that monitor and analyse
In February 2026 Amplitude announced a "Global Agent" and specialised agents for dashboard monitoring, session replay, web experimentation and AI feedback; its CEO described it as "the first fully autonomous analytics agent". Pendo lists Novus, an AI-native product in free beta, with continuous monitoring, proactive Slack recommendations and auto-instrumentation via GitHub. Mitzu describes itself as "an agentic analytics platform that answers business questions, monitors KPIs, and runs deep analysis autonomously".
MCP servers: your analytics inside any AI assistant
The Model Context Protocol (MCP) is an open standard that lets AI assistants connect to outside tools and data. Product analytics vendors have adopted it quickly:
- Mixpanel's MCP server lets assistants "query events, funnels, flows, retention, session replays, and more using natural language", and lists clients including Claude, ChatGPT, Codex, Gemini CLI, Cursor, Microsoft Copilot and Notion. It is limited to 600 requests an hour per user and does not currently support HIPAA requirements.
- PostHog's MCP server lets agents query analytics, run HogQL, manage feature flags and experiments and debug errors from tools such as Claude Code, Cursor, VS Code and Codex.
- Amplitude's MCP server brings its behavioural data into tools including Claude and Cursor, and works with any MCP client.
- Kubit, a warehouse-native tool, positions itself as "product analytics for agents and users" and offers to "embed product analytics into your AI workflows via MCP".
What can go wrong
An AI assistant is only as accurate as the event definitions it reads. If Checkout Started fires twice on one of your checkout variants, the agent will report a confident and wrong funnel. Four rules help:
- Govern first. A clean tracking plan with descriptions for every event and property is now also your AI's instruction manual.
- Check the query, not only the answer. Ask the assistant which events, filters and date ranges it used.
- Treat findings as hypotheses. An AI can find correlations faster than any analyst; it cannot turn them into causes. That still needs an experiment.
- Control access. An MCP connection gives an assistant the permissions of the user who connected it. Apply the same data access rules you apply to people.
Section 11 · Experiments and pitfalls
Product analytics finds the problems, experiments prove the fixes, and ten habits undo both
From insight to experiment
Product analytics tells you where users struggle and which behaviours go with success. It cannot tell you whether a change will cause an improvement, because the users who behave one way differ from those who do not. A randomised A/B test can. The combination is powerful: analytics chooses what to test and supplies the metrics; the experiment gives the causal answer; analytics then tracks whether the effect lasts.
Small changes can be worth a lot. In Harvard Business Review, Ron Kohavi and Stefan Thomke describe a Bing experiment on how ad headlines were displayed that "increased revenue by an astonishing 12%—which on an annual basis would come to more than $100 million in the United States alone". Nobody would have found that change by staring at dashboards; it took a test.
Vendors have noticed. Amplitude's free plan includes feature flags and web experimentation, Mixpanel's includes experiments and feature flags, and PostHog bills experiments together with feature flags. Running experiments on the same events as your analytics removes a whole class of "the test tool and the analytics tool disagree" problems. Our Essential Guide to A/B Testing explains how to run tests you can trust.
Common mistakes
| Mistake | What happens | How to avoid it |
|---|---|---|
| Tracking everything | Thousands of events, nobody knows which to use | Start with 15 to 30 events tied to questions; add on demand |
| No tracking plan | Duplicate and inconsistent events; broken trends | One owner, one naming convention, a review step |
| Ignoring identity | Users counted twice across devices, or merged on shared devices | Define login, logout and cross-device rules before launch |
| Averages only | Mix shifts look like product changes | Split by device, channel and new versus returning users |
| Vanity metrics | Page views and clicks rise while orders do not | Tie every metric to the North Star or a guardrail |
| Adopters versus non-adopters | Engaged users adopt more, so features look causal | Use randomised experiments for decisions that matter |
| Short retention windows | Judging a retail change by 7-day return visits | Match the window to the purchase cycle; use repeat orders |
| Unchecked releases | A release silently breaks key events | QA tracking and set volume alerts on key events |
| Consent blind spots | Numbers drop when consent rules change | Know your consent rate and annotate changes |
| Trusting AI answers unchecked | Confident but wrong funnels | Check the query; validate against a known number |
Section 12 · What to do next
What to do next: five steps to useful product analytics
1. Write down the ten questions you need answered
Start from decisions, not data. List the questions your product, e-commerce and marketing teams will ask in the next six months, such as "why do mobile shoppers abandon at delivery?" or "do customers who use the size guide return less?". Each question becomes a funnel, a cohort or a segment.
2. Agree a North Star and three to five inputs
Choose a North Star that reflects customer value, map it to input metrics each team can move, and add guardrails. Put the definitions in writing and get sign-off from product, marketing and finance.
3. Build and enforce a tracking plan
Define 15 to 30 events with one naming convention, set up identity resolution, and put tracking into the definition of done. Reconcile orders and revenue with your order system every week.
4. Pick a tool on a free plan and run the core analyses
Start with a free plan, build your main purchase funnel, a monthly repeat-purchase cohort and a feature adoption report for the next release. Decide between packaged and warehouse-native once you know which questions matter most. Our guide for product owners and guide for product designers show how each role can use the results.
5. Turn the biggest drop-off into an experiment
Take the largest, most valuable drop in your funnels, form a hypothesis, and test it. Then connect an AI assistant to your governed data to speed up the next round of questions. If you want a second opinion on your tracking plan, data model or tool choice, talk to us.
FAQ
Frequently asked questions about product analytics
Frequently asked questions
What is product analytics?
Product analytics is the collection and analysis of the actions people take inside a digital product, recorded as time-stamped events tied to individual users. It shows how people use features, where they drop out of key journeys and whether they come back, so teams can decide what to build, fix or remove.
What is the difference between product analytics and web analytics?
Web analytics focuses on sessions, pages and traffic sources: where visitors come from and whether they convert. Product analytics follows individual users over time through events, funnels, cohorts and retention. Many companies use both, typically Google Analytics 4 for acquisition and a tool such as Amplitude, Mixpanel or PostHog for product questions.
What is cohort analysis?
Cohort analysis groups users by a shared starting point, such as the month of their first order, and tracks what share of each group comes back or buys again in later periods. Comparing cohorts shows whether the product or shopping experience is improving over time.
What is funnel analysis?
Funnel analysis measures the share of users who complete a defined sequence of steps, such as product view, add to bag, checkout and order, and where they drop out. In product analytics tools the funnel follows the same users in order within a conversion window you choose.
What are the best product analytics tools?
Widely used product analytics tools in 2026 include Amplitude, Mixpanel, PostHog, Heap (part of Contentsquare) and Pendo, with warehouse-native options such as Optimizely Warehouse-native Analytics (formerly NetSpring), Kubit and Mitzu. Google Analytics 4 covers some product analytics needs. The best choice depends on who will ask the questions, your data volume and whether you already run a data warehouse.
What is a North Star metric?
A North Star metric is the single measure that best captures the value customers get from your product and links it to the revenue the business earns. Amplitude's North Star framework pairs it with three to five input metrics that teams can influence directly.
What is a good retention rate?
It depends on the industry and the definition. In Amplitude's 2025 benchmark (vendor data), the median product retained 3.8% of new users at month 3 and the top 10% retained 18.5%; in e-commerce the figures were 2.8% and 18.9%. Compare yourself with your own past cohorts first.
What is DAU/MAU and what is a good stickiness ratio?
DAU/MAU divides average daily active users by monthly active users and shows how often active users return. Mixpanel's 2026 benchmarks (vendor data) put e-commerce at about 20 to 25% depending on region and B2B SaaS at about 31% in North America and EMEA.
Do I need consent for product analytics in Europe?
Usually yes. Regulators such as France's CNIL exempt analytics trackers from consent only under strict conditions, including not combining the data with other processing such as customer files. Product analytics that ties behaviour to logged-in customers generally falls outside that exemption.
Key terms
- Event
- A single recorded user action, such as Product Added, with a timestamp and properties. Events are the raw material of every product analytics report.
- Property
- A key-value pair that describes an event (price, list name) or a user (loyalty tier). Properties let you slice any metric without creating extra events.
- Identity resolution
- Joining anonymous activity on a device with a known user after login. Without it, the same customer counts as several users and retention is wrong.
- Tracking plan
- A shared document listing every event and property, when it fires and why. It keeps data consistent and makes it understandable to people and AI assistants.
- Funnel analysis
- Measuring the share of users who complete a sequence of steps and where they drop out. It shows where to focus improvement work.
- Cohort
- A group of users who share a starting point, such as the month of their first order. Cohorts show whether behaviour improves over time.
- Retention
- The share of users from a cohort who are still active, or buy again, in a later period. It is the clearest sign of lasting value.
- Retention curve
- A chart of a cohort's retention over time. A curve that flattens shows a core of users who keep finding value.
- Stickiness (DAU/MAU)
- Average daily active users divided by monthly active users. It shows how habitual a product is, which matters more for apps than for most shops.
- Feature adoption
- The share of active users who use a feature in a period. It is the first test of whether a release was worth building.
- North Star metric
- The one measure that best links customer value to revenue. It aligns teams on a shared outcome.
- Input metric
- A metric a team can move directly that drives the North Star, such as checkout completion rate. It turns strategy into team goals.
- Warehouse-native analytics
- Analytics that runs queries on data in your own warehouse rather than a vendor's copy. It avoids duplicate data but needs well-modelled tables.
- Model Context Protocol (MCP)
- An open standard that lets AI assistants connect to tools and data. Analytics MCP servers let assistants query your product data in plain language.
Sources
Methodology. This guide was researched in September 2026 from vendor documentation and pricing pages, company press releases, regulator guidance (CNIL), Baymard Institute research and Harvard Business Review. Every source was opened and checked in September 2026. Benchmarks from Amplitude, Mixpanel, Pendo and Baymard are vendor data drawn from their own customer bases or panels and use their own definitions. Exhibits 1, 2 and 6 are Henkan & Partners frameworks or illustrations and contain no measured data; the colour grouping in Exhibit 7 is ours. Free-plan limits and product features change often; check vendor pages before deciding.
- Amplitude (2025). The 7% Retention Rule Explained.
- Amplitude (2025). The Hidden ROI of Winning Back Users.
- Amplitude (2025). The Product Benchmarks Every Retail and Ecommerce Company Should Know.
- Amplitude (2025). The Product Benchmarks Every Financial Services Company Should Know.
- Amplitude (2025). The Product Benchmarks Every B2B Technology Company Should Know.
- Amplitude (n.d.). Every Product Needs a North Star Metric.
- Amplitude (2026). Pricing.
- Amplitude (2026). Amplitude Introduces Agentic AI Analytics for the Next Era of Product Experiences.
- Amplitude (2026). Amplitude brings behavioral data into AI tools with MCP launch.
- Amplitude (2026). Amplitude and Statsig partnership.
- Amplitude (n.d.). Warehouse-native Amplitude: Overview.
- Statsig (2025). Statsig is joining OpenAI.
- Mixpanel (2026). Monthly active users (MAU): Definition, formula, and 2026 benchmarks.
- Mixpanel (2026). State of Digital Analytics 2026.
- Mixpanel (2026). Pricing.
- Mixpanel Docs (2026). Identifying Users (Simplified).
- Mixpanel Docs (2026). Group Analytics.
- Mixpanel Docs (2026). Warehouse Connectors.
- Mixpanel Docs (2026). Mixpanel MCP Server.
- PostHog (2026). Pricing.
- PostHog (2026). Model Context Protocol (MCP).
- PostHog (2026). PostHog repository and licence.
- Heap (2026). Pricing.
- Heap (2026). Heap homepage.
- PostHog (2026). Autocapture.
- Contentsquare (2023). Contentsquare Completes Acquisition of Heap.
- Pendo (2026). Pricing.
- Pendo (2019). The 2019 Feature Adoption Report.
- Optimizely (2026). Netspring is now Optimizely Warehouse-native Analytics.
- Optimizely (2024). Optimizely enters definitive agreement to acquire NetSpring.
- Kubit (2026). Kubit: Product Analytics for Agents and Users.
- Mitzu (2026). Pricing.
- Twilio Segment (2026). Data Collection Best Practices.
- Google (2026). Event collection limits, Analytics Help.
- Google (2026). About data sampling, Analytics Help.
- Google (2026). Cohort exploration, Analytics Help.
- CNIL (n.d.). Sheet n°16: Use analytics on your websites and applications.
- Baymard Institute (2026). Cart Abandonment Rate Statistics.
- Kohavi, R. and Thomke, S., Harvard Business Review (2017). The Surprising Power of Online Experiments.