Point of View
Voice of Customer: The Missing Layer in Every Optimization Strategy
Alexandre Suon · 2025-01-10
Most optimization teams know exactly where customers leave and almost nothing about why. Voice of Customer research is the missing layer that turns analytics and A/B testing into real improvements. Here is the evidence, the methods and a 30-day plan to start.
Executive summary
- Optimization teams measure behaviour but rarely understand customers. Analytics shows where people drop off; A/B tests show which version won. Neither says why. Voice of Customer (VoC), the customer's own account of what they wanted and what stopped them, supplies that missing why.
- Most test ideas fail, which points to weak inputs rather than weak tools. Published data puts the share of experiments that win at roughly 10% to 33%. Optimizely's analysis of 127,000 experiments found only 12% produced a significant improvement on the main metric. Better hypotheses, grounded in real customer problems, are the cheapest way to raise it.
- Customers already tell you why they leave. Baymard Institute's survey of US shoppers finds the top reasons for abandoning checkout are extra costs (40%), slow delivery (20%), not trusting the site with card details (19%) and forced account creation (18%). Your funnel report shows the exit; only customer feedback names the reason.
- The fix is method, not more feedback. Surveys capture what people are willing to say. Watching real tasks, asking about specific past purchases and studying why people chose competitors reveal the worries that drive decisions.
- In 2026, AI makes open-text analysis cheap, but not the listening. Large language models can now cluster thousands of support tickets, reviews and survey answers into themes in hours. They should speed up hypothesis generation. Synthetic users can help frame questions, but they never replace real customers.
- You can start in 30 days with the data you already have. A shared spreadsheet of verbatims, one exit poll, five think-aloud sessions and five interviews are enough to produce a sized list of customer problems and a first VoC-led test. Programmes that keep this loop running build a compound advantage.
Section 1 · The basics
Voice of Customer explains the why that analytics and A/B tests cannot see
Voice of Customer (VoC) is the systematic collection and analysis of customers' own words about what they need, what they expect and what gets in their way, used to decide what to change in a product, a service or a website.
A modern optimization stack answers three questions well. Web and product analytics answer where: which page, which step, which segment. Session replay and heatmaps answer how: where people clicked, scrolled or hesitated. A/B testing answers which: which version performed better. None of them answers why. Why did a shopper who filled a basket leave at the delivery step? Why did a visitor read the returns page three times and then go?
Voice of Customer is the layer that answers that question in the customer's own words. It is not one tool. It is a discipline that combines existing sources of feedback (support tickets, live chat, reviews, sales conversations) with research you commission (surveys, interviews, usability tests). The table below shows how the layers fit together.
| Layer | Question it answers | Typical sources | What it misses |
|---|---|---|---|
| Analytics | Where do people drop off, and how many? | Google Analytics 4, Adobe Analytics, product analytics | The reason behind the drop-off |
| Experience analytics | How did people behave on the page? | Session replay, heatmaps, form analytics | What the person was thinking or worried about |
| Experimentation | Which version performs better? | A/B and multivariate tests | Why the winner won, and what to test next |
| Voice of Customer | Why do people act the way they do? | Tickets, chats, reviews, surveys, interviews, usability tests | How many people are affected (until linked to analytics) |
The last row matters. VoC on its own tells you about individuals; analytics on its own tells you about crowds. The value comes from joining them: a worry heard in ten interviews becomes a priority when analytics shows that thousands of visitors leave at the step where that worry arises.
Conversion practitioners have long put customer research at the centre of the process. The ResearchXL model published by CXL, for example, lists qualitative surveys and user testing alongside analytics and heuristic review as core steps of conversion research before any test is run. In practice, many teams skip those steps because the testing tool is already paid for and the backlog is already full.
Section 2 · The quantification fallacy
Measuring behaviour is not the same as understanding customers, and test results prove it
Modern optimization descends from direct-response marketing, where everything reduces to a measurable action. That heritage carries a hidden assumption: that customer behaviour equals customer truth. But behaviour is the shadow cast by what people think and feel. It shows what happened, not why it happened, and certainly not what might have happened under different conditions. We call this the quantification fallacy.
It shows up in the way most teams work. They find a leak in the funnel: a large share of visitors leave at the shipping step. They guess that the form is too long, shorten it, test it and celebrate a small improvement. They never ask what those customers were trying to achieve, and why the experience failed them.
It also shapes the testing roadmap. High-traffic pages get attention because they reach significance quickly. Elements that are easy to change (buttons, headlines, images) fill the backlog. Deep customer worries that do not show up as a single measurable click go unaddressed. The programme becomes increasingly sophisticated at solving increasingly trivial problems.
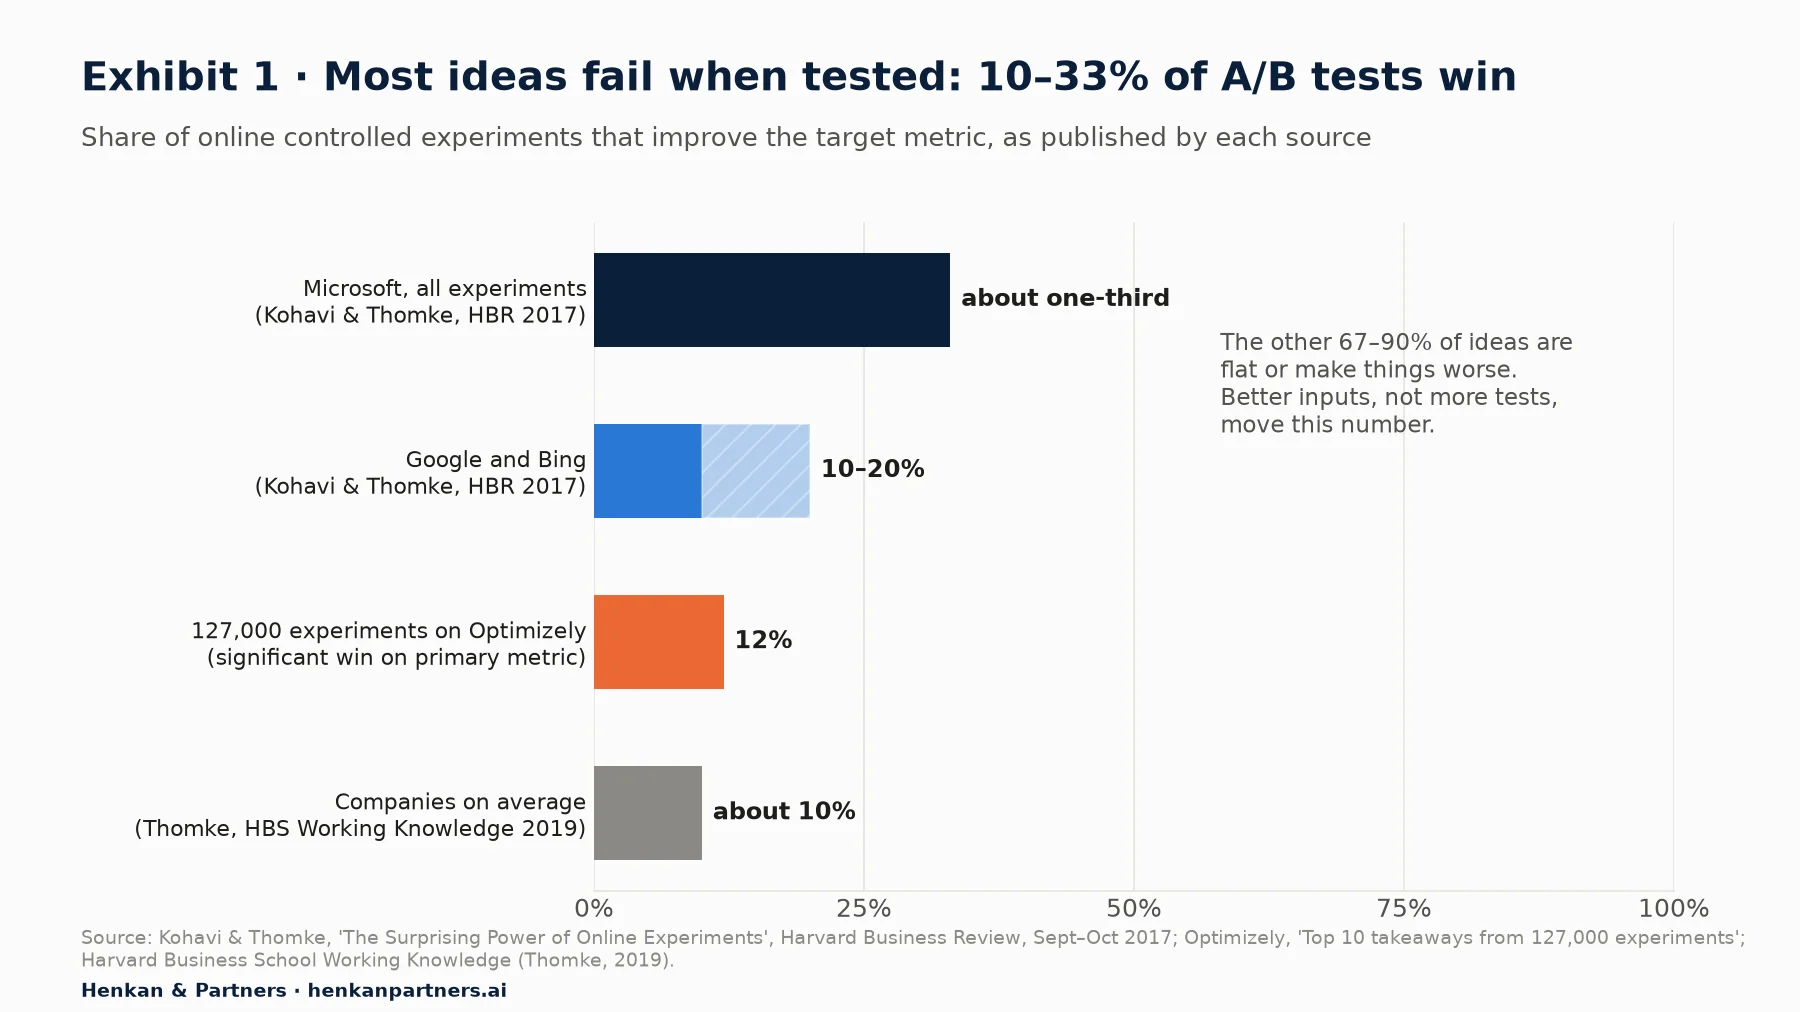
What this shows. Even at the most experienced testing organisations in the world, most ideas do not work. In their 2017 Harvard Business Review article, Ron Kohavi and Stefan Thomke report that at Microsoft about one-third of experiments prove effective, one-third are neutral and one-third are negative, and that at Google and Bing only about 10% to 20% generate positive results. Optimizely's analysis of 127,000 experiments found that only 12% produced a statistically significant improvement on the primary metric. The rest were flat or worse.
A low win rate is not a failure of experimentation: testing exists because intuition is so often wrong. But the numbers carry a clear message: the quality of the idea going into the test is the main constraint on what comes out. More tests on weak ideas produce more flat results.
This is where the fallacy becomes expensive. Teams can reach 95% statistical significance while remaining close to 0% confident about what actually drives customer decisions. They treat the richest data source available, customers explaining in their own words what they need to buy with confidence, as anecdote. We call this optimization theatre: rigorous measurement of changes nobody had a good reason to make.
For practitioners. Before adding a test to the backlog, ask which customer problem, in the customer's words, it addresses. If nobody can quote a verbatim or point to an observed struggle, the idea is a guess. Guesses can be tested, but should not crowd out ideas with evidence.
For leaders. Judge an experimentation programme on the share of its tests that start from documented customer evidence, not only on the number of tests run. Volume without insight mostly buys flat results.
Section 3 · The evidence
Customers already say why they abandon, and most reasons are worries a funnel report cannot name
Baymard Institute, an independent e-commerce usability research firm, maintains the most cited set of numbers on cart abandonment. Averaging 50 studies, it puts the documented online shopping cart abandonment rate at 70.22%. Seven in ten baskets are left behind.
Many of those shoppers were never going to buy: Baymard notes that a large share of US shoppers abandon because they were "just browsing" or not ready to buy. Its survey therefore asks shoppers who abandoned during checkout for their other reasons. Exhibit 2 shows the answers.
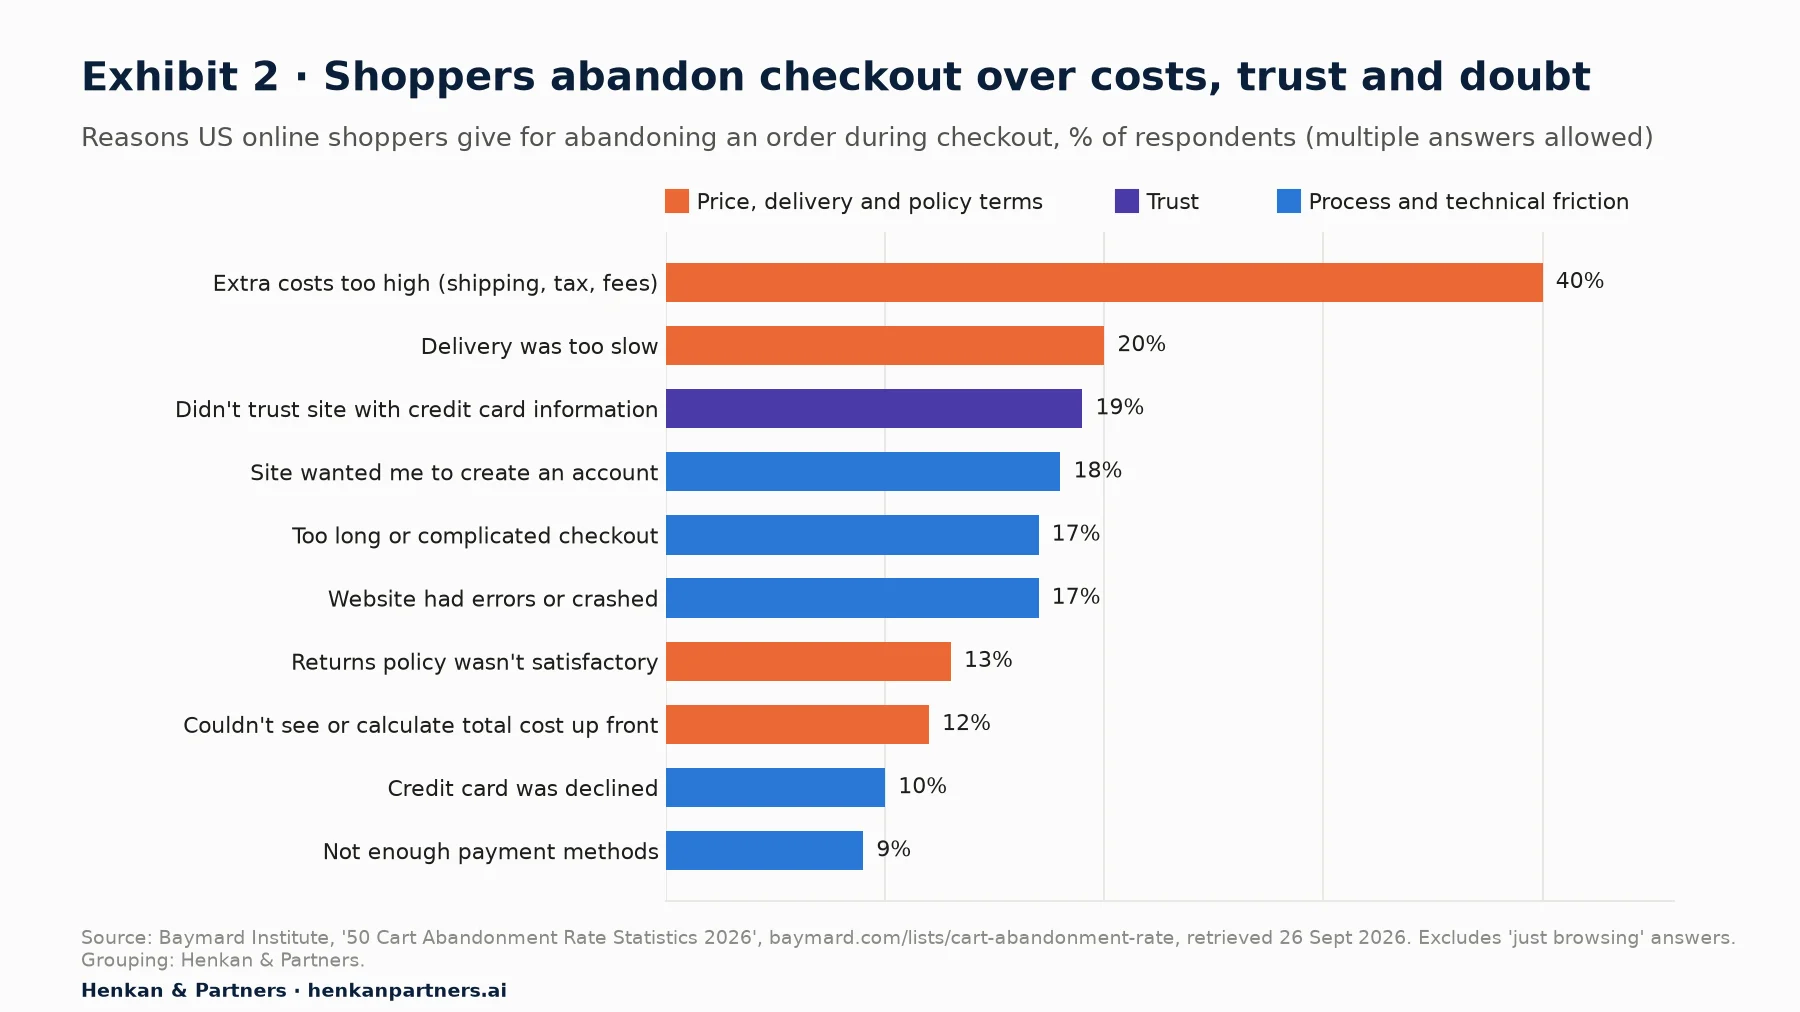
What this shows. The leading reasons are about money, time and trust, not about page design. Extra costs such as shipping, tax and fees (40%), slow delivery (20%), not trusting the site with card details (19%), an unsatisfactory returns policy (13%) and not seeing the total cost up front (12%) are all worries about the terms of the deal. Process friction (account creation, long checkouts, errors) matters too, but a button colour test addresses none of these reasons.
A funnel report shows a sharp drop between the basket and the payment step. It cannot tell you whether those people left because shipping appeared at the last minute, because delivery would arrive after the birthday, because the returns terms were unclear or because the site asked them to create an account. Each of those causes needs a different fix. Only asking customers, or watching them, tells you which one applies to your site.
Baymard also estimates, from ten years of large-scale checkout testing, that the average large e-commerce site could gain a 35.26% increase in conversion rate through better checkout design alone. The figure for any one site will differ, but it shows how much value sits in problems customers see and dashboards do not.
The broader picture is consistent. Published benchmarks put average retail e-commerce conversion rates in the low single digits: Smart Insights, summarising Dynamic Yield data from more than 400 brands, reports an overall rate of about 2.9%. More than 95 visitors in 100 leave without buying. Some of that is unavoidable. Much of it is a list of unanswered questions.
For practitioners. Run Baymard's reasons as a checklist against your own site, then check each one with your own customers. An exit poll on the checkout asking "What stopped you from completing your order today?" will tell you in a week which of these reasons dominate for you.
For leaders. Most abandonment reasons are commercial (delivery promise, fees, returns policy), not cosmetic. VoC findings often land on decisions owned outside the digital team, which is why a VoC program needs an executive sponsor.
Section 4 · The architecture of ignorance
Organisations filter out customer insight through silos, tools and culture before it reaches the test backlog
Organisations do not choose ignorance. They build it, through structures, technology choices and habits that filter out customer insight before it can influence what gets tested. This architecture of ignorance works so smoothly that most companies do not notice what they are missing. They mistake the poverty of their inputs for the totality of available information.
Organisational silos
Customer insight enters through many doors (tickets, sales calls, reviews, social media, surveys), and each leads to a different department. Customer service categorises complaints for operational efficiency, not for optimization. Sales logs objections to improve its pitch, not the website. Marketing celebrates positive reviews without asking which worries those customers overcame. Each department owns a piece of customer intelligence, but nobody owns customer understanding.
Technological filters
The tools that capture feedback often strip out its value. Surveys force answers into predefined categories and lose the nuance. Sentiment scores reduce complex feelings to positive or negative. Chatbots steer conversations towards closing the ticket rather than learning why it was opened. Dashboards report a satisfaction score but not the sentence that explains it. The technology built to manage customer contact ends up preventing customer understanding.
Cultural blindness
Optimization culture has developed antibodies against qualitative evidence. "Anecdotal" becomes an insult; "subjective" means unreliable. Teams demand data while treating customers' own explanations as less valid than behavioural proxies. The concern behind this is legitimate: small samples and biased questions do mislead. But rejecting qualitative evidence altogether throws away the signal with the noise, and replaces real understanding with false precision.
Section 5 · Methods
The best VoC methods watch real behaviour or recall specific past events, instead of asking for opinions
Traditional VoC programmes often disappoint because they capture what customers are willing to say in a structured format, not what they thought at the moment of decision. Post-purchase surveys yield polite answers shaped by the wish to seem reasonable. Reviews attract the delighted and the furious and miss the undecided majority whose choices decide growth.
The research on this is old and consistent. In a 2001 article that remains a reference, Jakob Nielsen of the Nielsen Norman Group summarised the rule as: watch what people actually do, do not believe what people say they do, and definitely do not believe what people predict they may do in the future. He cited an analysis of 113 interface comparisons in which the correlation between measured performance and stated preference was only 0.44. People are not lying; memory is fallible, and people rationalise their own behaviour.
The answer is not to stop listening. It is to collect a different kind of feedback, through methods that get past surface answers. Exhibit 3 places the main methods on two axes: whether they capture what people say or what they do, and whether they answer why (qualitative) or how many (quantitative).
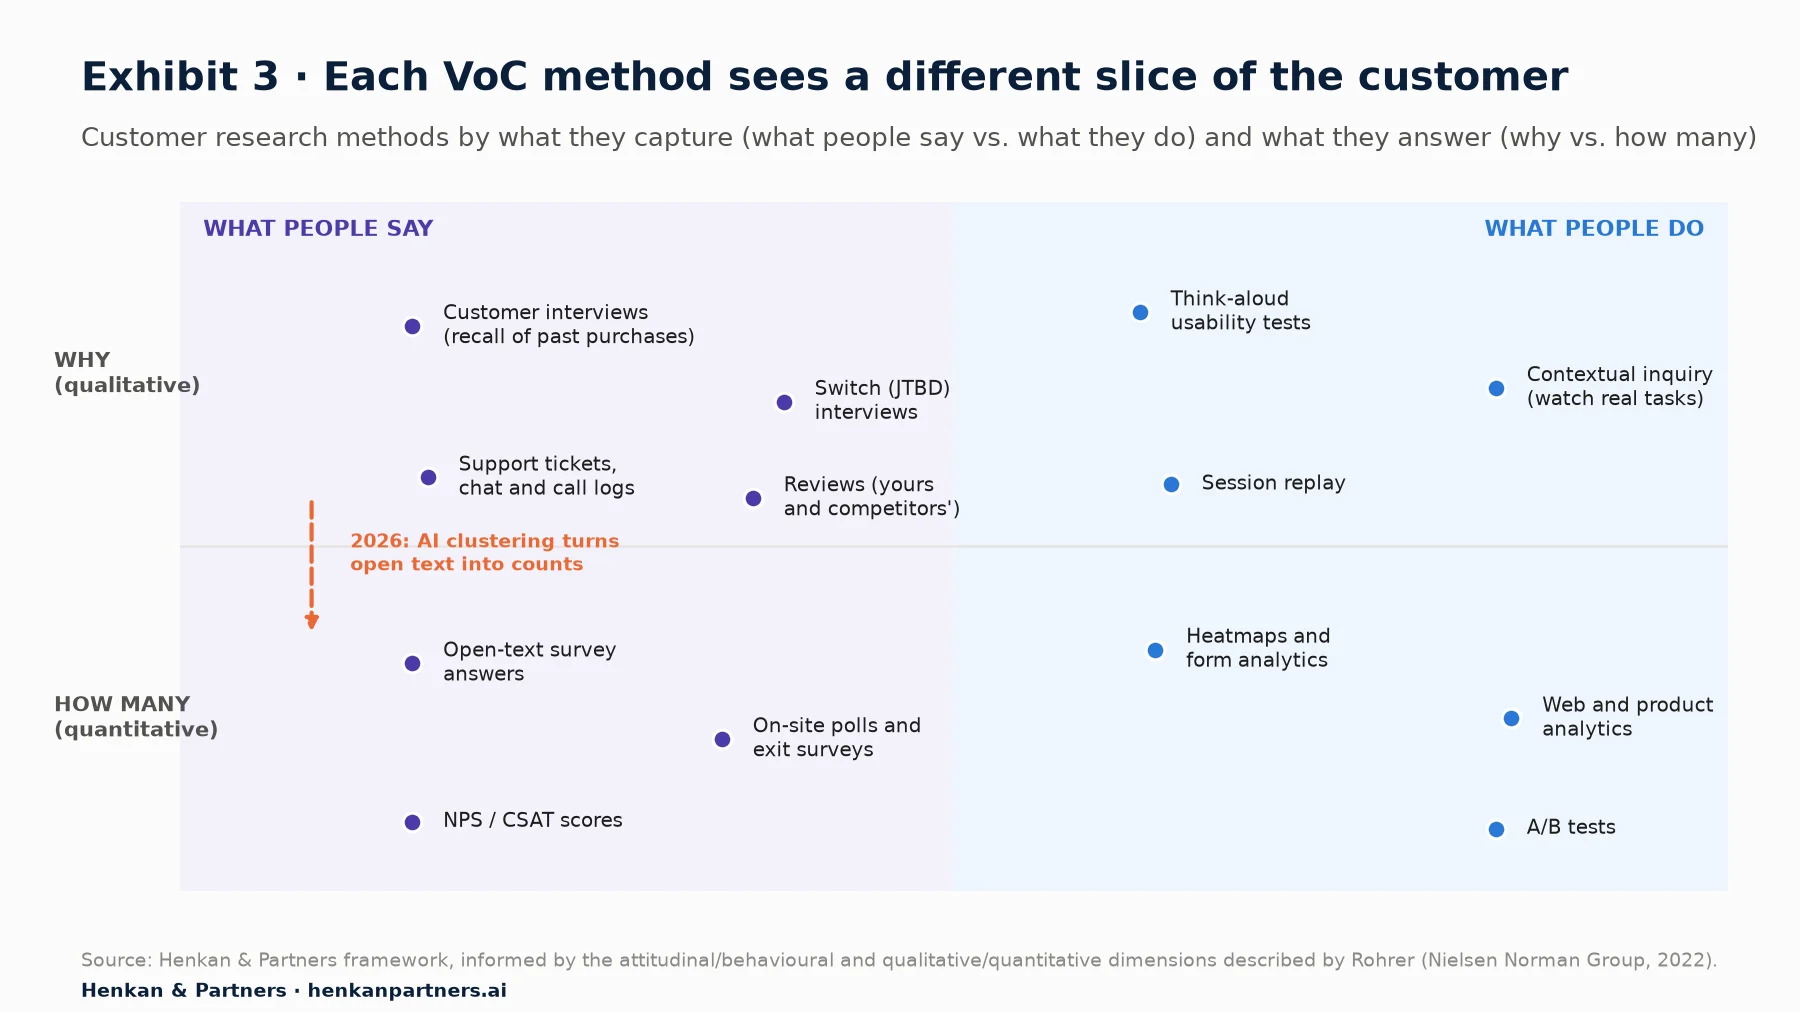
What this shows. Most optimization programmes live in the bottom-right corner: behavioural and quantitative. They count what people do. The top half, where the reasons live, is often empty. A balanced VoC program needs at least one method from each quadrant, so that every theme heard in words can be sized in numbers and every drop-off seen in numbers can be explained in words. The dimensions follow those described by Christian Rohrer in the Nielsen Norman Group's widely used overview of UX research methods; the placement is our own.
Contextual inquiry and think-aloud testing
Rather than asking customers to remember and summarise their experience, capture their thoughts during a real purchase attempt. In a think-aloud test, participants use the site while saying what they are thinking. Nielsen calls it possibly the single most valuable usability method: it is cheap, robust even when run imperfectly, and a handful of participants is enough. His well-known model suggests that five users find about 85% of usability problems in a design. A customer may not remember pausing at the delivery options, but hearing them say "I'm not sure this will arrive before Friday" at that moment tells you exactly what to fix.
Contextual inquiry goes one step further: you observe people doing a real task in their own setting, such as comparing three retailers on their own laptop before buying a gift. It shows the tabs, price checks and messages to a partner that no analytics tool captures.
Behavioural interviewing
Move from "what would you like?" to "tell me about the last time". Questions about specific past events surface real needs instead of imagined preferences. The Nielsen Norman Group notes that asking people to speculate about future use produces weak and often misleading answers, and recommends the critical incident technique: asking about specific, memorable recent situations. When customers describe a concrete purchase they abandoned elsewhere, they reveal the exact combination of factors that made them leave, which neither surveys nor analytics can see.
Switch interviews (Jobs to Be Done)
The switch interview, developed by Bob Moesta and Chris Spiek within the Jobs-to-be-Done approach, reconstructs the timeline of a real purchase: the first thought, passive looking, active looking, the deciding moment and the purchase. It analyses each decision through four forces: the push of a problem with the current situation, the pull of the new solution, the anxiety about the unproven choice and the habit of what the customer already knows. For CRO teams, anxiety and habit are the most useful forces, because websites spend most of their effort on pull (benefits, imagery, offers) and very little on calming doubts.
Comparative analysis
Customers often cannot say what they need, but they can easily explain why they chose a competitor. Interviews with recent switchers, lost prospects and customers who buy from you and from others reveal gaps in value proposition, experience and trust that no internal analysis would surface. Competitors' reviews are a free version of the same research: the complaints customers make about a rival are a list of promises you could make more clearly. This evidence is especially valuable because customers have already voted with their money.
| Method | What it reveals | Effort | Main watch-out |
|---|---|---|---|
| Support tickets, chats, call logs | Recurring problems in customers' own words | Low: data already exists | Skews towards post-purchase issues |
| On-site exit poll (one open question) | Why visitors leave a specific page | Low | Short answers; ask one question only |
| Reviews (yours and competitors') | Expectations, disappointments, the language customers use | Low | Extremes are over-represented |
| Think-aloud usability tests (5 users) | Confusion and doubt at the moment it happens | Medium | Recruit real target customers, not colleagues |
| Behavioural or switch interviews | Triggers, worries and trade-offs behind real purchases | Medium | Ask about specific past events, never about the future |
| Contextual inquiry | Real-world behaviour across devices, tabs and people | Higher | Small samples; use to explain, not to count |
Section 6 · From insight to test
Customer insight only pays off when it becomes a causal hypothesis that a test can check
Even organisations that collect good customer insight struggle to act on it. Qualitative findings seem incompatible with testing frameworks. Customer stories do not fit neatly into hypothesis templates. This translation gap is where much VoC work dies: a slide of quotes that everyone agrees with and nobody acts on.
Closing the gap does not mean choosing between qualitative understanding and quantitative rigour. It means a simple, repeatable way to turn one into the other. Exhibit 4 shows the pipeline we use.
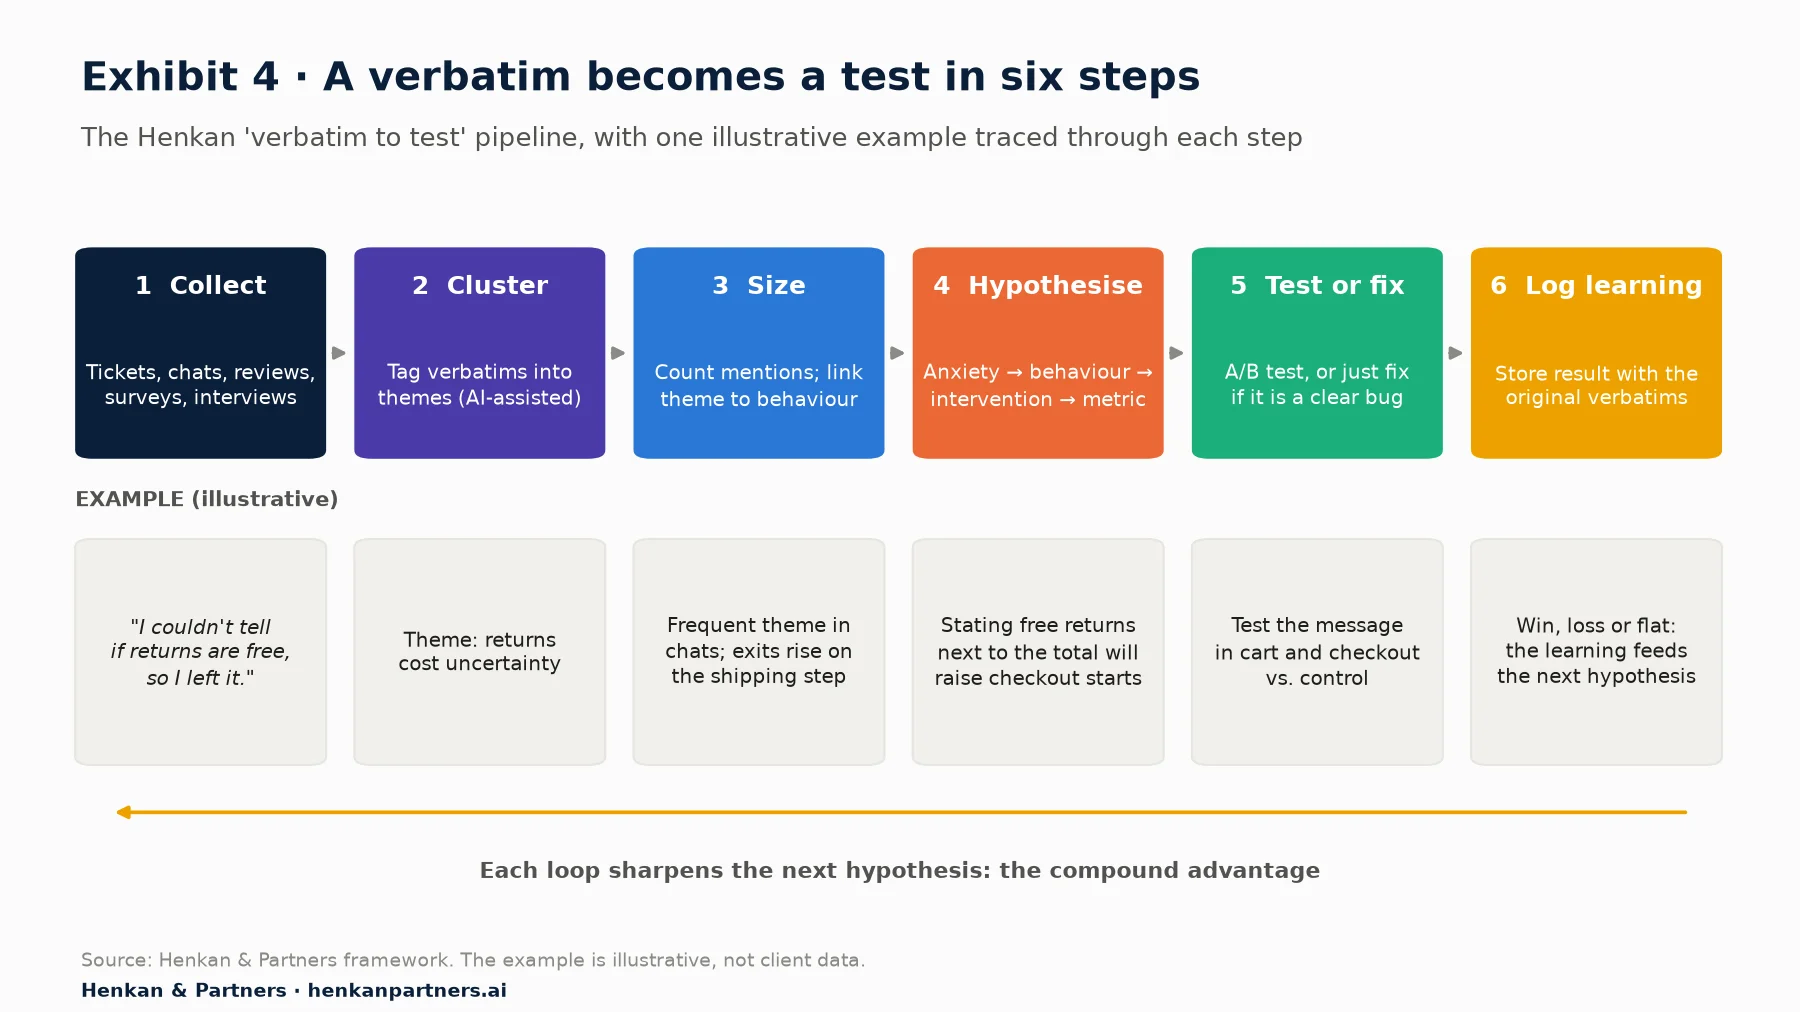
What this shows. A verbatim is not yet a test idea. It becomes one when it is grouped with similar comments, sized against analytics, written as a cause-and-effect statement and then tested or simply fixed. The final step matters most over time: storing the result next to the original customer words means the next hypothesis starts from what was learned, whatever the outcome.
Causal hypothesis development
Typical optimization hypotheses come from observed correlations: "Users who see X convert more, so showing more users X should raise conversion." Customer-informed hypotheses add a causal mechanism: customers leave because of worry Y, which shows up as behaviour Z; if intervention X addresses Y, Z should improve, and conversion with it. That framing connects customer psychology to measurable outcomes, and it makes a losing test informative, because it tells you the worry was wrong or the fix did not address it.
Because [customers say or show: evidence], we believe [worry or need] causes [observed behaviour]. If we [change], then [primary metric] will improve, and we will also see [supporting signal].
Anxiety mapping
Customer feedback reveals specific worries that create friction. Mapping each worry to the page or step where it arises lets you target root causes instead of symptoms. If customers doubt product quality, work on proof of authenticity rather than generic trust badges. If sizing concerns dominate, a fit guarantee may matter more than a faster checkout. The Jobs-to-be-Done anxiety force and Baymard's list of abandonment reasons give a good starting checklist: cost, delivery, returns, payment security, fit and quality.
Language mining
Customers describe their needs with specific words that reveal how they think. Mining that language, and literally reusing customer words in headlines, product copy, navigation labels and FAQs, aligns the experience with expectations. Copyhackers popularised the technique as review mining: copy customer phrases from reviews into a table, look for recurring themes, and let those phrases shape the message. Their summary is blunt: review mining data should write your copy.
For practitioners. Make the hypothesis template mandatory for any test above a minimum size. Each test brief should link to at least three verbatims or one observed session. If a test loses, record which part of the causal chain failed.
For leaders. Ask for learning, not only wins. A programme that can explain why its tests won or lost is building knowledge that compounds. One that can only report uplift figures is not.
Section 7 · The 2026 angle
AI makes it cheap to analyse customer feedback at scale, but it does not replace listening to real customers
For years, the barrier to VoC was analysis, not collection. A mid-sized retailer can accumulate tens of thousands of tickets, chats, reviews and survey answers a year. Tagging them by hand took weeks, so most were never read. In 2026 that barrier has largely fallen.
Large language models can now cluster open text into themes, count how often each theme appears, pull representative quotes and draft hypotheses from them, in hours rather than weeks. That moves open-text feedback from the qualitative corner of Exhibit 3 towards the quantitative one: a theme that used to be "something a few customers mentioned" becomes "a theme present in a measurable share of contacts", which can then be matched to analytics.
The research supports using AI for this work, with care. A blinded 2026 study in PLOS Digital Health compared large language models with human analysts on the same qualitative data. When applying a predefined set of codes, the models matched or slightly exceeded human agreement levels (about 93% for both). When generating themes from scratch, performance varied more, and the models were weaker on tone, nuance and conversational context, with some errors in attributing who said what. In other words: AI is good at applying a coding frame at scale, and still needs a human to design the frame and check the result.
How to use AI on customer feedback
- Cluster, then read. Let the model propose themes, then read raw verbatims in each theme before accepting it.
- Keep the quotes attached. Every theme should carry its source verbatims and a count, so anyone can check the evidence behind a hypothesis.
- Link themes to behaviour. Match each theme to the page or step where it arises and to the analytics for that step, so you can size the opportunity.
- Draft hypotheses, not decisions. The model drafts causal hypotheses (Section 6 template); a human decides what to test.
- Protect personal data. Remove names, emails and order numbers before feedback is sent to any AI service, and follow your company's data policy.
A careful word on synthetic users
Synthetic users, AI personas that answer questions as if they were customers, are attracting attention. They have a narrow, legitimate use: helping a team think through possible objections, draft an interview guide or prepare hypotheses before real research. The Nielsen Norman Group's review of the practice concludes that they can support desk research and hypothesis generation, but that synthetic users cannot replace the depth gained from studying real people; in one comparison, synthetic participants claimed to have completed online courses that real users typically abandoned. Our position is simple: treat synthetic answers as hypotheses to check with real customers, never as evidence and never as a substitute for them.
For practitioners. Export six months of tickets and reviews, run a first AI clustering pass, and spend an afternoon reading the raw quotes behind the top ten themes. It is often the most valuable research of the quarter.
For leaders. The cost of analysing customer feedback has fallen sharply. The constraint is now the organisation's willingness to act on what it hears, and the discipline to validate AI output against real customers.
Section 8 · A 30-day VoC starter plan
A first VoC loop needs a spreadsheet and discipline, not a new platform
The most common objection to customer research is infrastructure: no VoC platform, no research team, no budget. That objection misreads what is needed. Customer insight does not require elaborate infrastructure. It requires disciplined attention to information that already flows through the organisation.
Every customer interaction generates insight. Tickets describe friction in customers' own words, chats show the questions that block a purchase, sales calls surface objections the website fails to answer. This intelligence exists. It simply goes uncaptured, unanalysed and unused.
The plan below produces a first complete loop, from verbatims to a live test, in 30 days. It suits a team of one or two people as well as a larger programme, and it needs only tools most companies already have: a spreadsheet, a survey or poll tool, a video call tool and your analytics.
| Week | Activity | Output |
|---|---|---|
| Week 1 | Export 3–6 months of support tickets, chat transcripts and reviews into one sheet (remove personal data). Launch one open-question exit poll on the page with the biggest drop-off. | A single verbatim log; exit poll collecting answers |
| Week 2 | Cluster the verbatims into themes with AI assistance, then read samples to validate. Run five think-aloud tests on the same key journey with real target customers. | A theme list with counts and quotes; a list of observed friction points |
| Week 3 | Run five behavioural or switch interviews with recent buyers and, if possible, people who chose a competitor. Match each theme to the analytics for the step where it arises. | A four-forces map (push, pull, anxiety, habit); a sized list of opportunities |
| Week 4 | Write causal hypotheses for the top themes and score them. Fix obvious bugs directly. Launch the first VoC-led test and share a one-page readout with support, marketing and product. | A scored backlog; a live test; a shared readout |
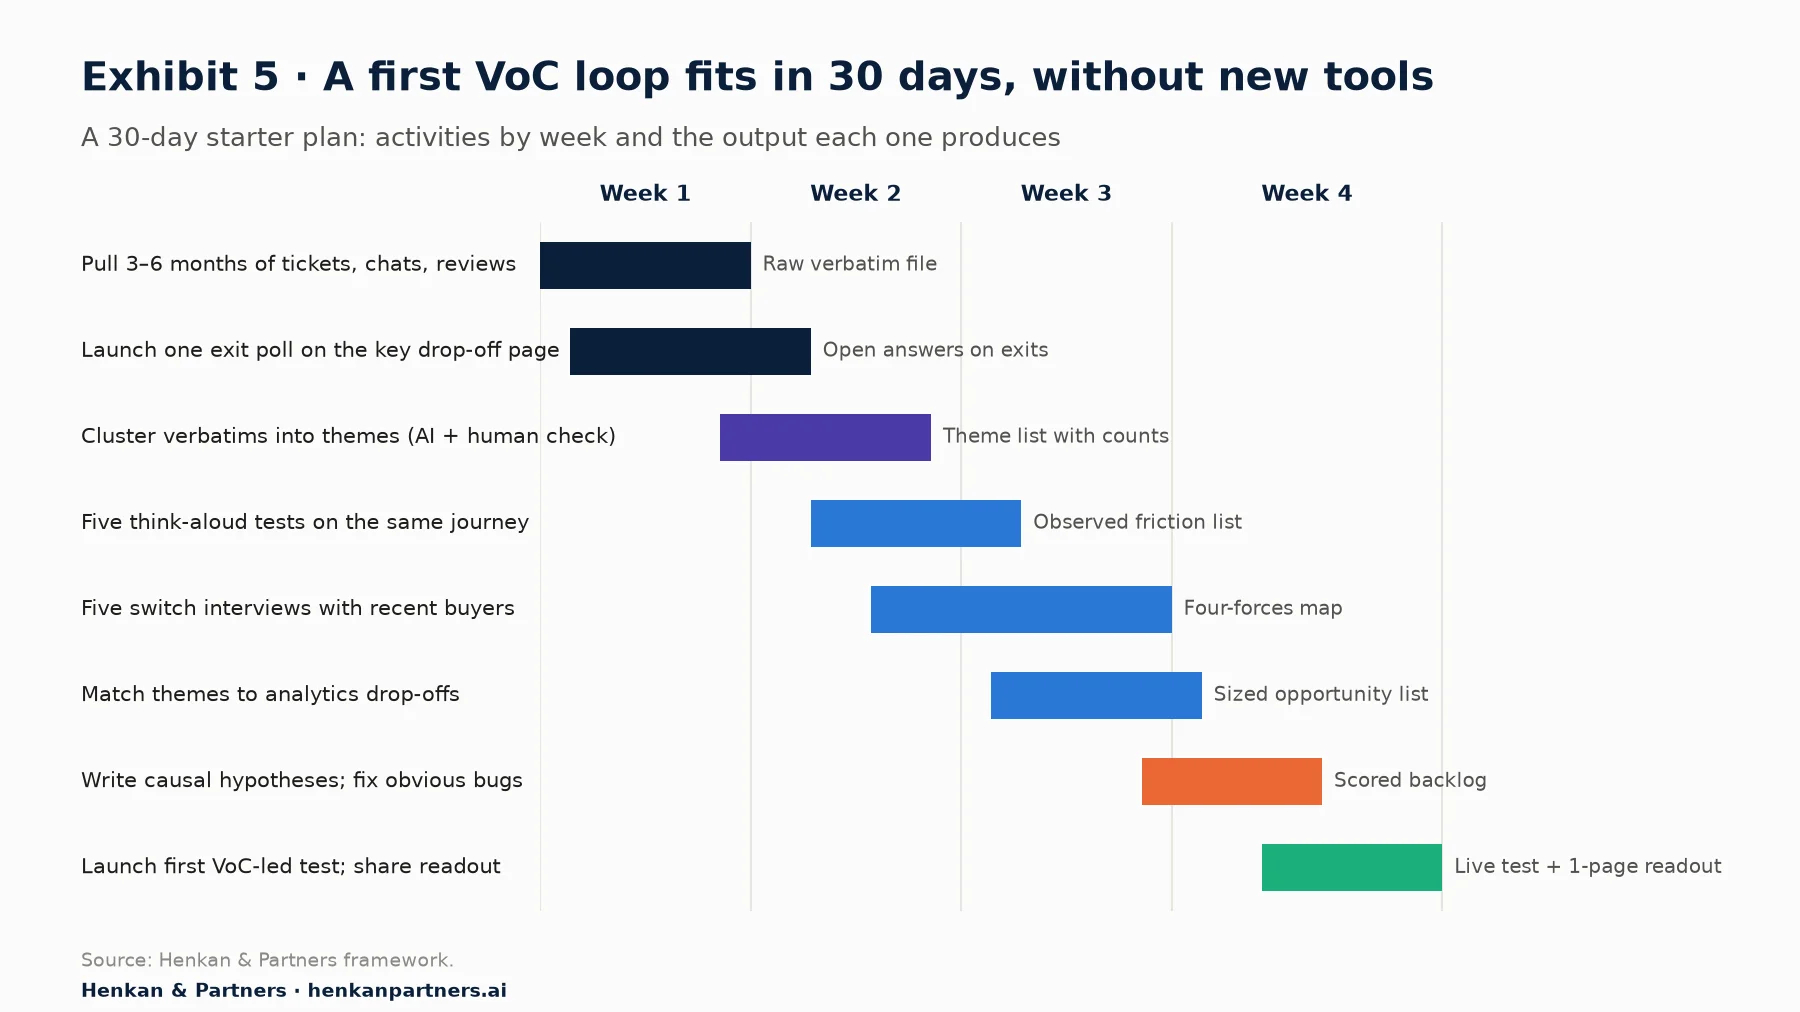
What this shows. The activities overlap on purpose. Collection starts on day one so that analysis has material by week two; interviews start once themes exist, so that they probe the right worries. By day 30 the team has a sized, evidence-based backlog and one live test, which is enough to show stakeholders what a VoC-led programme looks like.
Turn the first loop into a rhythm
The key is to make listening a habit rather than an event. The rhythms below need no new tools, only new habits that gradually change the culture:
- Weekly: open the team meeting with three customer quotes from the past week; review new exit-poll answers.
- Monthly: refresh the theme counts from tickets, chats and reviews; review the top themes with support and marketing.
- Quarterly: run a new round of five interviews and five usability tests on the journey with the largest opportunity; review why customers chose competitors.
- After every test: record the result, the hypothesis and the source verbatims together, so that learning accumulates.
Section 9 · The compound advantage
Customer understanding compounds over time, while programmes that only test run out of good ideas
Organisations that bring customer insight into their optimization programme gain more than better conversion rates. They build a compound advantage. Each customer-informed test produces learning that improves the next hypothesis. Each successful change builds the trust needed for bolder ones. Each alignment between customer need and experience reduces friction across the whole journey.
A programme driven only by behavioural data eventually exhausts the obvious opportunities in its funnel. Customer understanding keeps revealing new ones, because expectations, competitors and markets keep changing. In our experience at Henkan & Partners, programmes that lose their momentum after the first year or two usually have a full test backlog and an empty research pipeline. That is our observation from client work, not a published statistic, but it is consistent with the low win rates in Exhibit 1.
The business case also goes beyond conversion. Qualtrics XM Institute's global study of more than 33,000 consumers in 29 countries found that consumers were 2.3 times as likely to purchase more from a company after a 5-star experience than after a 1- or 2-star one, with gaps of close to 60 points in their likelihood to trust and to recommend the company. Conversion is the moment of truth for one visit. The customer experience that VoC improves drives what happens after it: repeat purchase, trust and lifetime value.
For leaders. Three forces make customer understanding more important in 2026, not less. Testing technology is widely available, so it is no longer a differentiator. Customers compare every experience with the best one they have had. And AI is making feedback analysis cheap for everyone, so the advantage shifts to the organisations that actually act on what customers say.
Section 10 · Recommendations
Five moves put the customer's voice at the centre of every optimization programme
Organisations can keep optimizing against behavioural metrics and accept marginal gains, or bring customer insight in systematically and solve the problems customers actually have. That needs steady discipline, not a big-bang transformation.
1. Give customer understanding an owner
Name one person accountable for the shared verbatim log and the monthly theme review, and give them access to support, chat, review and survey data. In a small team this is a few hours a month; in a large one it may be a role.
2. Require evidence in every test brief
Use the causal hypothesis template for every significant test, with links to the verbatims or observed sessions behind it. Track the share of tests grounded in customer evidence as a programme metric.
3. Balance what people say and what they do
Run at least one method from each quadrant of Exhibit 3 every quarter. Size every theme you hear with analytics, and explain every major drop-off you see with customer words.
4. Use AI to analyse, and humans to decide
Automate the clustering and counting of open-text feedback, keep quotes attached to every theme, and have a person validate themes before they drive decisions. Use synthetic users only to prepare questions and hypotheses for real research.
5. Store learning, not only results
Record each test's hypothesis, customer evidence and outcome together, and review this memory before planning new tests. This is how the compound advantage builds up, and how a programme avoids re-testing the same weak ideas.
Customers will keep abandoning baskets for reasons analytics cannot detect. Competitors who listen more carefully will keep winning them. In an economy where customer experience decides who grows, understanding customers is not a nice extra for an optimization programme. It is the programme's most valuable input.
FAQ
Frequently asked questions about Voice of Customer
Frequently asked questions
What is Voice of Customer (VoC)?
Voice of Customer is the systematic collection and analysis of customers' own words about what they need, expect and struggle with. Sources include surveys, interviews, usability tests, reviews, support tickets and chat transcripts. In conversion optimization, VoC explains why customers behave as analytics shows, and it provides the evidence behind strong test hypotheses.
What is a Voice of Customer program?
A VoC program is a repeatable process with owners and a regular rhythm for collecting customer feedback, analysing it into themes, sizing those themes with analytics, and turning them into decisions and tests. It differs from one-off research because it keeps running, and its findings accumulate over time.
How do you analyse Voice of Customer data?
Gather verbatims from all sources into one place, remove personal data, and group them into themes (AI can do the first pass). Read samples to validate each theme, count how often it appears, and link it to the page or step where it arises in your analytics. Then write each important theme as a causal hypothesis and test or fix it.
What are examples of Voice of Customer methods?
Common methods include open-question exit polls, post-purchase surveys, NPS or CSAT comments, support ticket and chat analysis, review mining, think-aloud usability tests, contextual inquiry, customer interviews and Jobs-to-be-Done switch interviews. The strongest programmes combine methods that capture what people say with methods that capture what they do.
How is VoC different from web analytics?
Web analytics measures what visitors do at scale: where they come from, which pages they view and where they drop off. VoC captures why they do it, in their own words. Analytics sizes a problem; VoC explains it. Used together, they tell you both how many customers are affected and what would help them.
Can AI or synthetic users replace customer research?
No. AI is now very useful for clustering and counting large volumes of open-text feedback, and synthetic users can help draft questions and hypotheses. But the Nielsen Norman Group and others warn that synthetic users do not reproduce real behaviour. Treat their answers as hypotheses to check with real customers, never as evidence.
Key terms
- Voice of Customer (VoC)
- Customers' own words about what they need, expect and struggle with, collected from surveys, interviews, reviews, support contacts and observation. It matters because it explains the why behind the numbers in analytics.
- VoC program
- A repeatable process for collecting, analysing and acting on customer feedback, with owners and a regular rhythm. Without a program, feedback stays in departmental silos and never reaches the people who design tests.
- Conversion rate optimization (CRO)
- The practice of improving the share of visitors who complete a goal, such as a purchase or sign-up, through research and testing. VoC gives CRO its best hypotheses.
- Conversion research
- The research phase before testing: analytics, heuristic review, user testing and customer surveys used to find where and why people fail to convert. Good conversion research decides what is worth testing.
- Verbatim
- A customer's exact words, quoted without paraphrase, from a ticket, review, survey or interview. Verbatims preserve the language and emotion that summaries lose.
- Think-aloud test
- A usability test in which a participant uses a site while saying what they think as they go. It is cheap and reveals confusion and doubt that people forget by the time they fill in a survey.
- Switch interview
- A Jobs-to-be-Done interview that reconstructs, step by step, how a customer moved from an old solution to a new one. It reveals the triggers, doubts and trade-offs behind a real purchase.
- Four forces of progress
- The Jobs-to-be-Done model of a purchase decision: the push of a problem, the pull of a new solution, anxiety about the new choice and the habit of the old one. Anxiety and habit are what most websites fail to address.
- Causal hypothesis
- A test idea that names the customer problem, the behaviour it causes, the change that should fix it and the metric that should move. It makes every test result a lesson, win or lose.
- Anxiety mapping
- Listing the specific worries customers express (cost, fit, delivery, trust, returns) and linking each to the page or step where it arises. It focuses tests on root causes instead of cosmetic changes.
- Language mining
- Collecting the exact words customers use in reviews, tickets and interviews and reusing them in copy, navigation and FAQs. Also called review or message mining; it aligns the site with how customers think.
- Synthetic users
- AI-generated personas that answer questions in character. They can help draft hypotheses and interview guides, but they are not evidence about real customers.
Sources
An opinion essay by Alexandre Suon, Managing Partner of Henkan & Partners, restructured and fact-checked in September 2026. Statistics are quoted from the named publishers and were checked against the linked pages on 26 September 2026. Baymard's abandonment reasons are from its US shopper survey as published on its statistics page. Win rates come from different populations and definitions and are shown side by side, not averaged. The method map (Exhibit 3), the pipeline (Exhibit 4), the 30-day plan (Exhibit 5), the example in Exhibit 4 and statements labelled as Henkan experience are Henkan & Partners frameworks and opinion, not measured data.
- Baymard Institute: 50 Cart Abandonment Rate Statistics 2026
- Kohavi & Thomke: The Surprising Power of Online Experiments, Harvard Business Review, Sept–Oct 2017
- Optimizely: Top 10 takeaways from 127,000 experiments
- Harvard Business School Working Knowledge: Creating the Experimentation Organization (Stefan Thomke, Dec 2019)
- Qualtrics XM Institute: Global Study, ROI of Customer Experience, 2023 (data snapshot)
- Smart Insights: E-commerce conversion rate benchmarks, 2025 update (Dynamic Yield data)
- Nielsen Norman Group: First Rule of Usability? Don't Listen to Users (Nielsen, 2001)
- Nielsen Norman Group: Thinking Aloud, the #1 Usability Tool (Nielsen, 2012)
- Nielsen Norman Group: Why You Only Need to Test with 5 Users (Nielsen, 2000)
- Nielsen Norman Group: Interviewing Users (Nielsen, 2010)
- Nielsen Norman Group: When to Use Which User-Experience Research Methods (Rohrer, 2022)
- Nielsen Norman Group: Synthetic Users, If, When, and How to Use AI-Generated Research (Rosala & Moran, 2024)
- Jobs to be Done (Bob Moesta & Chris Spiek): switch interviews and the four forces
- Copyhackers: How to Find Your Message Using Review Mining
- CXL: ResearchXL conversion research model (Peep Laja)
- Hill et al.: Large language models for thematic analysis in healthcare research, PLOS Digital Health, 2026