Guide
The Essential Guide to Web Analytics for Product Owners
Alexandre Suon · 2026-09-27
Product owners decide what gets built. Web analytics tells them whether it was worth building. This guide shows product owners how to define success, put tracking into the backlog, read funnels, adoption and retention, size opportunities, run releases as experiments and use AI, for teams of every size.
Executive summary
- Analytics turns the backlog from a list of opinions into a list of bets you can check. Much of what product teams build is rarely used: Pendo's 2019 analysis of its customers found that 80% of features are rarely or never used. In Atlassian's 2026 survey, only 4% of product professionals said their metrics reflect the true value of their work.
- Agree one definition of success before you write the first story. A North Star metric, three to five input metrics the team can move, and a few guardrail metrics that must not get worse give everyone the same target. Frameworks such as HEART and AARRR help you choose them.
- Most ideas do not work, so every release should be measured. In published data, only 8% to 33% of controlled experiments at Airbnb Search, Booking.com, Google Ads, Netflix, Bing and Microsoft were judged successful, with each organisation counting success its own way. Shipping is not the same as succeeding.
- Tracking is part of the definition of done. Every story that changes what users can do should ship with its events, named and described in a tracking plan. Retrofitting tracking after launch costs weeks of data you can never get back.
- Funnels, adoption and retention answer different questions. Funnels show where users drop off, adoption shows whether they use what you shipped, and retention shows whether they come back. Median month-3 retention in Amplitude's 2025 benchmark was 3.8%, so small gains matter.
- Use data to size opportunities, test the big bets and keep a human in the loop for AI. A simple sizing formula ranks backlog items by expected value per week of effort. Analytics tools now answer questions in plain language, but the answers are only as good as your tracking and definitions.
Web analytics for product owners is the use of behavioural data from a website or app to decide what to build, check whether what was built creates value, and learn faster than competitors. It combines a clear definition of success (North Star, input and guardrail metrics), reliable tracking of user actions, and a habit of measuring every release, ideally with a controlled experiment.
Section 1 · Why it matters
Analytics turns the backlog from a list of opinions into a list of bets you can check
A product owner makes dozens of decisions a week: which story goes first, which bug can wait, which stakeholder request becomes a feature. Without data, those decisions rest on the loudest voice or the latest customer complaint. With data, each one becomes a bet with a stated expected result that the team can check after release.
The cost of guessing is high because much of what gets built goes unused. Pendo's 2019 analysis of 615 subscriptions of software products that use Pendo found that 80% of features in the average software product are rarely or never used, and that 12% of features generate 80% of daily usage. These are vendor figures from Pendo's own customers, so treat them as a direction rather than a law for every shop or app. The pattern is familiar to anyone who has looked at feature usage data.
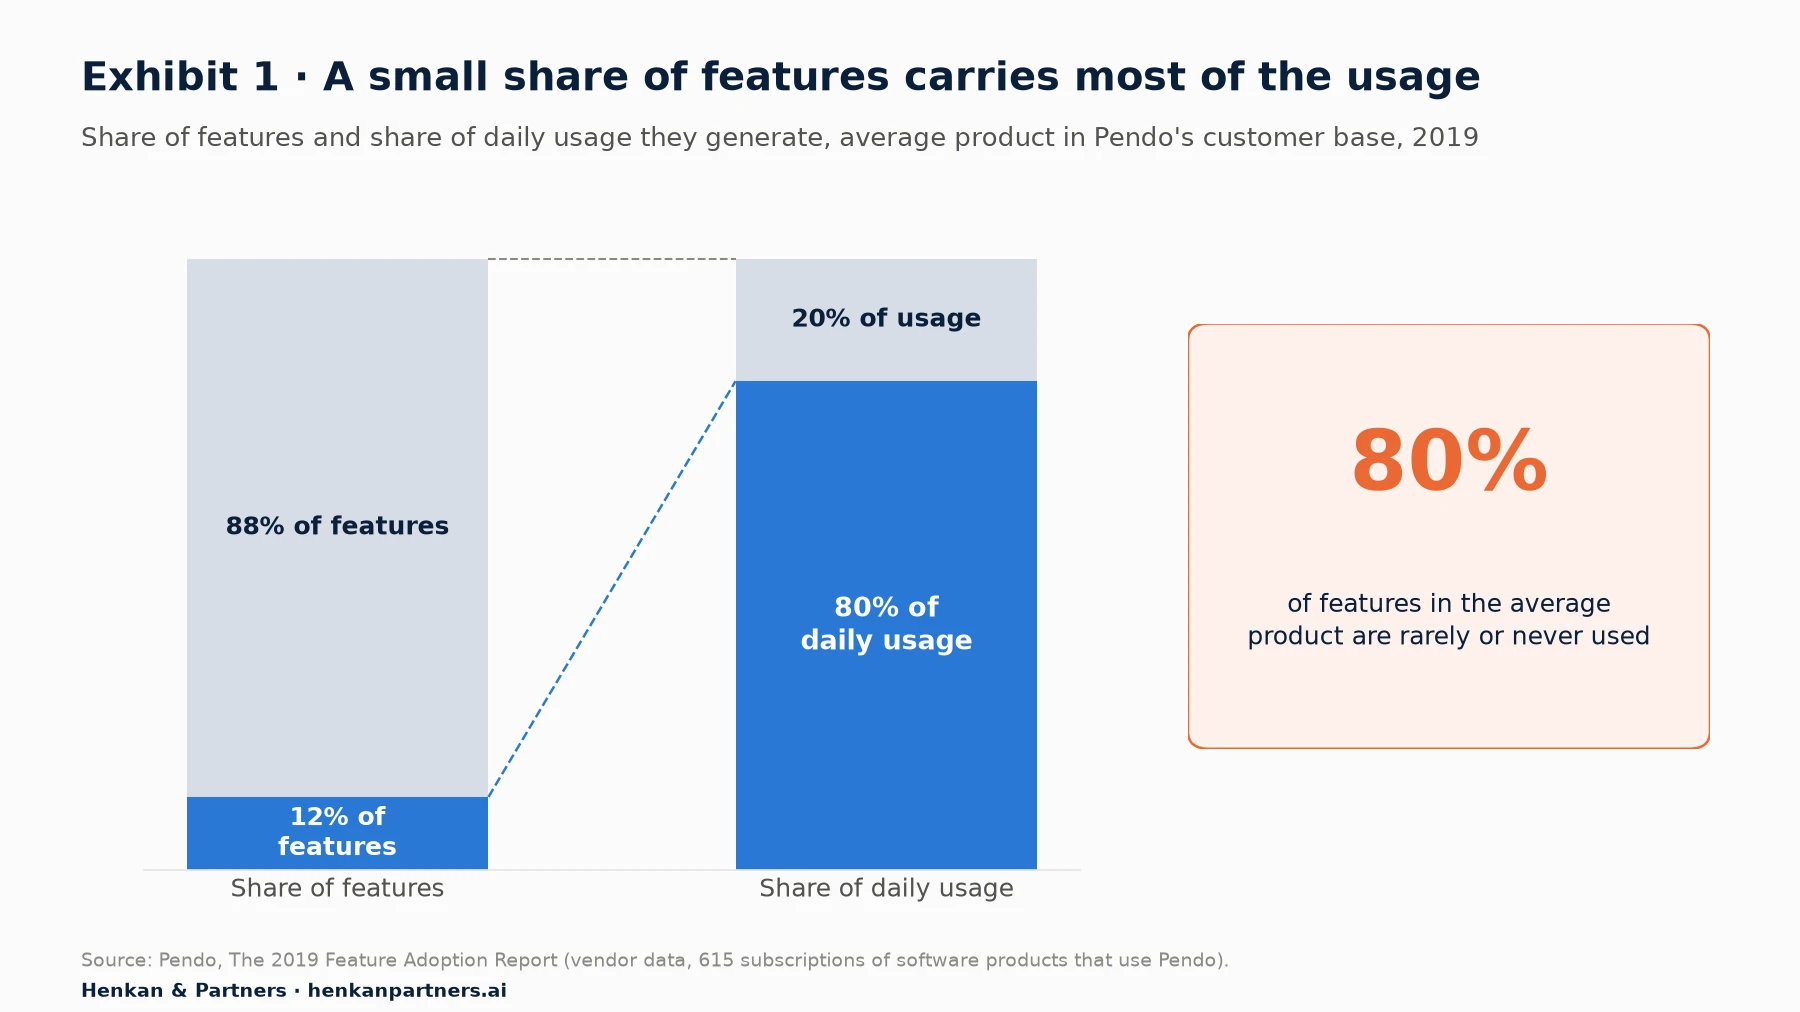
What this shows. Effort spread across many features produces a long tail of little-used functionality that still has to be maintained, tested and explained. Knowing which features carry the usage tells a product owner where improvements will reach most users, and which features could be simplified or removed.
Product teams know they need better measurement but struggle to find time for it. In Atlassian's State of Product 2026 survey of 700 managers and leaders in product teams (product, engineering, design and programme management), only 4% said their metrics reflect the true value of their work, 49% said they lack time for data analysis and metric tracking, and 40% run limited or no experimentation. In ProductPlan's 2026 survey of about 250 product professionals, only 13.5% reported consistent use of a formal scoring framework to prioritise.
For leaders. Ask your product owners to state, for each major backlog item, the metric it should move, by how much and by when. The discipline of writing it down changes the conversation more than any tool does.
Section 2 · Defining success
A North Star, a few input metrics and guardrails give the team one shared definition of success
Teams that measure everything end up steering by nothing. A small hierarchy of metrics works better. At the top sits a North Star metric, which Amplitude defines as the measure that links the customer problems your team solves with the revenue you aim to generate. Below it sit three to five input metrics the team can influence directly. Around them sit guardrail metrics that must not get worse.
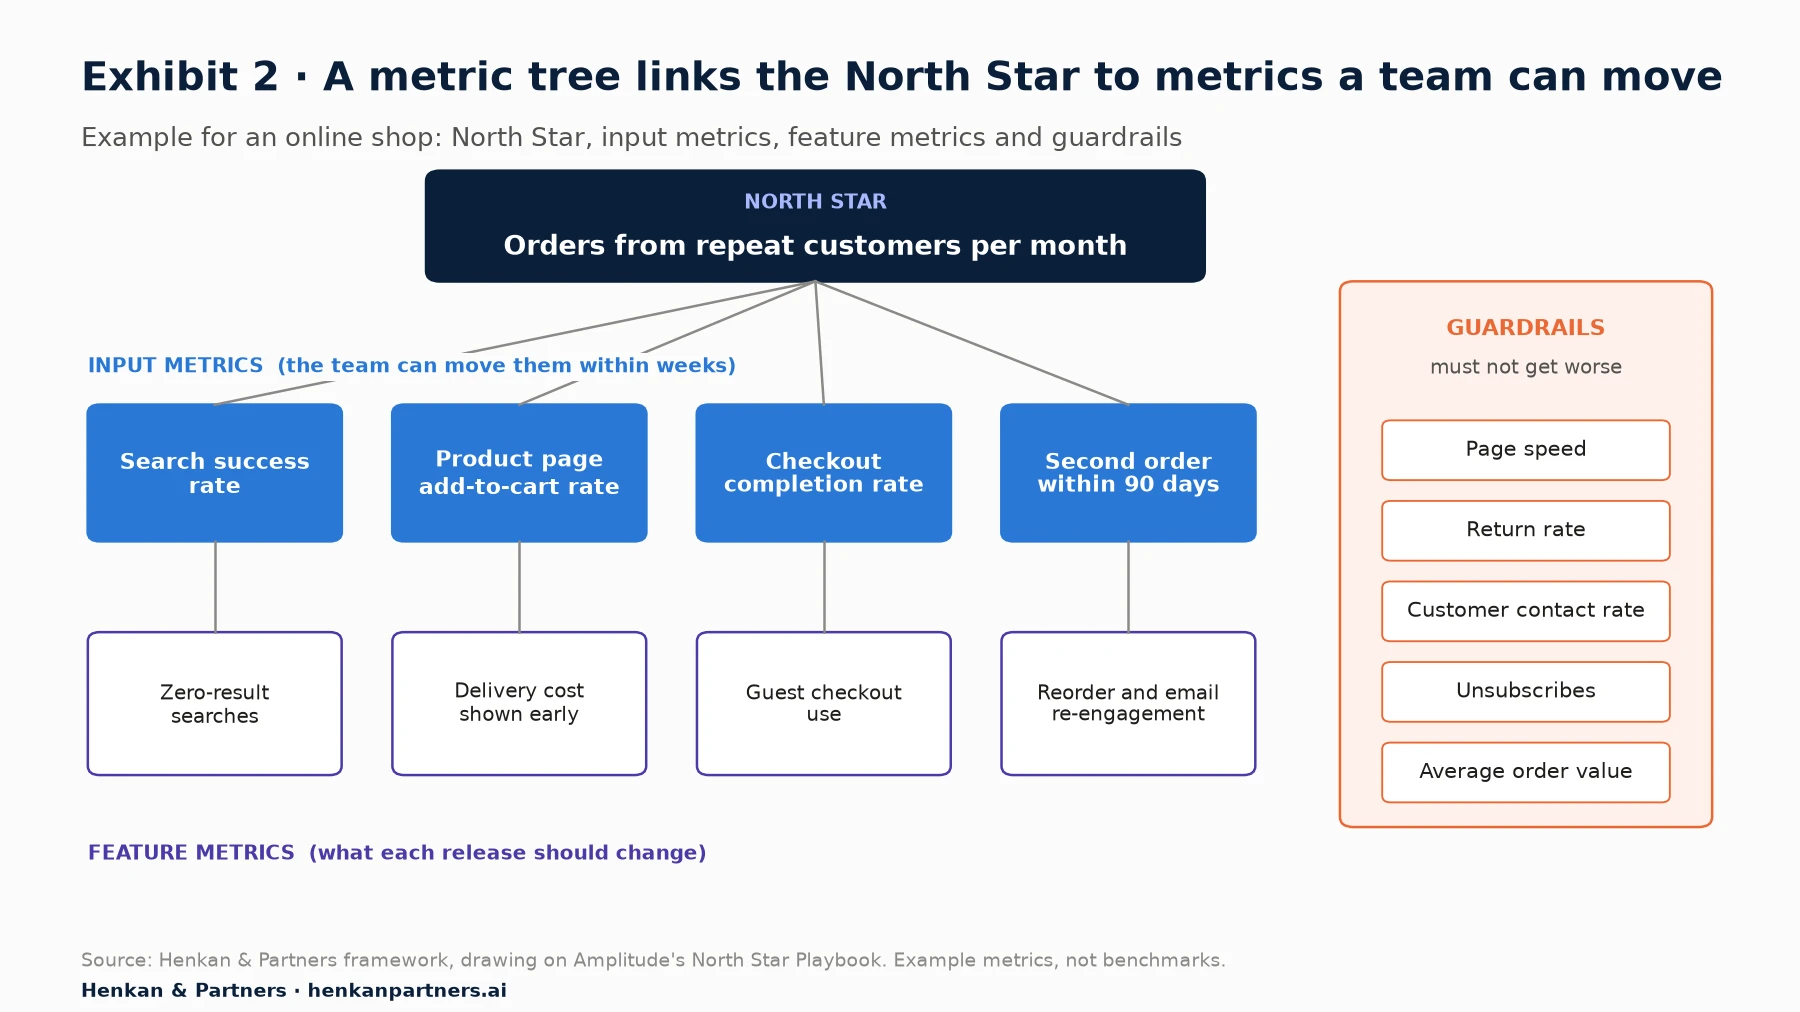
What this shows. Each story in the backlog should connect to a branch of the tree. A search improvement targets the search success rate; a checkout change targets checkout completion; both should leave the guardrails intact. When the North Star moves, the tree shows which input explains it.
Several frameworks help you choose the metrics. They overlap, and most teams borrow from more than one.
| Framework | What it is | Best for | Watch out for |
|---|---|---|---|
| North Star and inputs (Amplitude) | One metric that captures customer value, plus 3 to 5 input metrics the team can move | Aligning several teams on one outcome | Choosing a North Star the team cannot influence within a quarter |
| HEART (Google, 2010) | Happiness, Engagement, Adoption, Retention, Task success, chosen through Goals, Signals and Metrics | User experience goals for a product or feature | Tracking all five for everything; pick the ones that fit the goal |
| AARRR (Dave McClure, 2007) | Acquisition, Activation, Retention, Referral, Revenue | Finding the weakest stage of the customer life cycle | Treating it as a marketing funnel only |
| OKRs (Intel, then Google) | An objective plus measurable key results, per quarter | Setting quarterly targets that link to strategy | Key results that are outputs ("ship X") instead of outcomes |
| Overall evaluation criterion (Kohavi) | A metric measurable during an experiment that is believed to drive long-term goals | Deciding whether an experiment won | Short-term metrics that hurt long-term value, such as clicks from aggressive pop-ups |
Outputs, outcomes and inputs
The most common mistake is to set targets on outputs: "launch the new filter in Q2". Outputs are within the team's control but say nothing about value. Outcomes, such as "repeat orders", show value but move slowly and depend on many things. Amazon's answer, as described by Colin Bryar and Bill Carr in Working Backwards, is to focus on controllable input metrics, which in turn drive the output metrics. A good input metric is one your team can move within a few weeks and that you have evidence moves the outcome.
For product owners. Write the expected metric change into the user story: "As a returning customer I want to reorder a past basket, so that I can buy faster. Success: reorder use by 10% of returning customers within 60 days; guardrail: average order value does not fall."
Section 3 · Outcomes
Most ideas do not work, so shipping a feature is not the same as succeeding
Product teams usually expect most of what they ship to help. Controlled experiments say otherwise. Ronny Kohavi and colleagues, who led experimentation teams at Microsoft and Airbnb, found that at Microsoft only about one-third of experiments designed to improve a key metric succeeded; one-third were neutral and one-third made things worse. At Google and Bing, only about 10% to 20% of experiments produced positive results.
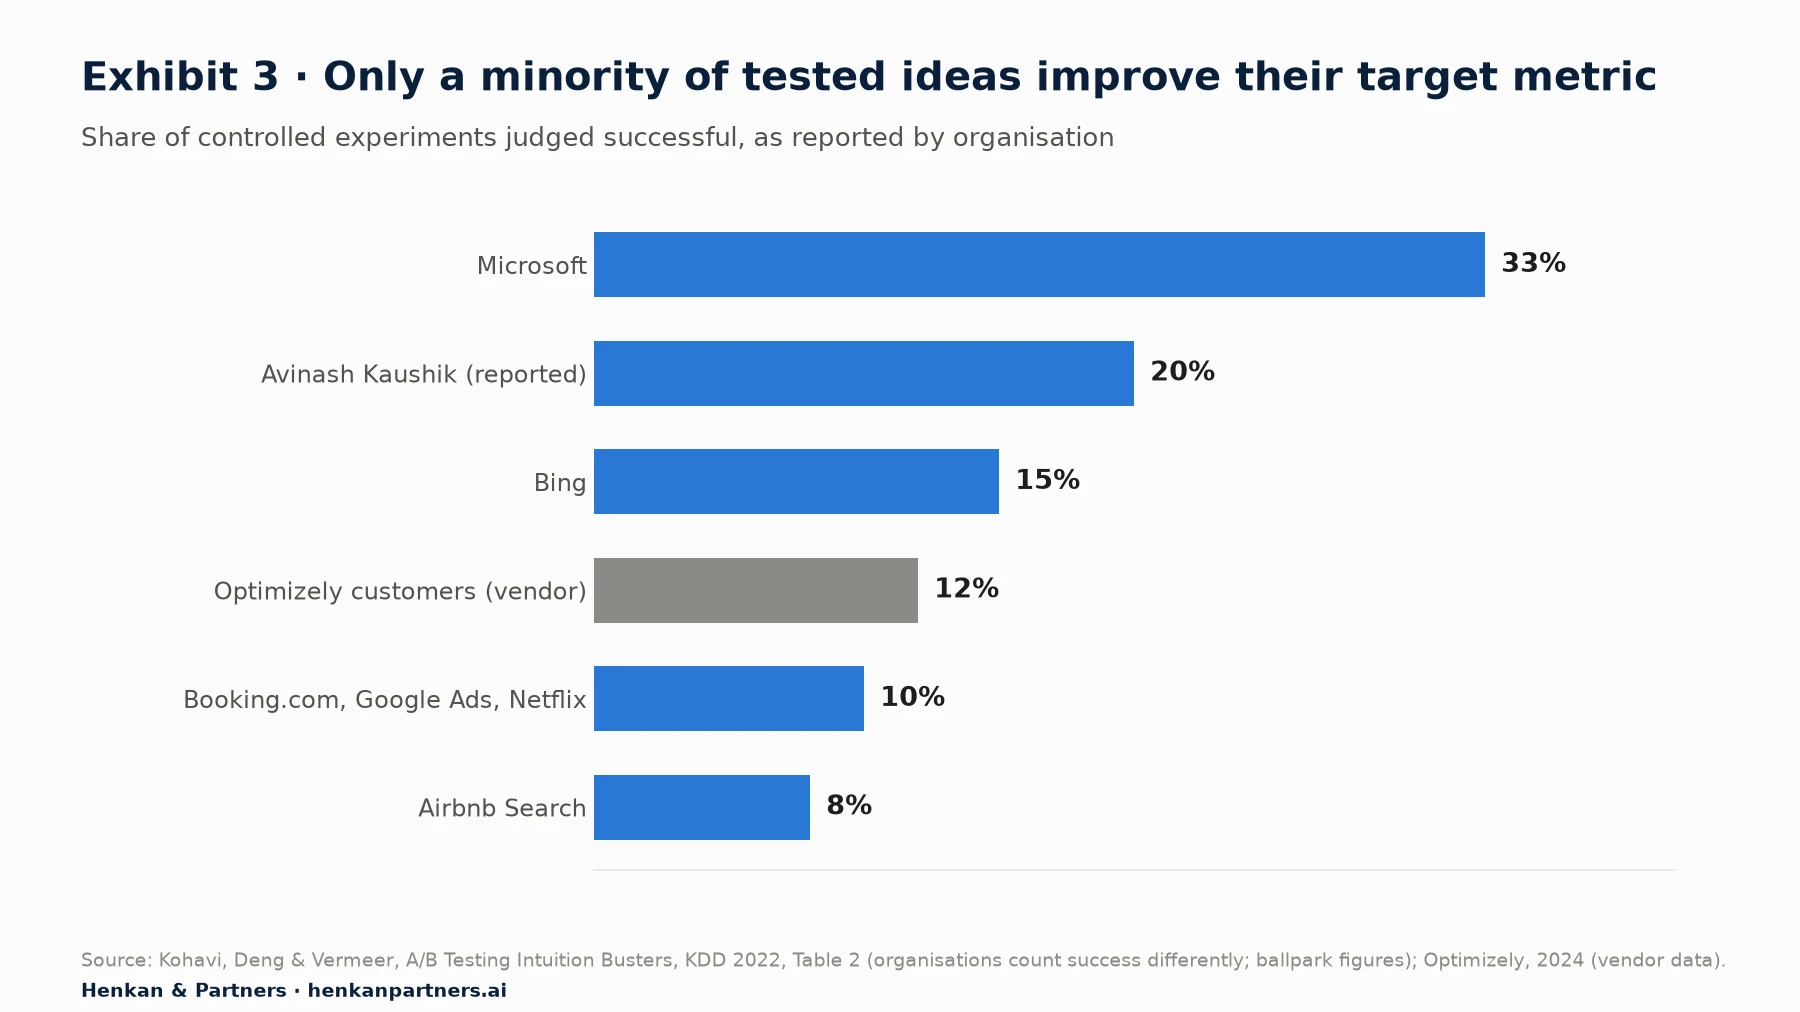
What this shows. Even at companies with some of the best product teams in the world, most ideas fail to move the metric they were designed for. A product owner who ships ten features a quarter without measuring them is likely shipping several that do nothing and some that do harm, without knowing which.
The opposite also happens: good ideas get ignored. At Bing, an employee's idea to lengthen ad headlines was "prioritized low and languished in the backlog for more than six months". When it was finally tested, it increased revenue by 12%, worth more than $100 million a year in the United States, without hurting the user-experience metrics. It became the best revenue-generating idea in Bing's history. Intuition is a poor guide in both directions.
Kohavi's rules of thumb add two more lessons for product owners. Big wins are rare: "most progress is made by small continuous improvements: 0.1%-1% after a lot of work." And changing where people click is easier than getting more people to finish: "reducing abandonment is hard, shifting clicks is easy". A new widget that attracts clicks may only move them away from something else.
For leaders. Judge product teams on validated outcomes and learning, not on the number of features shipped. A team that stops three features before launch because tests showed no value has saved money, not failed.
Section 4 · Tracking in the backlog
Tracking is part of the definition of done: every story that changes behaviour ships with its events
Analytics data is only as good as the tracking behind it, and tracking is a product requirement like any other. If a new feature ships without events, the team loses the most useful weeks of data, the first ones after launch, and can never get them back. The fix is simple: make tracking part of the definition of done.
Write a tracking plan
Amplitude describes a tracking plan as a document that "defines every event and property you collect, why you collect each one, and which source emits it". Segment adds that it clarifies "where those events live in the code base, and why those events are necessary from a business perspective." In practice it is a shared table, owned by the product owner or an analyst, that engineers implement and testers check.
| Event name | When it fires | Key properties | Question it answers |
|---|---|---|---|
| search_submitted | User submits a search | search_term, results_count, source_page | Do users find what they look for? |
| filter_applied | User applies a filter on a listing | filter_type, filter_value, results_count | Which filters help users narrow down? |
| product_viewed | Product page loads | item_id, price, in_stock, list_name | Which products and lists drive interest? |
| add_to_cart | Item added to basket | item_id, quantity, value, add_source | Which pages and components create baskets? |
| checkout_started | User starts checkout | value, items_count, logged_in | Where does checkout begin, and for whom? |
| reorder_clicked | User reorders a past basket | order_age_days, items_count | Is the new reorder feature used? |
Name events consistently
Inconsistent names are the most common cause of unusable data. Segment recommends an "Object + Action" pattern, such as Product Viewed. Mixpanel recommends object and verb in snake_case, such as song_played, and warns that names are case-sensitive: sign_up_completed and Sign_Up_Completed count as two different events. Google Analytics 4 (GA4) has its own recommended events for e-commerce, such as view_item, add_to_cart, begin_checkout and purchase, which feed its built-in reports. Pick one convention, write it down and never mix.
Know your tool's limits
Every tool has limits that shape the tracking plan. In GA4, event names can be up to 40 characters, each event can carry up to 25 parameters, and parameter values are cut at 100 characters. A standard GA4 property allows 50 event-scoped custom dimensions, 25 user-scoped and 10 item-scoped, and 50 custom metrics; GA4 360 raises these to 125, 100, 25 and 125. Custom dimensions are the most common constraint, so reserve them for properties someone will actually analyse.
For product owners. Add three lines to the acceptance criteria of every story that changes user behaviour: the events it must send, where they are defined in the tracking plan, and who checks them in a test environment before release. Our guide Beyond the Numbers: How GA4 Actually Works explains how to check what reaches GA4.
Section 5 · Funnels
Funnels show where users drop off, and the biggest leaks are often fixable
A funnel lists the steps users should take and the share who reach each one. For an online shop, the classic funnel is product view, add to cart, checkout and purchase. For an app, it might be download, sign-up, first key action and second visit. The point is not the overall conversion rate but the step with the largest avoidable drop.
Checkout is the most studied leak. Baymard Institute's average of 50 studies puts online cart abandonment at 70.22%. Many abandoners were only browsing, but among US shoppers who abandoned during checkout for other reasons, 40% cited extra costs that were too high, 19% did not trust the site with their card details, 18% were asked to create an account and 17% found the checkout too long or complicated. Baymard estimates that large e-commerce sites can gain a 35.26% increase in conversion rate through better checkout design.
Always split by device and visitor type
A funnel averaged across all users hides as much as it shows. In Contentsquare's 2026 benchmark of 99 billion sessions, mobile made up about 70% of visits but converted at 2.0%, against 3.4% on desktop. Returning visitors converted at 2.9% and new visitors at 1.7%. A product owner who sees conversion fall should first check whether the mix of devices or new visitors changed, before assuming the product got worse.
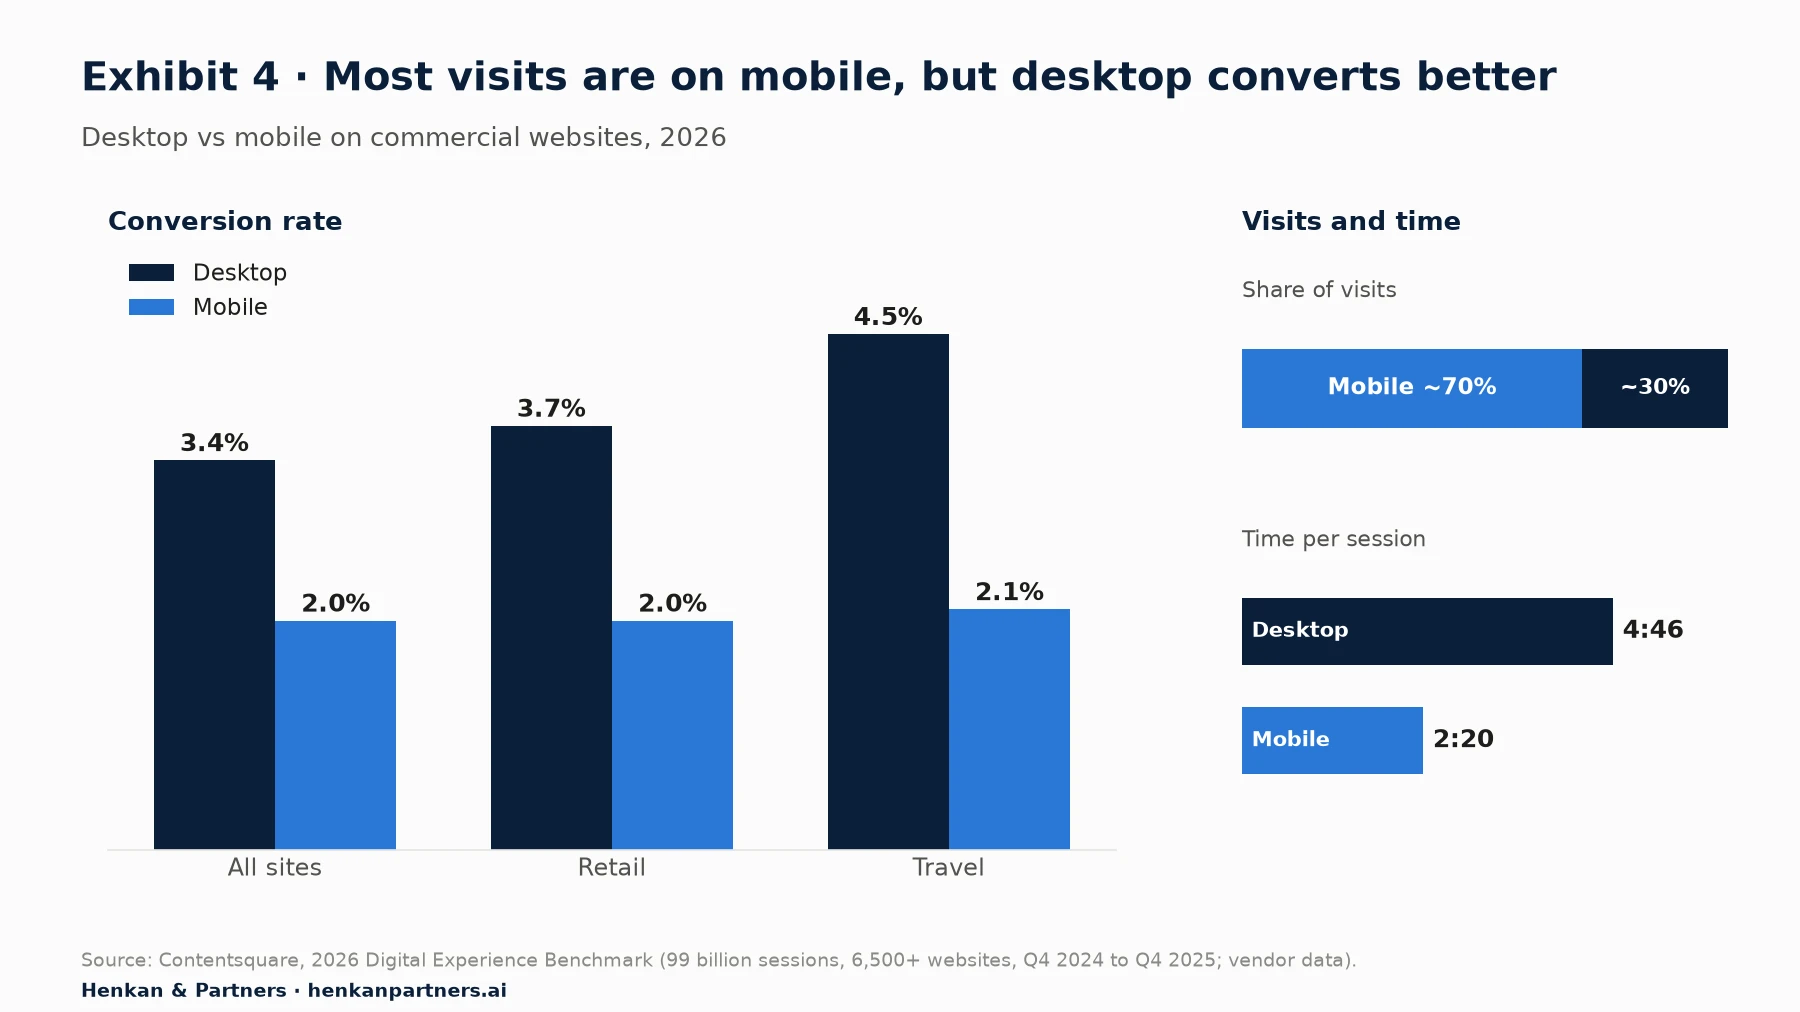
What this shows. Mobile is where most users meet the product, and where most of the conversion gap sits. Stories that improve mobile product pages, search and checkout reach the largest audience. It also means any funnel metric must be read by device, or a shift in traffic mix will look like a change in product performance.
For product owners. Build three funnels and review them every sprint: the purchase funnel by device, the same funnel for new versus returning visitors, and a funnel for the feature your team shipped last. Our Essential Guide to Web Analytics covers the metrics behind them.
Section 6 · Adoption and retention
Adoption shows whether users try what you shipped; retention shows whether it created lasting value
A release can pass every functional test and still fail its users. Two measures tell you. Feature adoption is the share of active users who use the feature in a period. Retention is the share of users who come back, or buy again, after a first visit or order. Adoption comes first and moves quickly; retention moves slowly but is the better sign of value.
Benchmarks show how hard retention is. Amplitude's 2025 Product Benchmark Report, based on more than 2,600 companies and 10,600 products, found a median month-3 retention of 3.8%, against 18.5% for the top 10% of products. In e-commerce, the median was 2.8% and the top 10% reached 18.9%. Amplitude also found that 69% of top performers on day-7 retention were also top performers at month 3: early retention predicts later retention.
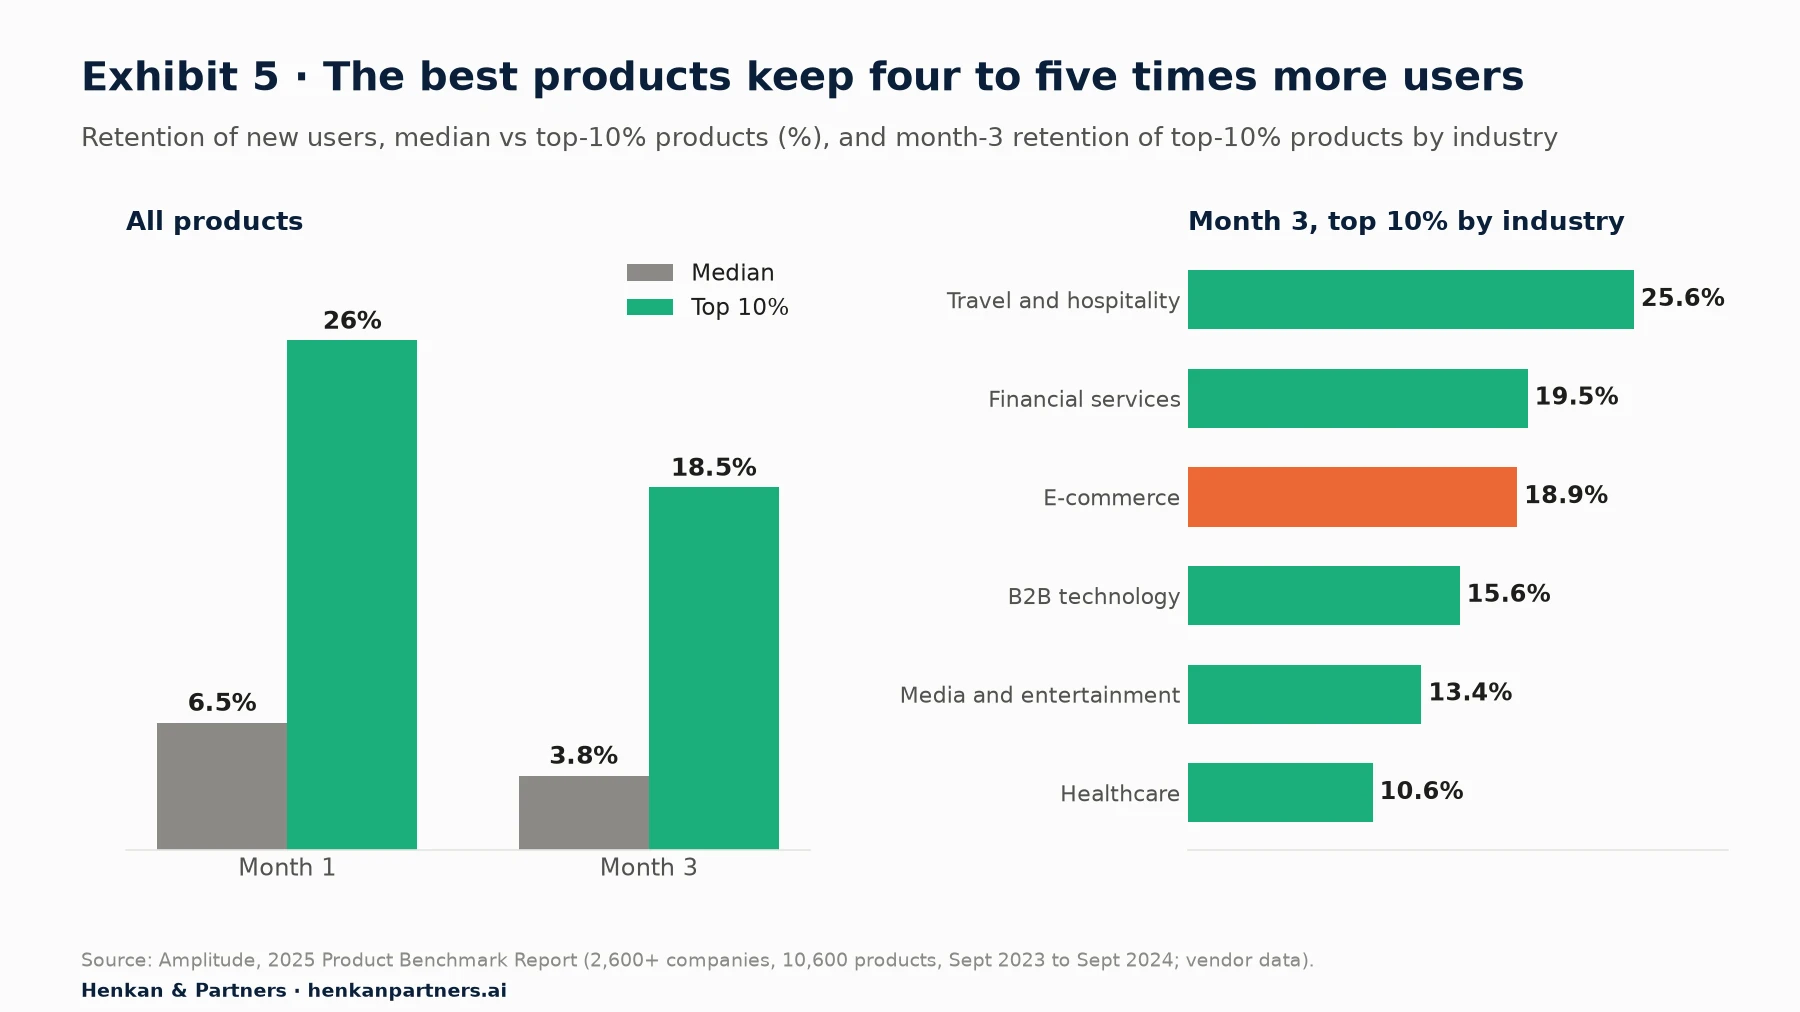
What this shows. Retention differs widely by industry, so compare yourself first with your own history and then with your sector, not with a cross-industry average. The gap between median and top 10% also shows how much room there is: products that make the first weeks useful keep far more of the users they paid to acquire.
Read retention by cohort
Retention is best read as a table of cohorts: users grouped by the week or month they started, with the share still active in each following period. If recent cohorts retain better than older ones at the same age, the product is improving. If a release date marks a step change, you have evidence the release mattered. An overall active-user count cannot show this, because growth in new users hides losses among existing ones.
| Question | Metric | Typical first read |
|---|---|---|
| Did users find the new feature? | Share of active users who saw it | Within days of release |
| Did they try it? | Feature adoption: share of active users who used it at least once | First two to four weeks |
| Do they keep using it? | Repeat use: share of adopters who used it again in the next period | Four to eight weeks |
| Did it change the product outcome? | Retention or repeat purchase of adopters vs comparable non-adopters, or an A/B test | One to three months, or the test duration |
For product owners. Adopters of a feature are often your most engaged users anyway, so they would have retained better without it. To show that a feature causes better retention, roll it out to a random half of users behind a feature flag and compare.
Section 7 · Prioritisation
Sizing each opportunity before building it ranks the backlog by value, not by volume of requests
Analytics does not only judge releases after the fact; it also helps decide what to build next. A simple sizing formula uses numbers you already have: how many users or orders the change can reach, how much it might improve them, how confident you are, and how much effort it takes.
Expected monthly value = orders reached × expected uplift × average order value × confidence
Priority score = expected monthly value ÷ weeks of effort
The inputs come from analytics: the number of orders that pass through the page or step you want to change, the average order value, and a realistic uplift based on past tests or published research. Confidence is the team's honest estimate of the chance the idea works, which past experiment results can keep in check.
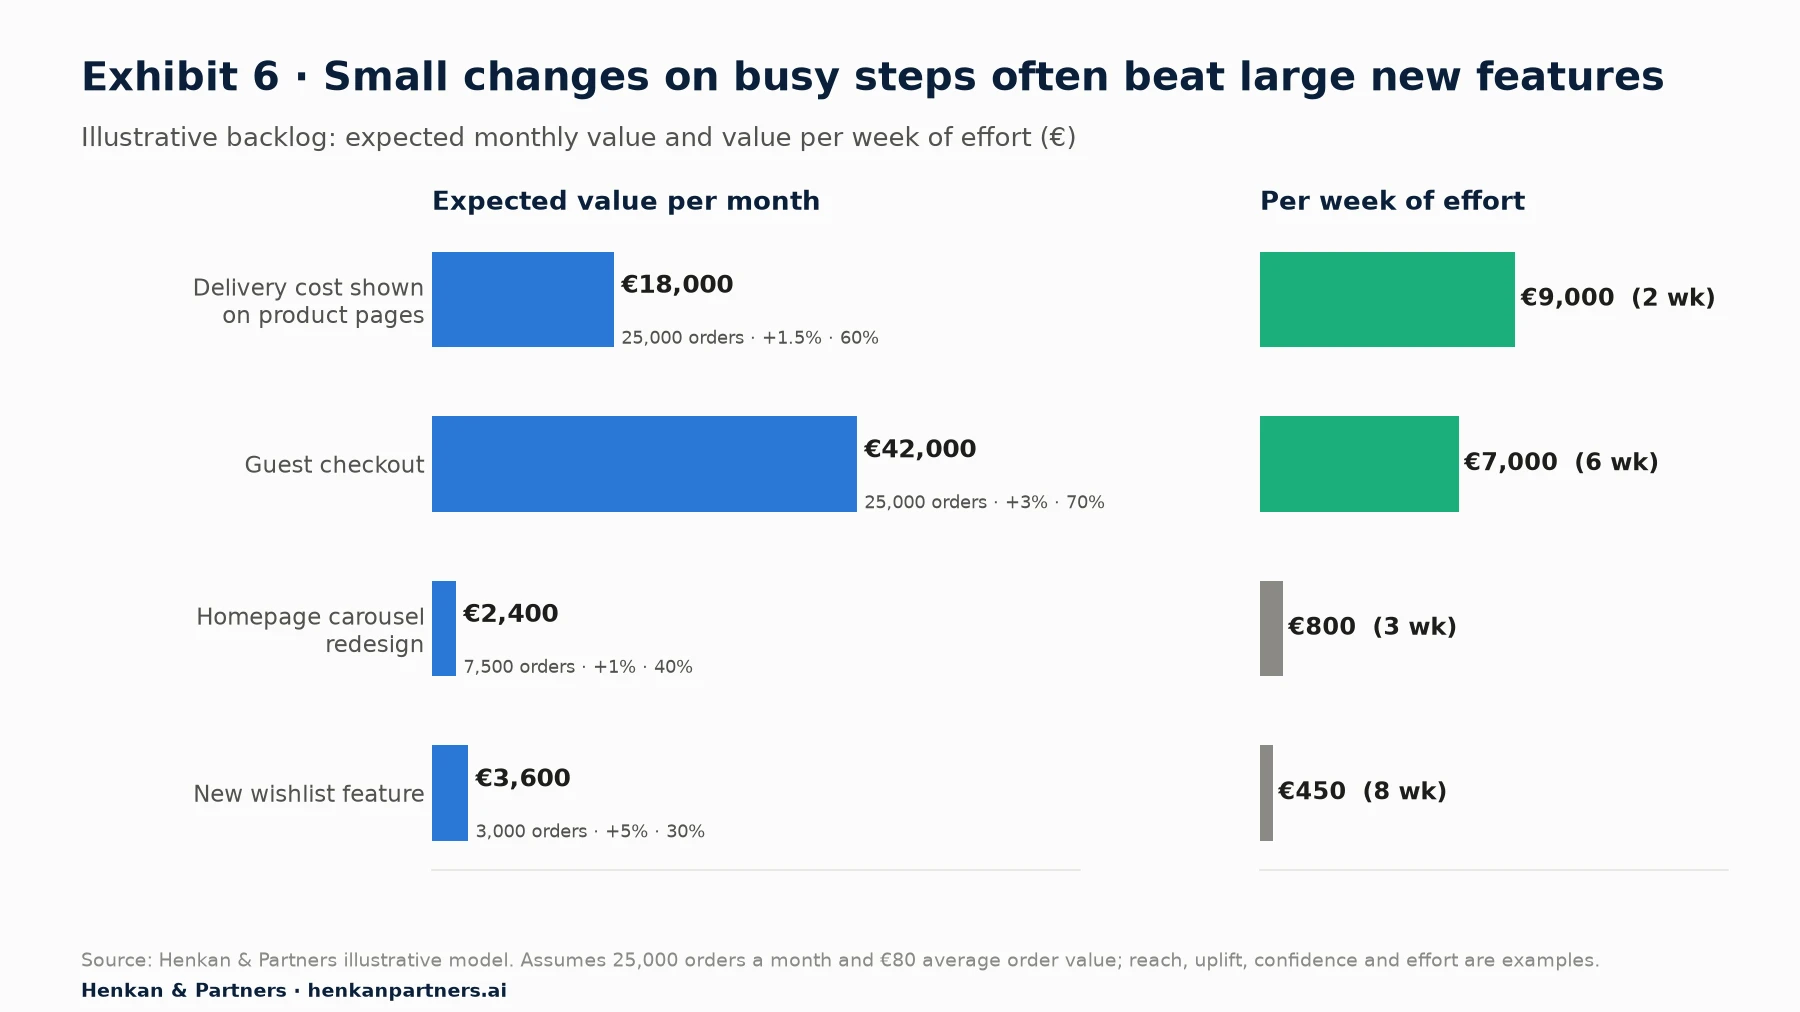
What this shows. In this example, showing delivery costs on product pages delivers the most value per week of effort, and guest checkout the most value in total, because both touch every order. The new wishlist, the kind of feature stakeholders often request, ranks last on value per week of effort. The numbers are illustrative, but the pattern is common: work on steps every customer passes through usually beats features only some customers use.
Keep the method simple enough that the team uses it. Frameworks such as RICE (reach, impact, confidence, effort) follow the same logic. The value is less in the precision of the numbers than in making assumptions visible, so they can be challenged and later compared with test results.
For leaders. Ask for a sizing line on every item that takes more than two weeks. After each release, compare the forecast with the measured result. Within a few quarters, the team's confidence scores become far better calibrated.
Section 8 · Releases as experiments
Feature flags and A/B tests turn releases into measurable bets
A before-and-after comparison is the most common way product teams judge a release, and one of the least reliable. Seasonality, campaigns, price changes and traffic mix all move the numbers at the same time. A controlled experiment removes these effects by showing the old and new versions to randomly split groups of users over the same period.
Modern feature-flag and experimentation tools make this routine for product teams. A new feature ships behind a flag, is switched on for a share of users, and its effect on the target, input and guardrail metrics is measured before a full roll-out. Some tools now offer this for free at small volumes; PostHog's free tier, for example, includes one million feature-flag requests a month.
Three statistical rules every product owner should know
- Decide the sample size in advance. It depends on your baseline rate, the smallest effect worth detecting (the minimum detectable effect) and the confidence you want. A common rule of thumb is about 16 × variance ÷ (effect)² users per variation, so halving the effect you want to detect needs four times as many users.
- Do not stop early when the result looks good. Evan Miller showed that checking repeatedly and stopping at the first significant result can raise the false-positive rate from 5% to about 26% when the versions are in fact identical.
- Watch guardrails as well as the target. A change that lifts clicks but slows the page or raises returns is not a win. Decide the guardrails, and what counts as a failure, before the test starts.
| Situation | Best approach | Why |
|---|---|---|
| High-traffic page or step, reversible change | A/B test behind a feature flag | Enough users to detect realistic effects within weeks |
| Low traffic or a very small expected effect | Qualitative research, usability tests, then ship and monitor | A test would take months and still be inconclusive |
| Bug fix, legal or accessibility requirement | Ship, then monitor guardrails | The decision is made; measure only to catch side effects |
| Large new feature or pricing change | Staged roll-out with a holdout group | Limits risk and gives a clean comparison over time |
For product owners. You do not need to run the statistics yourself, but you should agree the hypothesis, primary metric, guardrails, sample size and duration before a test starts. Our Essential Guide to A/B Testing and our focus on statistical models for A/B testing explain the choices.
Section 9 · Reading the data
Most wrong conclusions come from a handful of avoidable reading mistakes
Product owners rarely need advanced statistics. They do need to avoid the mistakes that turn correct data into wrong decisions. These are the ones we see most often.
| Mistake | What happens | How to avoid it |
|---|---|---|
| Reading averages only | A change in device or visitor mix looks like a change in product performance | Split every key metric by device, channel and new versus returning users |
| Before-and-after comparisons | Campaigns, seasons and price changes are credited to the release | Use an A/B test or a holdout group for decisions that matter |
| Vanity metrics | Page views or clicks rise while orders and retention do not | Tie each metric to the North Star or a guardrail |
| Novelty effects | A new design gets curiosity clicks that fade after a few weeks | Run tests for full weeks and check whether the effect holds over time |
| Adopters vs non-adopters | Engaged users adopt more features, so the feature looks like the cause | Compare randomised groups, not self-selected ones |
| Ignoring missing data | Consent refusals, ad blockers and tracking bugs make numbers look lower or skewed | Know your consent rate and check tracking after every release |
| Changing definitions | A metric changes meaning when an event is renamed or a filter added | Keep definitions in the tracking plan and log every change |
| Too many metrics | Every release "wins" on something | Choose one primary metric per release before looking at results |
Data from web analytics is never a complete count. In Europe, analytics generally needs the visitor's consent, and browsers and ad blockers limit tracking further. Treat analytics as a reliable way to see trends and compare segments, and use experiments when you need to know the size of an effect. Our Essential Guide to Web Analytics explains where the gaps come from.
Section 10 · Tools and AI
Choose tools for the questions you ask, and let AI speed up answers you can still check
Most websites already have web analytics: W3Techs finds Google Analytics on 47.2% of all websites. Product analytics tools such as Amplitude, Mixpanel, PostHog, Heap and Pendo are built around users, events, funnels, cohorts and retention, and are common in apps and logged-in products. Many product teams use both: GA4 for acquisition and e-commerce reporting, and a product analytics tool for feature adoption and retention.
| Need | Typical tools | Notes for product owners |
|---|---|---|
| Traffic, acquisition and e-commerce reporting | Google Analytics 4, Adobe Analytics, Piano, Piwik PRO, Matomo | Usually owned by marketing or analytics; agree shared event names |
| Funnels, cohorts, feature adoption and retention | Amplitude, Mixpanel, PostHog, Heap, Pendo | Built for product questions; strongest in apps and logged-in journeys |
| Why users struggle | Contentsquare, Microsoft Clarity, FullStory, session replay in product tools | Heatmaps and replays explain what the numbers show |
| Experiments and feature flags | Optimizely, AB Tasty, Kameleoon, Statsig, LaunchDarkly, PostHog | Check that experiment data can be joined with your analytics |
| Raw data and custom analysis | BigQuery export from GA4, data warehouses | Needed when questions outgrow the standard reports |
AI is making analytics conversational
Analytics tools now answer questions in plain language. Google launched Analytics Advisor, a Gemini-based assistant in GA4, in December 2025. Amplitude introduced autonomous analytics agents in February 2026, and Mixpanel renamed its AI assistant Spark to Mixpanel Agent in June 2026. Product people are adopting AI quickly: in Atlassian's 2026 survey of 521 product managers, nearly a third used AI for product analytics and data analysis daily or weekly.
These assistants remove much of the time spent building reports, which is exactly the time product owners say they lack. They do not remove the need for good tracking, clear metric definitions and a person who checks whether an answer makes sense. An AI assistant asked why conversion fell will answer from the events and definitions it is given; if the tracking plan is wrong, so is the answer.
For product owners. Use AI assistants for first drafts of analyses and to explore unexpected changes, then check the numbers against a report you trust before sharing them. Ask the assistant to state which events, filters and date ranges it used.
Section 11 · What to do next
Five habits make analytics part of how the product team works, whatever its size
| Team | Start with | Then add |
|---|---|---|
| One product owner, shared developers | A North Star, three input metrics and a one-page tracking plan in GA4 or a free product analytics tier | One purchase funnel by device, reviewed every sprint |
| One or two product squads | A metric tree, tracking in the definition of done, and a monthly retention cohort table | Feature flags and A/B tests on high-traffic steps; sizing for large backlog items |
| Several squads or a product organisation | Shared definitions, a governed tracking plan and an analyst per group of squads | An experimentation programme with guardrails and a searchable log of results; AI assistants on governed data |
1. Write down what success means
Agree a North Star metric, three to five input metrics and the guardrails. Put them at the top of the backlog so every story can be linked to one of them.
2. Make tracking part of done
No story that changes user behaviour is done until its events are defined in the tracking plan, implemented and checked. Assign an owner for the tracking plan.
3. Size the big items
For every item larger than two weeks, estimate orders or users reached, expected uplift, confidence and effort. Compare the forecast with the result after release.
4. Measure every release
Review adoption after two weeks and retention or conversion after a month. Test the changes that matter most with a controlled experiment.
5. Share what you learn
Keep a short log of what was shipped, what was expected and what happened. It prevents the team from repeating failed ideas and helps new members learn faster than any onboarding deck.
FAQ
Frequently asked questions about web analytics for product owners
Frequently asked questions
What analytics should a product owner track?
Start with a North Star metric that reflects customer value, three to five input metrics your team can move, and guardrails that must not get worse. Then track the events needed to measure them: the key steps of your main funnel, the use of each feature you ship, and whether users come back.
What is the difference between web analytics and product analytics?
Web analytics focuses on sessions and pages: where visitors come from, what they do on the website and whether they convert. Product analytics follows individual users over time through events, funnels, feature adoption, cohorts and retention. Many product teams use both, often Google Analytics 4 alongside a tool such as Amplitude, Mixpanel or PostHog.
What is a tracking plan?
A tracking plan is a shared document that lists every event and property you collect, when each one fires, why you collect it and which part of the product sends it. It keeps names consistent, lets testers check tracking before release and makes the data understandable to everyone who uses it.
How do product owners measure feature success?
Define the expected result before you build: the metric, the size of the change and the time frame. After release, check whether users find and try the feature (adoption), keep using it (repeat use) and whether the product outcome improved. For important features, use an A/B test or a staged roll-out, because comparing adopters with non-adopters shows correlation, not cause.
What is a North Star metric?
A North Star metric is the single measure that best captures the value customers get from your product and links it to the revenue the business earns. Examples include orders from repeat customers for a shop or weekly active teams for business software. It is supported by input metrics the team can influence directly.
How long should an A/B test run?
Long enough to reach the sample size you calculated in advance, and for at least one or two full weeks to cover weekday and weekend behaviour. Do not stop a test early because it looks significant: repeated checking can raise the false-positive rate from 5% to about 26%.
Key terms
- Product owner (PO)
- The person accountable for the value a product delivers and for ordering the backlog, in Scrum terms. In many companies the role overlaps with product manager.
- Outcome
- A change in user behaviour or business results, such as more repeat orders. Outputs are what the team ships; outcomes are what those releases change.
- North Star metric
- The single measure that best links the value customers get from the product with the revenue the business earns. It aligns the whole team on one target.
- Input metric
- A metric the team can influence directly and that drives the North Star, such as the share of visitors who find a product through search.
- Guardrail metric
- A metric that must not get worse when you ship a change, such as page speed, returns or unsubscribes. It protects against winning on one number while losing on another.
- Event
- A single recorded user action, such as product_viewed or checkout_started, with properties that describe it. Events are the raw material of product analytics.
- Tracking plan
- A shared document that lists every event and property you collect, why you collect it and which part of the product sends it. It is the contract between product, design, engineering and analytics.
- Funnel
- A sequence of steps users should take, such as product view, add to cart, checkout and purchase, with the share who reach each step. It shows where users drop off.
- Feature adoption
- The share of active users who use a given feature in a period. It tells you whether what you shipped is being used.
- Retention
- The share of users from a period who are still active, or buy again, in a later period. It is the clearest sign that a product delivers lasting value.
- Cohort
- A group of users who share a starting point, such as the month of their first order. Comparing cohorts shows whether the product is getting better over time.
- A/B test
- A controlled experiment that shows different versions to randomly split groups of users and compares the results. It is the most reliable way to know whether a change caused an effect.
- Feature flag
- A switch in the code that turns a feature on or off for chosen users without a new release. It makes gradual roll-outs and experiments easy.
- Minimum detectable effect (MDE)
- The smallest change an experiment is designed to detect reliably. The smaller the MDE, the more users and time the test needs.
Sources
Methodology. This guide was researched in September 2026 from peer-reviewed and practitioner research on online experiments (Kohavi and colleagues), official product documentation (Google Analytics, Segment, Mixpanel, Amplitude), industry research (Baymard Institute) and vendor benchmarks and surveys, which are labelled as vendor data in the text. Every source was opened and checked on 27 September 2026. Exhibits 2 and 6 are Henkan & Partners frameworks and illustrative calculations; they contain no measured data.
- Pendo, The 2019 Feature Adoption Report
- Atlassian, State of Product 2026 report (PDF)
- Atlassian, The State of Product in 2026
- ProductPlan, State of Product Management 2026 (PDF)
- Amplitude, Every Product Needs a North Star Metric
- Amplitude, The North Star Playbook
- Rodden, Hutchinson and Fu, Measuring the User Experience on a Large Scale, CHI 2010
- Dave McClure, Startup Metrics for Pirates
- What Matters, OKR meaning, definition and example
- Holistics, How Amazon uses input metrics (summary of Working Backwards)
- Kohavi, Tang and Xu, Trustworthy Online Controlled Experiments, chapter 1 (Cambridge University Press excerpt)
- Kohavi and Thomke, The Surprising Power of Online Experiments, Harvard Business Review, 2017
- Kohavi, Deng and Vermeer, A/B Testing Intuition Busters, KDD 2022
- Kohavi, Deng, Longbotham and Xu, Seven Rules of Thumb for Web Site Experimenters, KDD 2014
- Optimizely, Scaling experimentation program metrics
- Amplitude, Create a tracking plan
- Twilio Segment, Data collection best practices
- Mixpanel Docs, Events and properties
- Google Analytics Help, Event collection limits
- Google Analytics Help, Custom dimensions and metrics
- Google Analytics Help, Recommended events
- Baymard Institute, Cart abandonment rate statistics
- Contentsquare, Engagement in the 2026 Digital Experience Benchmark
- Contentsquare, Conversion rates in 2026
- Amplitude, 2025 Product Benchmark Report (PDF)
- Amplitude, The 7% retention rule explained
- Amplitude, Product benchmarks every retail and e-commerce company should know
- Evan Miller, How Not To Run an A/B Test
- PostHog, Pricing
- W3Techs, Usage statistics of traffic analysis tools
- Google, Ads Advisor and Analytics Advisor
- Amplitude, Agentic AI analytics announcement, February 2026
- Mixpanel, Spark (now Mixpanel Agent)
- Henkan & Partners, The Essential Guide to Web Analytics
- Henkan & Partners, Beyond the Numbers: How GA4 Actually Works
- Henkan & Partners, The Essential Guide to A/B Testing