Guide
The Essential Guide to Web Analytics
Alexandre Suon · 2026-09-27
Web analytics tells you who comes to your website, where they come from, what they do and whether they buy. This guide explains how it works, which metrics matter for e-commerce, how to plan tracking, attribution, privacy and data quality, how to choose a tool, and how AI is changing the work, for teams of every size.
Executive summary
- Web analytics is the measurement of what visitors do on your website so you can improve it. It covers acquisition (where visitors come from), behaviour (what they do) and outcomes (what they buy or sign up for). It is narrower than marketing analytics, which works across channels and spend, and different from product analytics, which follows users inside a product or app.
- Using data pays, but most organisations still underuse it. Firms that make decisions based on data were 5–6% more productive than expected in a study of 179 large firms. Yet a 2022 Gartner survey found that analytics influences only 53% of marketing decisions, and executives keep naming culture, not technology, as the main barrier.
- Good analytics starts with a measurement plan, not a tool. Start from business objectives, choose a small set of KPIs with targets, and only then decide which events to track. Revenue can be broken down into sessions, conversion rate and average order value, which shows where to look when it moves.
- The data is never complete, so know what it misses. Consent refusals, ad blockers, Safari's cookie limits and bots all distort the numbers. Europe's rules require consent for most analytics, and Google's Consent Mode can model some of the gap. Treat analytics as a reliable trend and a direction finder, not an exact count.
- Google Analytics dominates, but it is not the only good choice. It runs on 47.2% of all websites. Alternatives range from enterprise suites such as Adobe and Piano to privacy-first tools such as Piwik PRO, Matomo and Plausible, and product analytics tools such as Amplitude, Mixpanel and PostHog. Choose based on your questions, your data rules and who will use the tool.
- AI is making analytics conversational, and the basics matter more than ever. Google, Adobe, Amplitude and Mixpanel now answer questions in plain language, and Google's MCP server lets general AI assistants read your data. AI can only be as accurate as the tracking behind it, so clean data, clear definitions and a person who checks the answers are what make it useful.
Web analytics is "the measurement, collection, analysis and reporting of Internet data for the purposes of understanding and optimizing Web usage", in the words of the Web Analytics Association, now the Digital Analytics Association. In practice it means tracking how visitors arrive at a website, what they do there and what they buy, so that a business can improve the experience and its results.
Section 1 · The basics
Web analytics answers three questions: where visitors come from, what they do and what they buy
Every website visit leaves a trail: the link or ad that brought the visitor, the pages they viewed, the products they looked at, the basket they built or abandoned. Web analytics collects that trail, turns it into metrics such as sessions, conversion rate and revenue, and helps teams decide what to change. Avinash Kaushik, whose measurement model is still widely used, groups what it measures into three buckets: acquisition, behaviour and outcomes.
The field sits next to two others that are often confused with it. The boundaries have blurred as tools have added features, but the questions each answers are still different.
| Web analytics | Product analytics | Marketing analytics | |
|---|---|---|---|
| Main question | How do visitors use the website, and does it convert? | How do users use the product or app over time? | Which marketing spend drives results? |
| Unit of analysis | Sessions and pages | Users and features | Channels, campaigns and budgets |
| Typical metrics | Traffic, engagement, conversion rate, revenue per session | Funnels, retention, feature adoption, cohorts | Return on ad spend, cost per acquisition, contribution by channel |
| Typical tools | Google Analytics, Adobe Analytics, Piano, Matomo | Amplitude, Mixpanel, PostHog | Attribution tools, marketing mix models, ad platforms |
| Best for | Websites, e-commerce, content | Apps, SaaS, logged-in journeys | Budget allocation |
For an online retailer, web analytics does most of the daily work: it shows which campaigns bring buyers rather than browsers, which product pages lose visitors, where the checkout leaks, and whether last week's change helped. It is also the starting point for conversion rate optimisation (CRO) and A/B testing, because it tells you where to look. Our Essential Guide to A/B Testing picks up from there.
Section 2 · Why it matters
Data-driven firms perform better, yet analytics still shapes only half of marketing decisions
The best-known evidence comes from economist Erik Brynjolfsson, then at MIT, and colleagues. In a study of 179 large listed firms, they found that firms adopting data-driven decision-making had "output and productivity that is 5-6% higher than what would be expected given their other investments and information technology usage". A later study of US manufacturing plants by Brynjolfsson and Kristina McElheran found that the share of plants making data-driven decisions "nearly tripled (11%-30%) between 2005 and 2010", and that "performance improves after plants adopt DDD, but not before", which, the authors say, is consistent with a causal relationship.
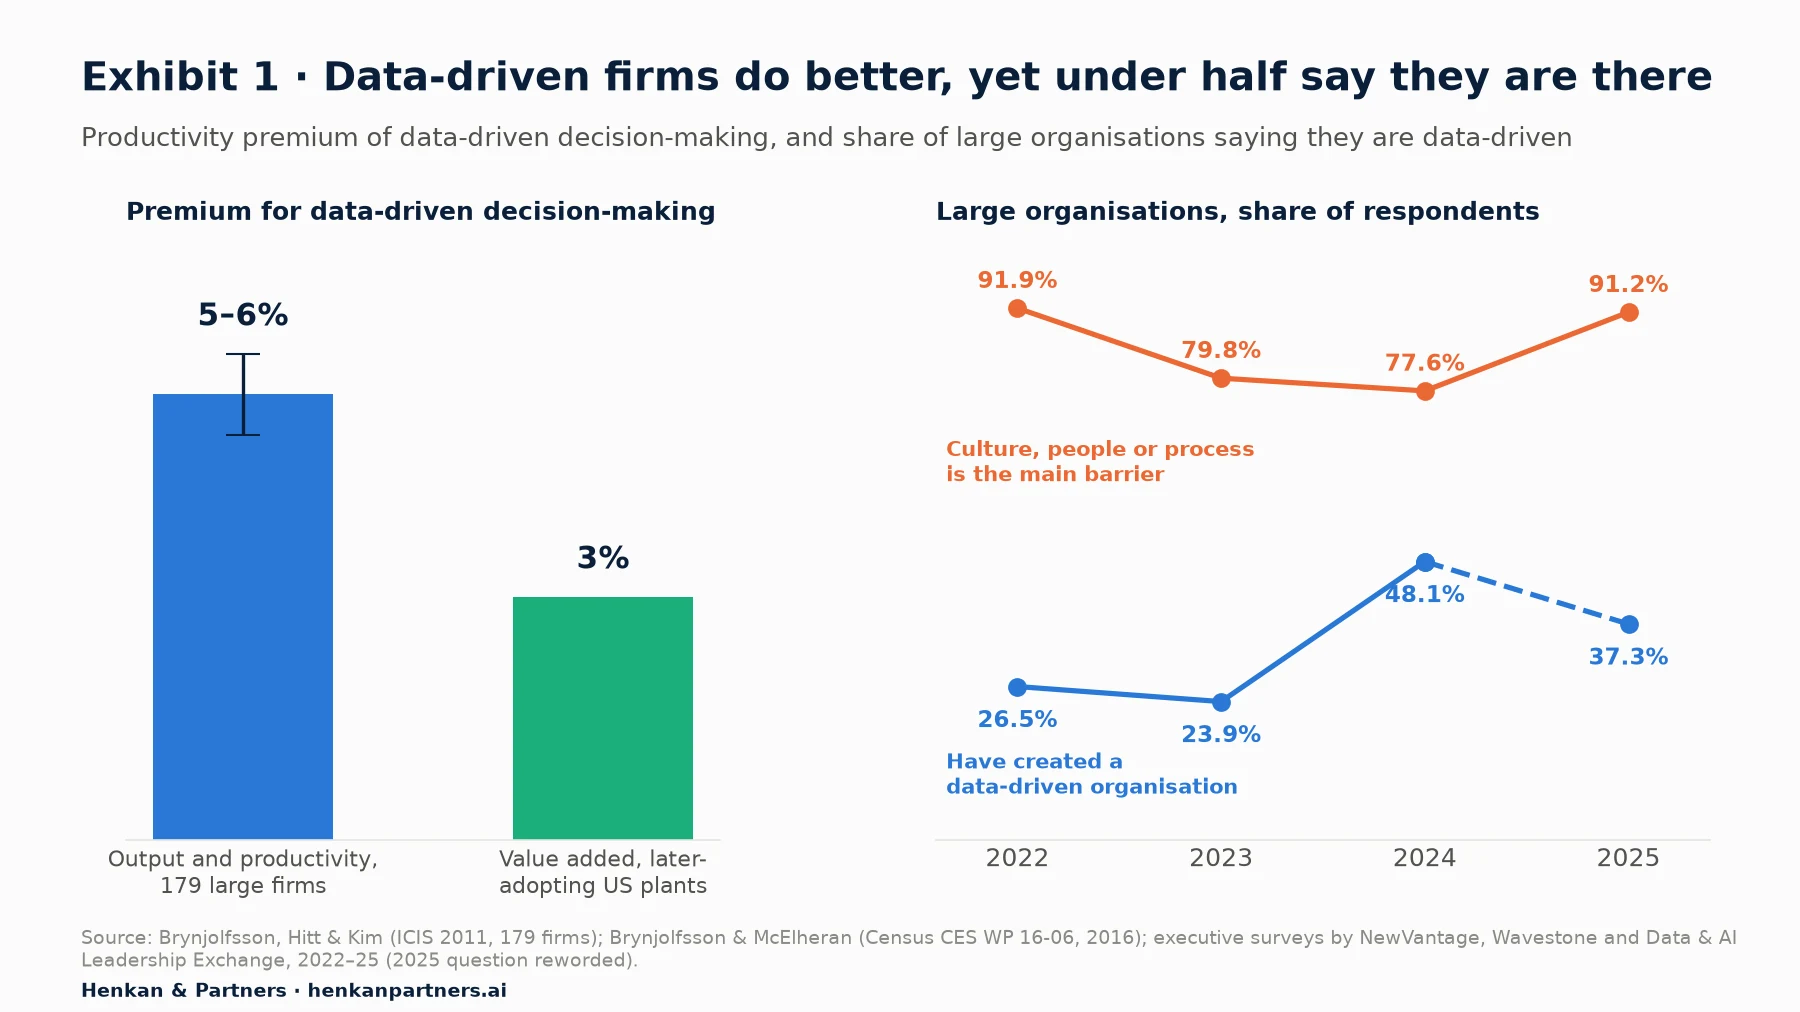
What this shows. The payoff from using data is real and measurable, but most large organisations say they have not become data-driven, and they blame culture far more than technology. Tools are the easy part.
Marketing shows the same gap. In a 2022 Gartner survey of 377 marketing analytics users, analytics influenced "just over half (53%)" of marketing decisions. The main reasons were practical: data inconsistent across sources and hard to access. About a third said decision makers "cherry-pick data" to support a conclusion already reached. Gartner's conclusion was that "better data won't increase marketing analytics' decision influence alone"; habits and culture have to change too.
For e-commerce the stakes are concrete. Baymard Institute puts the average documented cart abandonment rate at 70.22%, averaged across 50 studies, and estimates that a large e-commerce site can gain a 35.26% increase in conversion rate through better checkout design alone. You cannot find or fix those losses without analytics that shows where they happen.
For leaders. Ask for one decision a month that was changed by data, and what happened as a result. It is a better test of your analytics than any dashboard, and it builds the habit Gartner and the executive surveys say is missing.
Section 3 · How it works
A tag records events in the browser, and the tool turns them into sessions, users and reports
Almost all web analytics today uses page tagging: JavaScript on each page sends data to the analytics tool when something happens. Older tools read the web server's log files instead, but tags capture far more, such as clicks, scrolls and basket contents, and work with modern websites that change without reloading.
From a click to a report
- The tag loads. The page loads the analytics script, usually through a tag manager. In Europe, the consent banner decides whether it may set cookies.
- The visitor is recognised. GA4 sets two first-party cookies: `_ga`, "used to distinguish users", and `_ga_<container-id>`, "used to persist session state". Both last two years by default, but browsers shorten them: Chrome caps cookies at 400 days and Safari limits script-set cookies to 7 days without a return visit.
- Events are sent. Each interaction becomes an event with parameters. GA4 collects some automatically (`first_visit`, `session_start`, `page_view`, `user_engagement`), adds more with enhanced measurement (scrolls, outbound clicks, site search, video, file downloads, forms), and relies on you to send business events such as `add_to_cart` and `purchase`.
- The tool processes the data. It groups events into sessions (ending after 30 minutes of inactivity by default), counts users, assigns traffic sources and attribution, and applies filters.
- Reports and exports appear. Standard reports, explorations and the BigQuery export make the data available. Processing is not instant: in GA4, daily data takes about 12 hours for most properties and intraday data 2 to 6 hours on the free version.
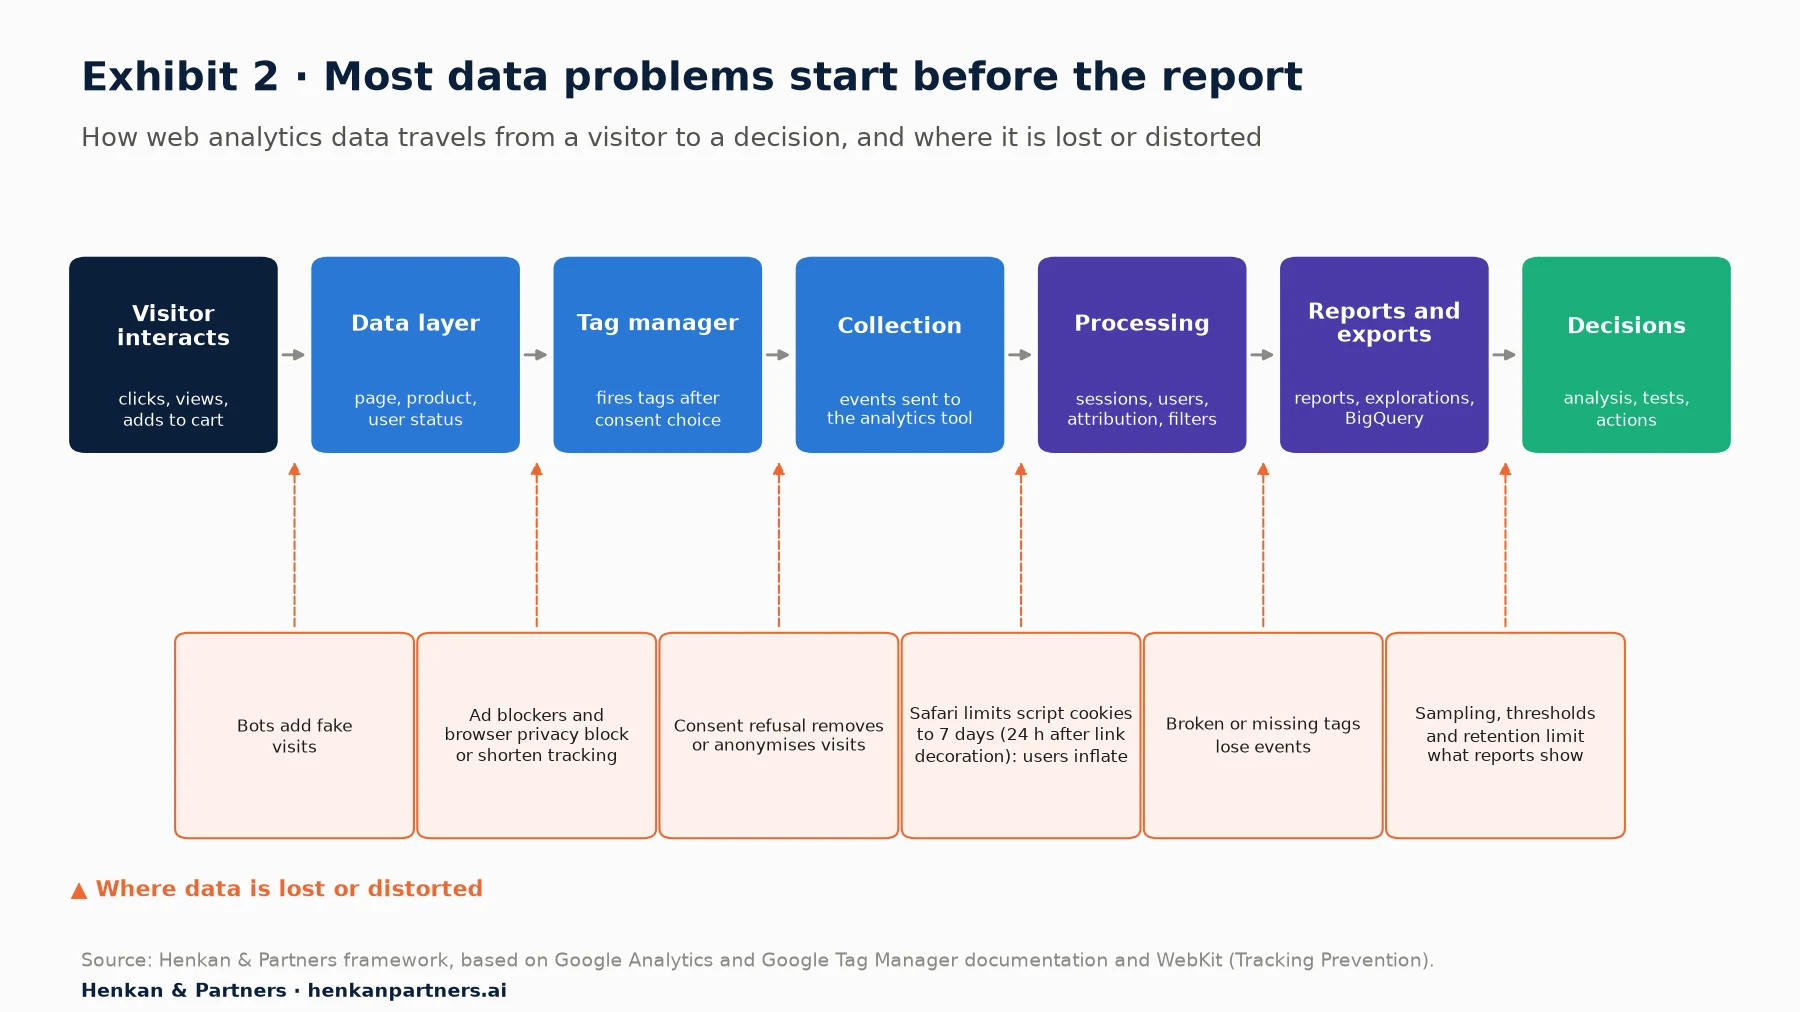
What this shows. Every step between the visitor and the report can drop or distort data. Most analytics problems are not in the reports themselves but upstream, in tags, consent and identification. Knowing the chain tells you where to look when numbers look wrong.
GA4 works differently from Universal Analytics
Google Analytics 4 replaced Universal Analytics, which "stopped processing hits" on 1 July 2023 for the free version and on 1 July 2024 for paying 360 properties that had received a one-time extension. From the week of 1 July 2024, all Universal Analytics data was removed; anything not exported beforehand "will be permanently deleted by Google and won't be recoverable".
The main change is the data model. Universal Analytics was built around sessions and page views, with events as an add-on. GA4 records everything as an event with parameters, which suits apps and single-page websites better but means old reports and habits do not carry over. Bounce rate is a good example: in Universal Analytics it meant single-page sessions; in GA4 it means sessions that were not engaged, the opposite of the engagement rate. And in March 2024 Google renamed GA4 "conversions" to "key events", keeping the word "conversion" for events shared with Google Ads.
For marketers. If your GA4 property was set up quickly during the 2023 migration, check three things today: that data retention is set to 14 months rather than the default 2, that your key events match what the business actually values, and that internal traffic is filtered out. Each takes minutes and affects every report you read.
Section 4 · Metrics
A few metrics explain most changes in online revenue, if they are defined and read consistently
Analytics tools offer hundreds of metrics. For an e-commerce site, a dozen do most of the work. The most useful habit is to see how they connect: revenue is the product of traffic, conversion rate and order value, so when revenue moves you can see which part moved.
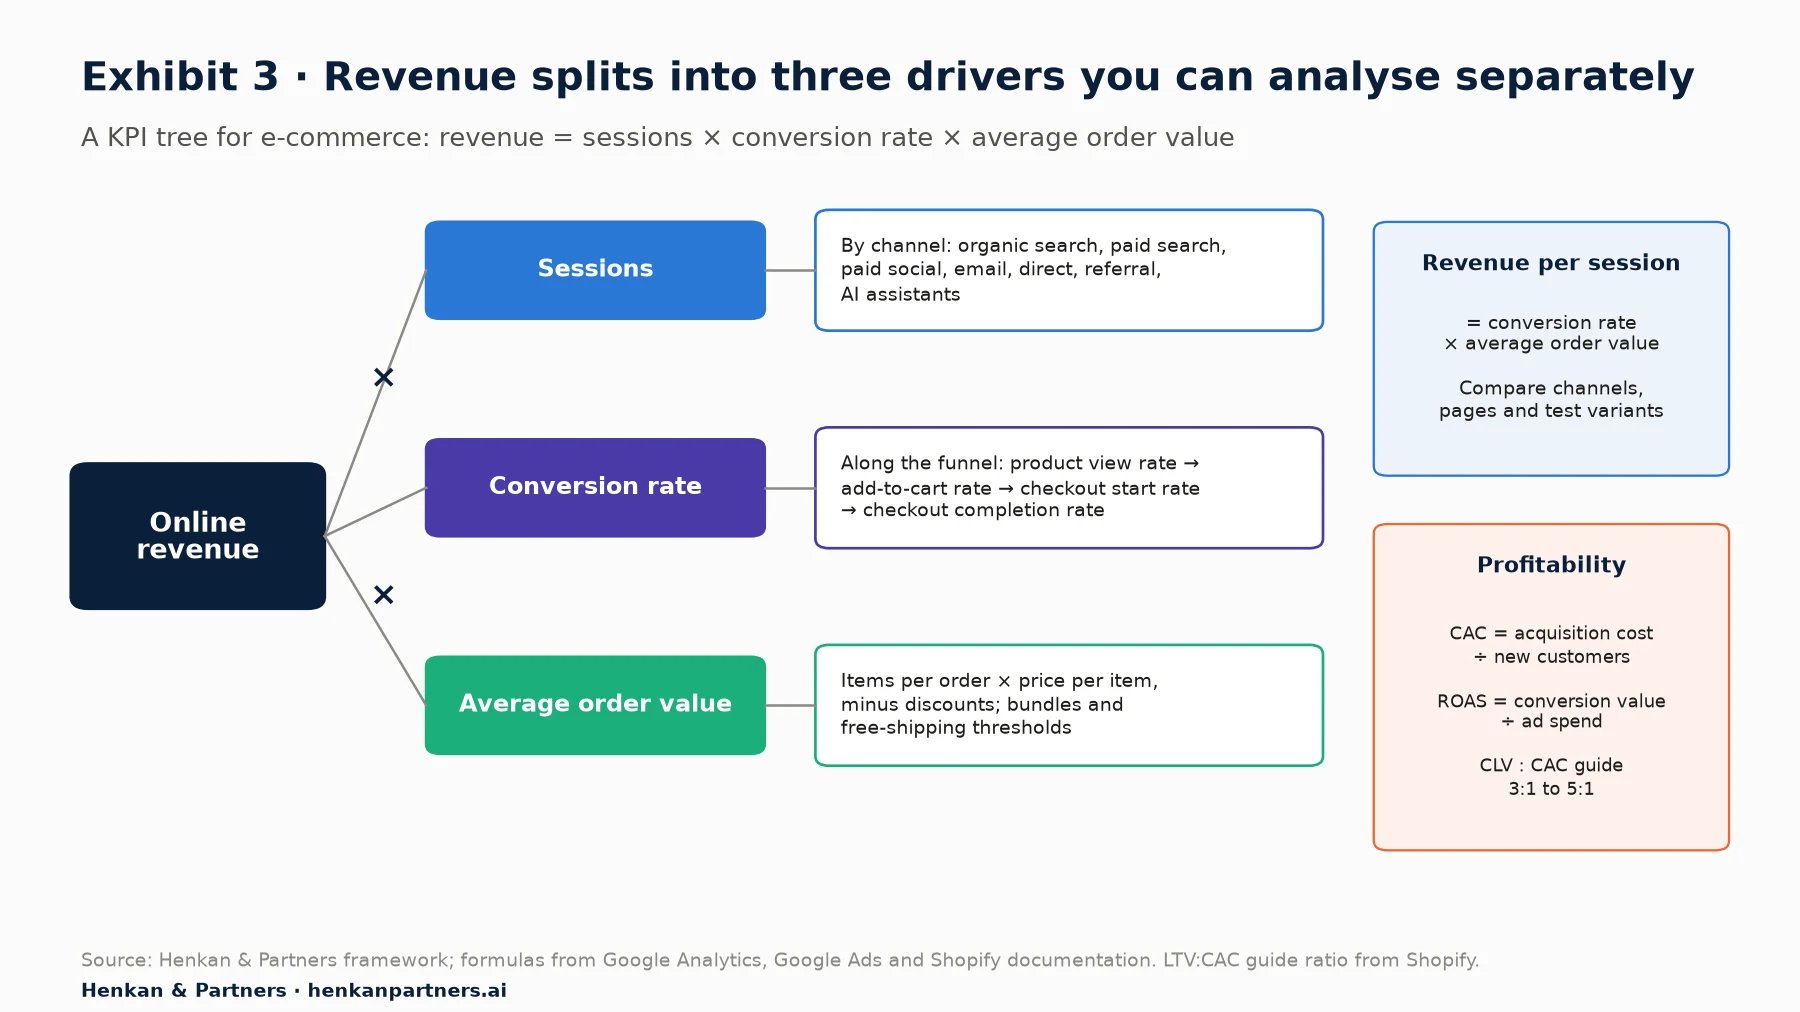
What this shows. A drop in revenue is never just "a drop". It is fewer sessions, a lower conversion rate or smaller baskets, and each points to a different team and a different fix. Revenue per session combines conversion and basket size into one number that is useful for comparing channels and pages.
| Metric | Definition | Why it matters | Watch out for |
|---|---|---|---|
| Sessions | Visits, grouped by 30 minutes of inactivity by default | The volume of opportunities to sell | Bots and internal traffic inflate it; consent refusals and ad blockers reduce it |
| Users | Distinct browsers identified by a cookie, or logged-in IDs | Reach and returning audience | One person on two devices counts twice; Safari's 7-day cookie limit inflates new users |
| Engagement rate | Engaged sessions ÷ sessions (more than 10 seconds, a key event or 2+ page views) | A quick signal of traffic quality by channel or page | Not comparable with Universal Analytics bounce rate |
| Conversion rate | Orders ÷ sessions (or sessions with a purchase ÷ sessions) | The core measure of how well the site turns visits into orders | Falls when you add low-intent traffic, even if sales rise |
| Average order value (AOV) | Revenue ÷ orders | Basket size; responds to pricing, bundles and free-shipping thresholds | A few very large orders can distort it |
| Revenue per session | Revenue ÷ sessions (= conversion rate × AOV) | One number for comparing channels, pages and test variants | Needs enough sessions to be stable |
| Cart abandonment rate | 1 − completed purchases ÷ carts created | Shows where the funnel leaks | Many abandoners were only browsing |
| Customer acquisition cost (CAC) | Acquisition costs ÷ new customers | What growth costs | Needs cost data from outside the analytics tool |
| Return on ad spend (ROAS) | Conversion value ÷ ad spend | Efficiency of paid campaigns | Depends heavily on the attribution model |
| Customer lifetime value (CLV) | Average order value × purchase frequency × customer lifespan | What a customer is worth over time; guides how much to spend to acquire one | Revenue-based CLV ignores margin |
Benchmarks: useful for context, dangerous as targets
Benchmarks come mostly from vendors measuring their own customers, so they vary with panel, country and method. IRP Commerce, which tracks mostly UK retailers, reported a session conversion rate of 2.23% and an average order value of £129.23 for August 2026. Contentsquare's 2026 benchmark, covering 99 billion sessions on more than 6,500 websites, found that mobile brings 69.9% of traffic but converts far less than desktop: "Desktop converts at 3.4%, which is 74% higher than mobile web."
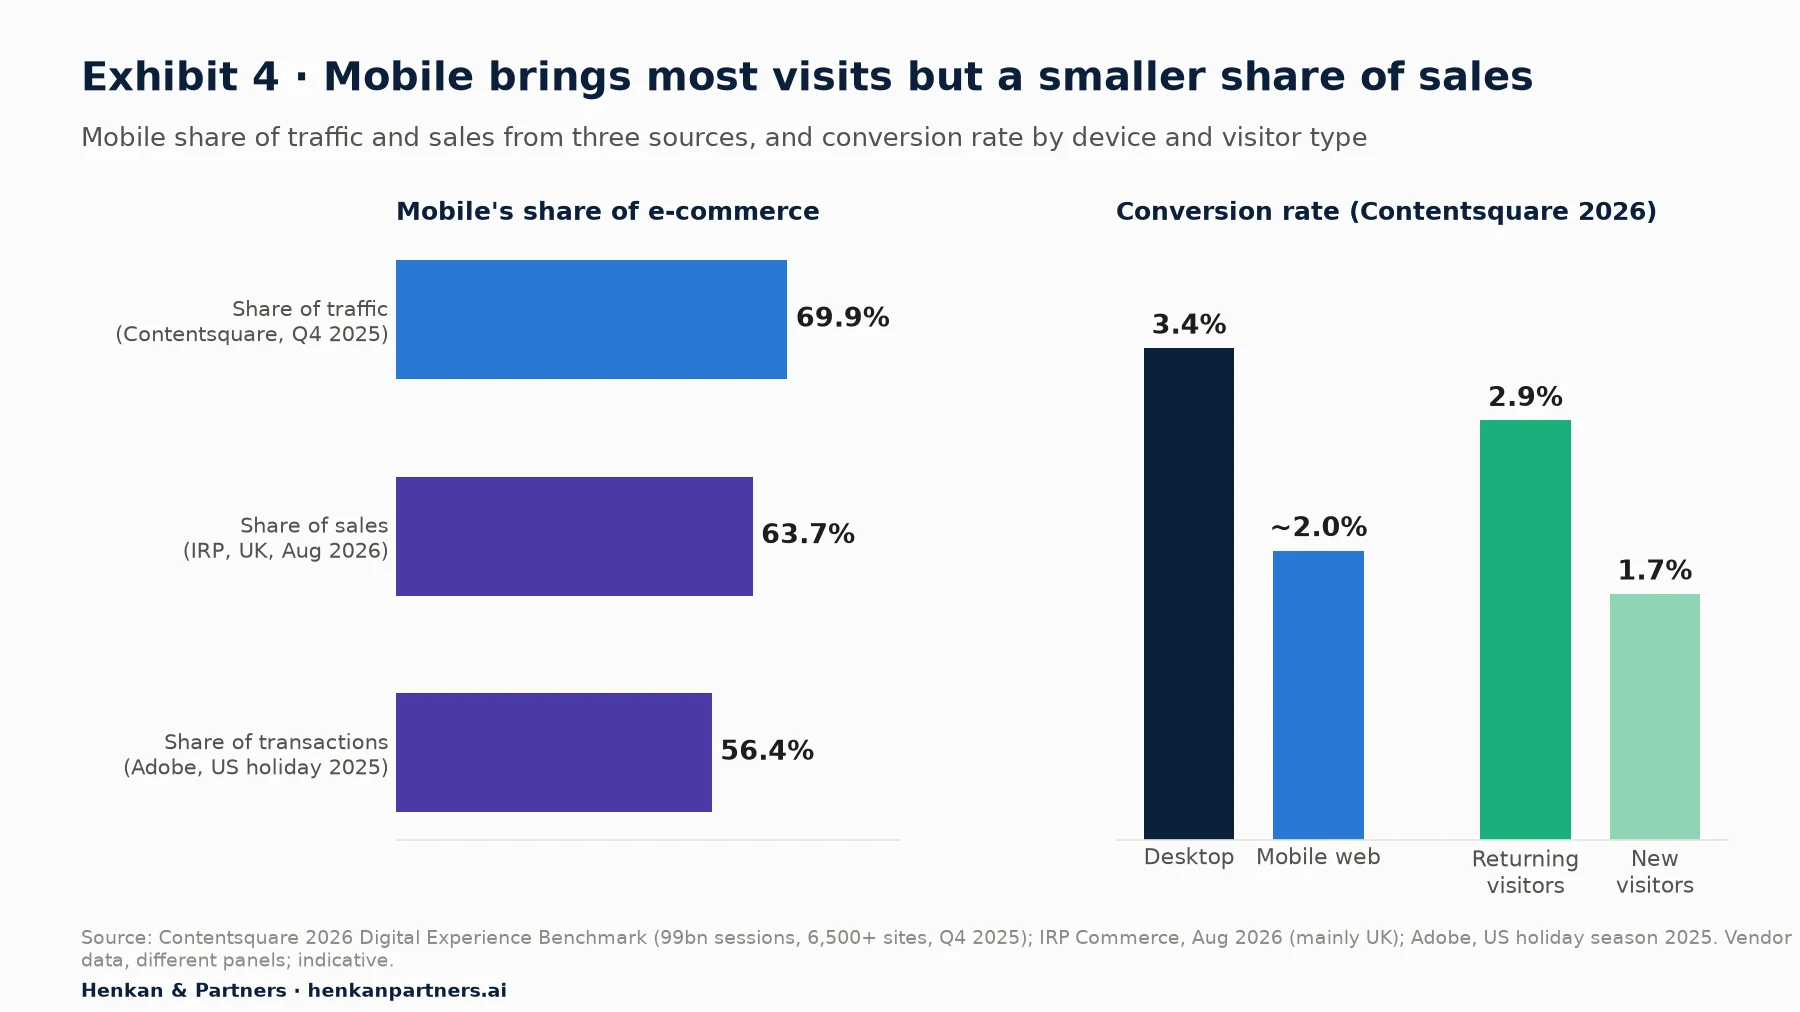
What this shows. Treat an average conversion rate as meaningless on its own: it depends on device mix, the share of new visitors and the traffic sources. Compare your site with itself over time, by segment, and against a benchmark only as a rough sense check.
For marketers. Report conversion rate by device and by new versus returning visitors, never only as one site-wide number. Many "conversion rate drops" turn out to be a shift in traffic mix, for example a successful social campaign bringing more first-time mobile visitors.
Section 5 · Measurement plan
A measurement plan links business objectives to KPIs and events before any tag is written
Most analytics set-ups track whatever the tool collects by default plus whatever someone asked for last month. The result is plenty of data and few answers. A measurement plan reverses the order: start from what the business is trying to achieve, then decide what to measure.
Avinash Kaushik's Digital Marketing and Measurement Model is one of the most widely used frameworks. It has five parts: business objectives ("Why does your website/campaign exist?"), goals (the strategies for reaching them), KPIs ("A metric that helps you understand how you are doing against your objectives"), targets ("Numerical values you've pre-determined as indicators of success or failure") and segments (the groups of people, sources and behaviours you will compare). His advice on agreeing it: "Get the DMMM signed (preferably in blood!) so that all parties are clear on what everyone is supposed to be solving for."
| Layer | Example for an online fashion retailer |
|---|---|
| Business objective | Grow profitable online revenue |
| Goals | Attract more high-intent visitors; convert more of them; increase repeat purchases |
| KPIs | Revenue per session; conversion rate by device; AOV; repeat purchase rate within 90 days |
| Targets | Revenue per session +10% this year; mobile conversion rate from 1.8% to 2.1% |
| Segments | Device; new vs returning; channel; product category; country |
| Events to track | view_item_list, view_item, add_to_cart, begin_checkout, add_shipping_info, add_payment_info, purchase, with item, value and currency |
From plan to tracking
The measurement plan becomes a tracking plan: a list of every event, its parameters, when it fires and who owns it. Google publishes a standard set of recommended e-commerce events, from `view_item_list` and `add_to_cart` through `begin_checkout` to `purchase` and `refund`, and warns that you must "set `currency` at the event level when sending `value` (revenue) data". Using the standard names means GA4's e-commerce reports work without extra configuration.
The events should read from a data layer, which Google describes as "an object used by Google Tag Manager and gtag.js to pass information to tags". Instead of scraping prices and product names from the page, which breaks when the design changes, developers write them into the data layer and tags read them from there. Our Essential Guide to Tag Management covers the data layer and tag manager set-up in detail.
Finally, campaign links need consistent UTM parameters. Google's guidance is that "you should always use `utm_source`, `utm_medium`, and `utm_campaign`", and a shared naming convention (lower case, agreed channel names) prevents the same campaign appearing under five spellings.
For leaders. Ask to see the measurement plan behind your main dashboard. If nobody can show one page linking objectives to KPIs, targets and tracked events, fix that before buying any new tool; it is usually a week of work, and it makes every report afterwards easier to trust.
Section 6 · Attribution
Attribution shows which channels are involved in a sale, not which ones caused it
Most purchases follow several visits: an Instagram ad, a Google search, an email, a direct return. Attribution models decide how to share the credit. For years, tools offered a menu of rule-based models such as first click, last click, linear and time decay. Google retired most of them: in GA4, "the first click, linear, time decay, and position-based attribution models are no longer available as of November 2023". What remains is data-driven attribution, now the default, which uses machine learning to compare the paths of customers who convert with those who do not, plus last-click options.
Data-driven attribution is better than fixed rules, but it has limits. It needs volume: Google recommends at least 200 conversions and 2,000 ad interactions within 30 days for Google Ads. It only sees tracked touchpoints, so consent refusals, ad blockers and offline influences are invisible. And it measures correlation along the path, not what would have happened without the ad.
| Method | What it answers | Strengths | Limits |
|---|---|---|---|
| Last-click attribution | Which channel closed the sale? | Simple, stable, easy to explain | Ignores everything that created demand; favours search and direct |
| Data-driven attribution (GA4, Google Ads) | How should credit be shared across tracked touchpoints? | Default in GA4; uses your own conversion paths | Needs volume; blind to untracked touchpoints; correlational |
| Incrementality tests (lift tests, geo tests) | How many extra sales did this campaign cause? | Measures cause, using a held-out control group | Needs planning and scale; one campaign at a time |
| Marketing mix modelling (MMM) | How should the budget be split across channels, online and offline? | Works on aggregated data, so privacy-safe; covers TV and offline | Needs two or more years of data; less granular; model assumptions matter |
Marketing mix modelling has become far more accessible. Google made its open-source model, Meridian, "available to everyone" in January 2025, and Meta maintains Robyn, another open-source package. Both work on aggregated data and can be calibrated with experiments. For most retailers the practical answer is a mix: data-driven attribution for day-to-day optimisation, incrementality tests for the biggest channels, and a marketing mix model once spend and history justify it.
For leaders. Never let one attribution report decide the budget. When a channel looks very good or very bad, ask for a lift test before moving large sums; attribution tells you where to look, a controlled test tells you whether the money works.
Section 7 · Data quality and privacy
Consent, browsers, ad blockers and bots mean analytics is never a complete count
Consent comes first in Europe
Under European rules, most analytics cookies need the visitor's consent. Banner design has a large effect on how many say yes. In a nine-year study of a consent platform used on thousands of websites, researchers found that "over 60% of users do not consent when offered a simple 'one-click reject-all' option", while about 90% accept when rejecting takes several steps. Where regulators require refusing to be as easy as accepting, as the CNIL does in France, fewer visitors consent.
Google's answer is Consent Mode. Its version 2 added two signals, `ad_user_data` and `ad_personalization`, and advertisers must share consent signals for users in the European Economic Area to keep measurement, personalisation and remarketing working, a requirement that took effect in March 2024. In basic mode, Google tags do not load until the visitor chooses. In advanced mode, they load straight away with consent denied by default and send "measurements without cookies", which lets GA4 model the missing behaviour. Modelling needs volume: at least 1,000 events a day from visitors who refused, for at least 7 days, and at least 1,000 daily users who accepted.
France offers another route. The CNIL, France's data protection authority, exempts audience measurement from consent if it is used strictly to measure the site's or app's audience, produces anonymous statistics only and is not shared or combined with other data. It recommends cookie lifetimes of 13 months and data retention of 25 months. Some tools can be configured this way, and CNIL hosts configuration guides for Piwik PRO and for Piano Analytics (formerly AT Internet); the CNIL page does not name approved vendors, and tools must be set up correctly to qualify. Our focus on user consent in e-commerce covers the rules in depth.
Transfers to the US are legal again, but still contested
In 2022, the Austrian and French regulators ruled that using Google Analytics breached European rules on data transfers to the United States. The EU-US Data Privacy Framework, adopted on 10 July 2023, restored a legal basis for those transfers. On 3 September 2025 the EU General Court dismissed a challenge to it (Latombe, case T-553/23), and an appeal to the Court of Justice is pending. Most businesses can use US-based analytics tools today, but many European firms keep a plan B, such as an EU-hosted tool or server-side collection that strips personal data.
Browsers and ad blockers remove more data
Safari's Intelligent Tracking Prevention "deletes all cookies created in JavaScript and all other script-writeable storage after 7 days of no user interaction with the website", and cuts that to 24 hours when a visitor arrives from a known tracker's link with tracking parameters, such as an ad click. The result is that returning Safari visitors often appear as new users. Chrome, by contrast, will keep third-party cookies: Google abandoned its plan to remove them in July 2024, said in April 2025 it would not add a separate prompt, and in October 2025 retired most of its Privacy Sandbox replacement technologies. Ad blockers add another layer: GWI reports that nearly one in three internet users worldwide use one, with 23% in Europe, and many block analytics scripts as well as ads.
Bots and bad tags add noise
Not every visit is human. Imperva, a security company, reported that automated traffic made up 51% of all web traffic in 2024, the first time in a decade it exceeded human traffic, with bad bots alone at 37%. Analytics tools filter known bots, but sophisticated ones get through and inflate sessions and deflate conversion rates. Tracking errors are just as damaging: in one undated audit of 75 enterprise websites by Verified Data, a firm that sells analytics audits, the average data quality score was 35.7 out of 100, and one site in five was collecting personal data it should not have.
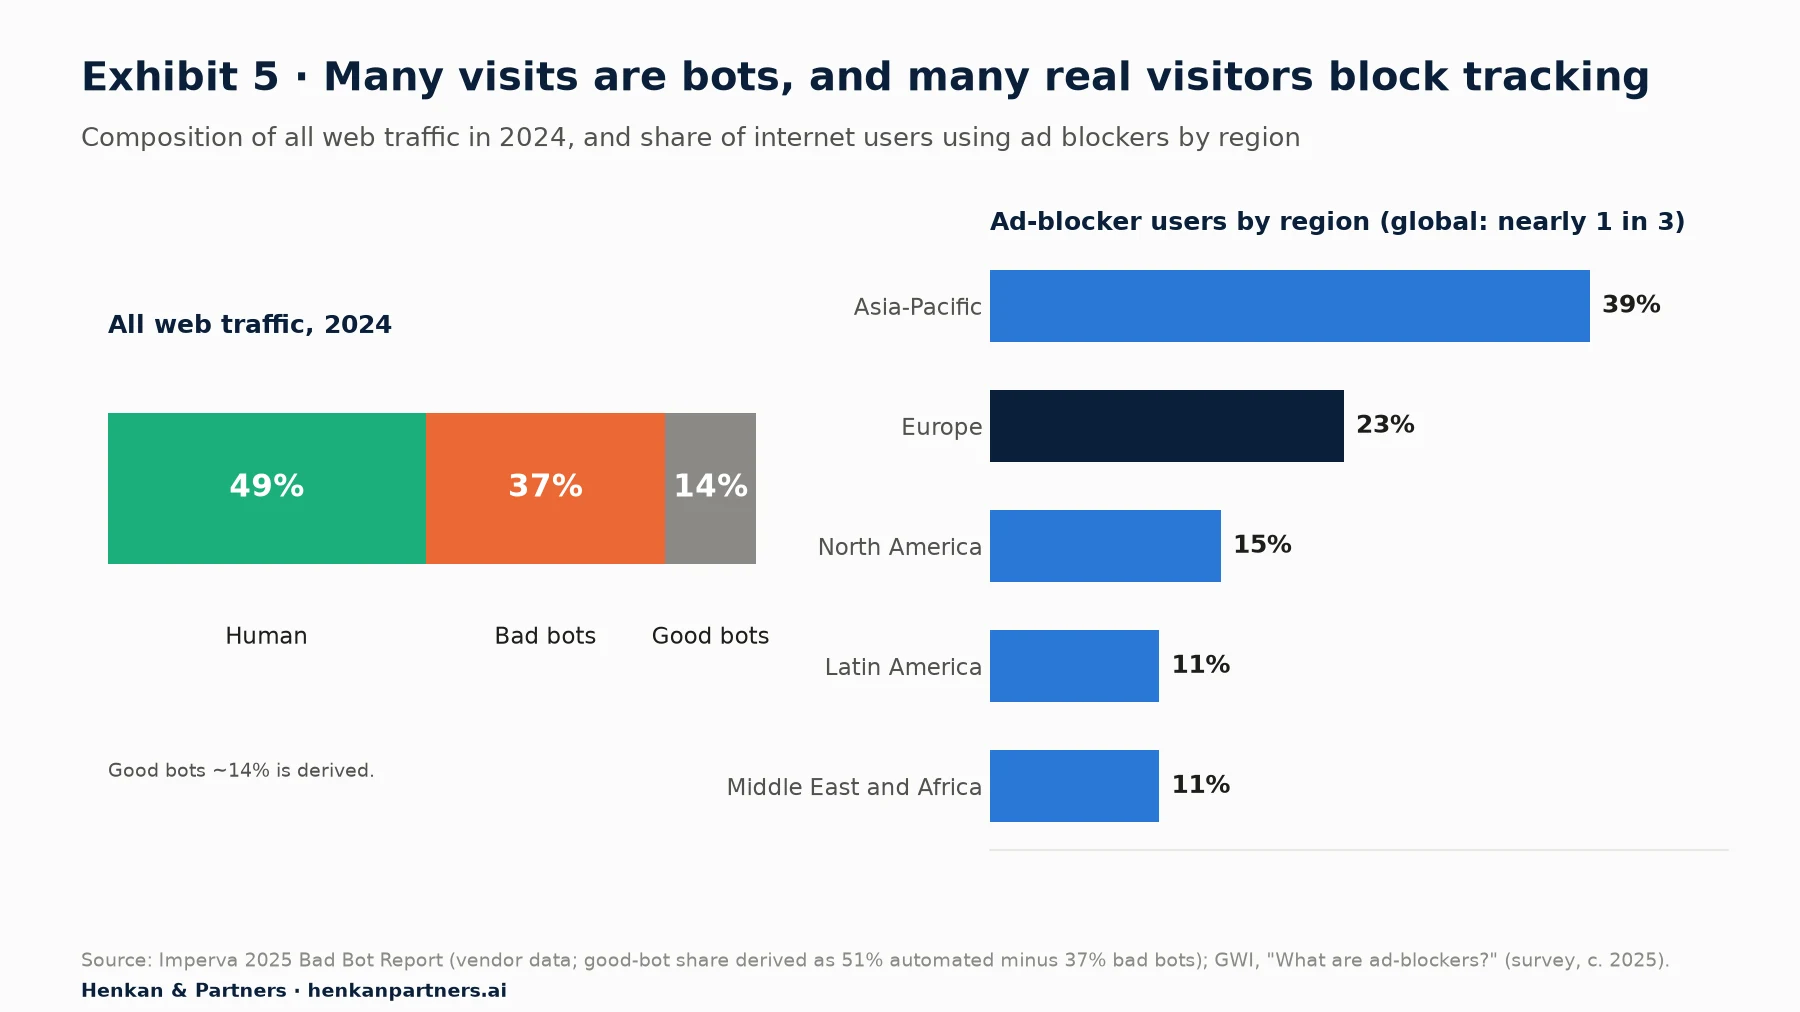
What this shows. Your analytics tool sees a filtered and distorted version of reality: some real customers are missing, some counted visitors are not people. The exact gap differs by site, audience and consent design, so measure it for your own site rather than assuming an industry figure.
Know your tool's limits
GA4 adds its own constraints. Detailed data is kept for 2 months by default (14 months at most on the free version; on 360, up to 50 months for event data and 14 for user-level data). Explorations are sampled above 10 million events on free properties. Reports hide rows when user counts are too low ("thresholding"), and group rare values into an "(other)" row when tables get too long; Google treats "any dimension with more than 500 values" as high cardinality. The free BigQuery export is limited to 1 million events a day. None of this is a problem if you know it; all of it produces wrong conclusions if you do not.
For marketers. Compare your analytics orders with your e-commerce platform's orders every week. The gap is your real measure of data loss, and it varies widely with consent rates and audience. Track it over time: a sudden change usually means a broken tag or a consent banner change, not a change in customer behaviour.
Section 8 · Analysis
Good analysis starts with a question and ends with a decision or a test
Standard reports show what happened. Analysis explains why and what to do. GA4's Explorations offer seven techniques that cover most e-commerce questions: free-form tables, funnel exploration, path exploration, segment overlap, cohort exploration, user exploration and user lifetime. For anything larger or more complex, the BigQuery export gives "all the raw, unsampled event data once per day".
| Question | Technique | Example |
|---|---|---|
| Where do visitors drop out? | Funnel exploration | Product view → add to cart → checkout → purchase, split by device |
| What do people do before buying, or before leaving? | Path exploration | Pages viewed after an out-of-stock message |
| Which visitors are worth the most? | Segments and user lifetime | Revenue per user by acquisition channel over 12 months |
| Do customers come back? | Cohort exploration | Repeat purchase rate by month of first order |
| Did a change work? | A/B test, not a before-and-after comparison | New checkout design against the old one, at the same time |
| Why are they struggling? | Session replay and on-site surveys | Watching sessions that abandoned at the delivery step |
Analytics shows where problems are; it rarely proves what will fix them. Online experiments show why this matters: Ronny Kohavi and Stefan Thomke reported in Harvard Business Review that "at Google and Bing, only about 10% to 20% of experiments generate positive results". Most ideas that look good in the data do not work. The strongest programmes use analytics to find problems, qualitative research such as session replay and voice of customer to understand them, and A/B tests to prove the fix.
For marketers. Write every analysis as three lines: what we saw, what we think it means, and what we will do or test next. It forces a decision, and it makes the work easy to share with people who will never open the analytics tool.
Section 9 · Tools
Google Analytics dominates, but the right tool depends on your questions, your data rules and your team
Google Analytics is by far the most common web analytics tool. According to W3Techs, it runs on 47.2% of all websites and on 82.8% of the websites whose analytics tool can be identified. The free version covers most small and mid-sized sites; GA4 360, sold through Google and its partners, adds higher limits, unsampled explorations and a service-level agreement for large enterprises, at a price Google does not publish.
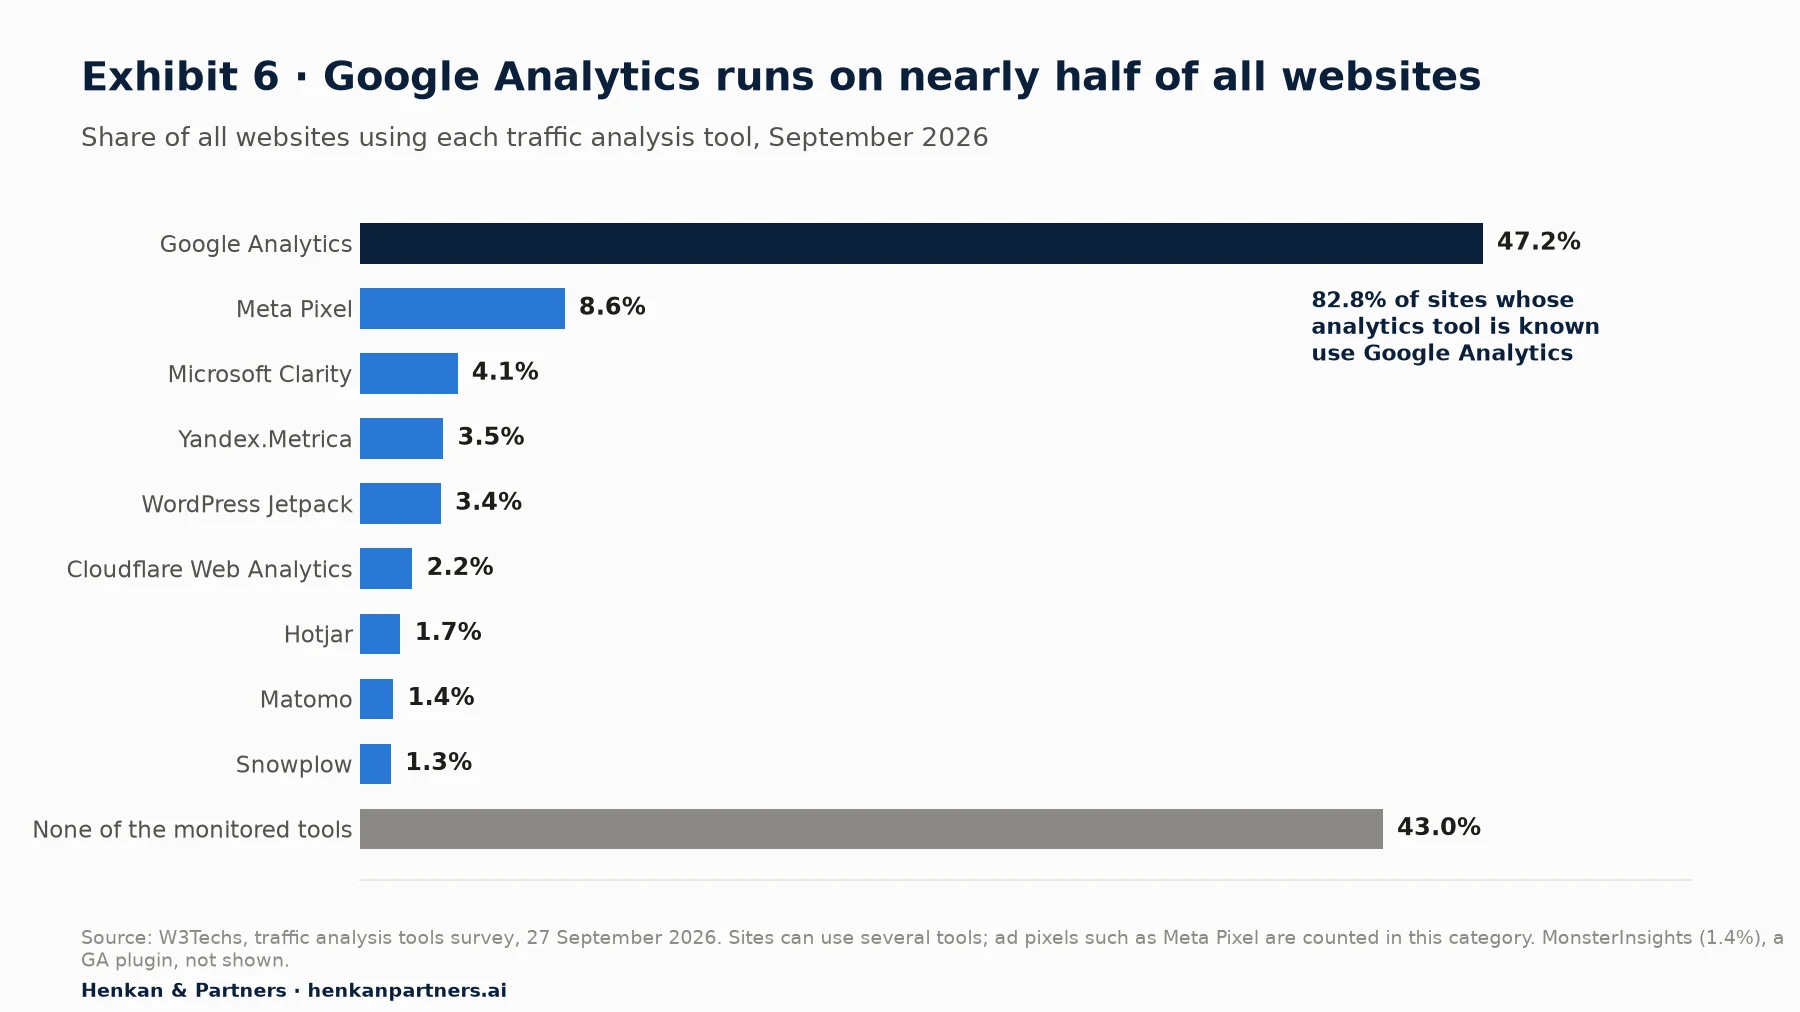
What this shows. Google Analytics is the default almost everywhere, so skills, integrations and agency support are easy to find. But 43% of websites run none of the analytics tools W3Techs monitors, and the alternatives, though small in site count, are often chosen for specific needs such as data ownership, EU hosting or product analytics.
| Tool | Best for | Pricing (published) | Hosting and data location |
|---|---|---|---|
| Google Analytics 4 | Most websites; tight link with Google Ads | Free | Google infrastructure; EU visitor data collected via EU servers, IP addresses not stored |
| Google Analytics 4 360 | Large enterprises needing higher limits and SLAs | Not published | As above |
| Adobe Analytics / Customer Journey Analytics | Large enterprises on the Adobe stack; cross-channel journeys | Not published | Adobe cloud |
| Piano Analytics | Media and European enterprises; unsampled data | Not published | Not stated on vendor pages checked; CNIL-hosted exemption configuration guide |
| Piwik PRO | Privacy-focused organisations, healthcare, public sector | Business plan from €36 a month (free Core plan withdrawn from August 2025) | EU hosting in Sweden |
| Matomo | Organisations wanting full data ownership | On-premise free; cloud from €29 a month | Self-hosted, or cloud in Germany |
| Amplitude | Product-led and app businesses | Free up to 2 million events a month | US, or EU on higher plans |
| Mixpanel | Product analytics and funnels | Free up to 1 million events a month | US or EU |
| PostHog | Tech teams wanting analytics, replay and tests in one tool | Free up to 1 million events a month | US or EU cloud, or self-hosted |
| Plausible / Fathom | Simple, lightweight, privacy-first traffic analytics | From $9 (Plausible) or $15 (Fathom) a month | Plausible EU; Fathom strips EU visitors' IP addresses in the EU, then stores anonymised data in the US |
| Microsoft Clarity | Free heatmaps and session replay alongside analytics | Free | Microsoft; consent signals required for EEA, UK and Swiss visitors since October 2025 |
How to choose
- Start from your questions. Traffic, campaigns and e-commerce funnels suit web analytics tools; logged-in journeys and retention suit product analytics tools.
- Check your data rules. If you need consent-exempt measurement in France, EU-only hosting or full data ownership, shortlist the tools that support it before comparing features.
- Count your events. Event volumes drive price and limits: check free-tier caps, sampling thresholds and export limits against your traffic.
- Think about integrations. Ad platforms, your testing tool, your data warehouse and your consent platform all need to connect.
- Be honest about skills. A simple tool that everyone uses beats a powerful one that only one analyst understands.
Section 10 · Mistakes
Ten common web analytics mistakes, and how to avoid them
- Leaving data retention at 2 months. GA4's default deletes detailed data after two months, which breaks year-on-year explorations. Set it to 14 months.
- Tracking without a measurement plan. Hundreds of events and no agreed KPIs produce reports nobody uses. Write the plan first.
- Not filtering internal traffic. Staff, agencies and test visits distort small sites badly. GA4 lets you define internal traffic and exclude it with a data filter.
- Sending revenue without currency. Google requires `currency` whenever an event sends `value`; without it, revenue reports are wrong.
- Mixing test and live sites in one property. Staging traffic and test orders pollute real data. Use separate properties or strict filters.
- Inconsistent UTM tagging. "Facebook", "facebook" and "fb" become three sources. Agree a naming convention and use a link builder.
- Scraping data from the page instead of a data layer. Tracking that reads prices or names from the screen breaks with every redesign.
- Treating averages as answers. Site-wide conversion rate and bounce rate hide what matters. Segment by device, channel and new versus returning visitors.
- Ignoring the gap with real orders. If analytics shows 20% fewer orders than your back office, every channel report is off. Measure the gap and watch it.
- Reading correlation as cause. A page viewed by buyers does not make people buy. Use experiments to prove what works.
Several of these appear in practitioner lists, such as Analytics Mania's ten most common GA4 mistakes, which include missing currency, 2-month retention, mixing live and test sites and not excluding internal traffic.
Section 11 · AI
AI is turning analytics into a conversation, but it can only be as good as the data and definitions behind it
The major tools now include AI that explains data in plain language. Google Analytics' generated insights "summarizes the top three data changes since your last visit"; Analytics Advisor, "an agentic conversational AI assistant, powered by Gemini", rolled out from December 2025; and in May 2026 Google added Ask Advisor on Gemini 3, which builds charts and flags performance gaps. Adobe made its Data Insights Agent for Customer Journey Analytics generally available in September 2025. Amplitude launched AI agents in June 2025 and a global agent in February 2026, and Mixpanel made its AI generally available in May 2026.
A second route is the Model Context Protocol (MCP), an open standard that lets general AI assistants such as Claude, ChatGPT or Gemini query your analytics directly. Google released an official, read-only Google Analytics MCP server in July 2025, labelled experimental; Amplitude, Mixpanel and Piano (in private beta) offer their own. Instead of exporting a report, you can ask "Which channels drove the drop in mobile revenue last week?" and get an answer from live data.
AI is also changing the traffic itself. Since May 2026, GA4 automatically groups visits from recognised AI assistants into a new "AI Assistant" channel. Contentsquare's 2026 benchmark (vendor data) found that AI-referred traffic converts at 1.3%, below paid search at 2.8%, so it is worth watching as its own segment.
Where AI analytics goes wrong
Accuracy is the main risk. When LinkedIn tested its own production text-to-SQL assistant, expert reviewers judged 53% of answers "correct or close to correct". On the Spider 2.0 benchmark of real enterprise data questions, leading AI models solved only 10% to 17% of tasks when first tested, though specialised systems built around them now score far higher. In analytics, a confident wrong answer is worse than no answer.
| AI helps with | What to check |
|---|---|
| Spotting anomalies and summarising what changed | That the change is real and not a tracking or consent issue |
| Answering questions in plain language | The metric definitions, date range and filters it used |
| Writing queries (SQL for BigQuery, report configurations) | That the query runs on the right tables and sessions or users as intended |
| Drafting tracking plans and checking event naming | Against your measurement plan and Google's recommended events |
| Explaining results to non-specialists | That the summary includes the uncertainty and the data gaps |
For leaders. AI will make analytics available to everyone in the company, which is good news only if everyone gets the same answer. Before rolling it out, agree the definitions of your ten most important metrics, make sure tracking follows the measurement plan, and keep a named analyst responsible for checking what AI produces on important decisions.
Section 12 · By team size
The right set-up depends on who uses the data and how much you sell online
| Team | Recommended set-up | Why |
|---|---|---|
| One or two people (small shop or first set-up) | GA4 free with e-commerce events; 14-month retention; internal traffic filtered; consent banner with Consent Mode; a one-page measurement plan; a monthly review of five KPIs; free Microsoft Clarity for session replay | Covers most needs at no cost; the discipline matters more than the tool |
| Growing e-commerce or CRO team | Tag manager with a data layer; tracking plan with owners; weekly check against back-office orders; BigQuery export; dashboards by device and channel; analytics feeding the testing roadmap; AI assistants for questions and summaries | More people and more campaigns need consistent data and shared definitions |
| Multi-brand or international retailer | Documented data governance; server-side tagging; data warehouse as the source of truth; GA4 360, Adobe or Piano where limits or data rules require it; incrementality tests and marketing mix modelling; AI connected through MCP with access rules | Scale, regulation and budget decisions need auditable, consistent data |
Section 13 · What to do next
Five moves to make your web analytics trustworthy and useful
1. Write the measurement plan
One page: objectives, goals, KPIs with targets, segments and the events that feed them. Get it agreed by the people who will use it.
2. Fix the foundations
Set retention to 14 months, filter internal traffic, use Google's recommended e-commerce events with currency, and move tracking onto a data layer.
3. Measure what you are missing
Compare analytics orders with back-office orders, check your consent rate, and set up Consent Mode so you know how large the gap is and whether modelling can fill part of it.
4. Turn reports into decisions
Review a small set of KPIs by device, channel and customer type every week, and end every analysis with an action or a test.
5. Add AI with guardrails
Use AI to spot changes and answer questions faster, but agree metric definitions first and keep a person accountable for important conclusions.
Our view. Web analytics is not about collecting more data; it is about understanding customers well enough to give them a better experience, which is what grows revenue and lifetime value. Most organisations already have enough data. What they lack is a clear plan, clean tracking and the habit of acting on what they see.
FAQ
Frequently asked questions about web analytics
Frequently asked questions
What is web analytics?
Web analytics is the measurement, collection, analysis and reporting of website data to understand and improve how people use a website. It shows where visitors come from, what they do and whether they convert, using tools such as Google Analytics, Adobe Analytics, Piano, Matomo or Piwik PRO.
What is the difference between web analytics and product analytics?
Web analytics focuses on websites, sessions, traffic sources and conversion. Product analytics follows identified users inside a product or app over time, with funnels, retention and feature adoption. The tools overlap more each year, but the questions differ.
Which web analytics metrics matter most for e-commerce?
Sessions, conversion rate, average order value and revenue per session explain most changes in online revenue. Add engagement rate for traffic quality, cart abandonment for funnel leaks, and customer acquisition cost, return on ad spend and customer lifetime value for profitability.
Is Google Analytics 4 free?
Yes. The standard version of GA4 is free and suits most websites. GA4 360 is a paid enterprise version with higher limits, longer data retention, unsampled explorations and a service-level agreement; Google does not publish its price.
Is Google Analytics legal in Europe?
Yes, with conditions. Since the EU-US Data Privacy Framework of July 2023, transfers to certified US companies such as Google are lawful, and the EU General Court upheld the framework in September 2025, though an appeal is pending. You still need consent for analytics cookies in most EU countries.
Why don't my analytics numbers match my sales?
Consent refusals, ad blockers, browser cookie limits, bots and broken tags all create gaps between analytics and your order system. Compare the two regularly, fix tracking errors, and use Consent Mode modelling where eligible. Treat analytics as a reliable trend rather than an exact count.
How is AI changing web analytics?
AI now summarises changes, answers questions in plain language and writes queries in tools such as Google Analytics, Adobe, Amplitude and Mixpanel, and MCP servers let general assistants query analytics data. It saves time, but answers can be wrong, so clean tracking, agreed metric definitions and human review remain essential.
Key terms
- Tag
- A small piece of JavaScript on your pages that sends data to an analytics tool when something happens. Most sites manage tags through a tag manager such as Google Tag Manager.
- Event
- A single recorded interaction, such as a page view, a click, an add to cart or a purchase. Google Analytics 4 (GA4) records everything as events, each with parameters that describe it.
- Session
- A group of interactions by one visitor within a time frame. In GA4 a session ends after 30 minutes of inactivity by default.
- User
- A visitor, usually identified by a first-party cookie in one browser. The same person on two devices counts as two users unless you identify them, for example when they log in.
- Engagement rate
- In GA4, the share of sessions that last more than 10 seconds, include a key event or have two or more page views. Bounce rate is its opposite.
- Key event
- An event you mark as important to the business, such as a purchase or a sign-up. GA4 renamed "conversions" to "key events" in March 2024.
- Conversion rate
- The share of sessions (or users) that complete a key action, usually a purchase. The most watched e-commerce metric, and one of the easiest to misread.
- Average order value (AOV)
- Revenue divided by number of orders. With traffic and conversion rate it explains most changes in online revenue.
- Data layer
- A structured object on your pages that holds information such as product, price and user status for tags to read. It keeps tracking consistent when the website changes.
- UTM parameters
- Tags added to campaign links, such as utm_source, utm_medium and utm_campaign, that tell analytics where a visit came from.
- Attribution
- The rules for giving credit for a sale to the marketing touchpoints that preceded it. GA4 now offers data-driven attribution and last-click models.
- Consent Mode
- Google's way of adjusting how its tags behave based on each visitor's cookie choice, and of modelling some of the data lost when visitors refuse.
- Sampling
- Analysing a subset of data to answer a query faster. GA4 samples explorations above 10 million events on free properties.
- Data retention
- How long user-level data is kept for detailed analysis. GA4 defaults to 2 months; most businesses should change it to 14.
- Measurement plan
- A document that links business objectives to KPIs, targets and the events you will track. It is the foundation of trustworthy analytics.
- BigQuery export
- A GA4 feature that copies raw, unsampled event data to Google's data warehouse for deeper analysis, up to 1 million events a day on free properties. Setting it up is free; BigQuery storage and queries are billed beyond the free sandbox.
Sources
Academic papers, surveys, regulators' decisions, vendor documentation and benchmark reports were checked against the original pages on 27 September 2026. Vendor benchmarks and claims about their own products are labelled as such. The data flow, KPI tree, measurement plan example, method and tool tables, team-size table and recommendations are Henkan & Partners' own analysis.
- Wikipedia, Web analytics (citing the Web Analytics Association definition, 2008)
- Smart Insights, Web analytics strategy
- PostHog Docs, Product analytics
- Salesforce, Marketing Analytics: Definition and Strategies
- Brynjolfsson, Hitt and Kim, Strength in Numbers: How Does Data-Driven Decision-Making Affect Firm Performance?, ICIS 2011
- Brynjolfsson and McElheran, The Rapid Adoption of Data-Driven Decision-Making, American Economic Review, 2016
- Brynjolfsson and McElheran, Data in Action: Data-Driven Decision Making in U.S. Manufacturing, Census CES Working Paper 16-06
- NewVantage Partners, 2022 Data and AI Executive Survey (Business Wire)
- Wavestone, 2024 Data and AI Leadership Executive Survey
- Data & AI Leadership Exchange, 2025 AI & Data Leadership Executive Benchmark Survey
- Gartner, Marketing Analytics are Only Influencing 53% of Decisions, September 2022
- Baymard Institute, Cart Abandonment Rate Statistics
- Google Analytics Help, Google Analytics cookie usage on websites
- Google Analytics Help, About Analytics sessions
- Google Analytics Help, Automatically collected events
- Google Analytics Help, Enhanced measurement events
- Google Analytics Help, Engagement rate and bounce rate
- Google Analytics Help, About key events
- Search Engine Journal, Google Unifies Conversion Reporting Across Ads and Analytics, March 2024
- Google Analytics Help, Universal Analytics is going away
- Google Analytics Help, Data retention
- Google Analytics Help, Data thresholds
- Google Analytics Help, About data sampling
- Google Analytics Help, About the (other) row
- Google Analytics Help, BigQuery Export
- Google Analytics Help, Data freshness
- Google Analytics Help, Analytics 360 and standard property limits
- Google Analytics Help, Get started with Explorations
- Google Analytics Help, Data filters and internal traffic
- Google Analytics Help, Known bot-traffic exclusion
- Google for Developers, Measure ecommerce (GA4)
- Google for Developers, The data layer
- Google Analytics Help, URL builders: collect campaign data with custom URLs
- Shopify, Average order value
- Shopify, Customer lifetime value
- Shopify, Customer acquisition cost
- Google Ads Help, About Target ROAS bidding
- Omnisend, Reduce shopping cart abandonment
- IRP Commerce, Ecommerce Market Data, August 2026
- Contentsquare, 15 mobile analytics stats from the 2026 benchmark report
- Contentsquare, Conversion rates in 2026: benchmarks
- Contentsquare, How digital traffic is changing in 2026
- Adobe, Holiday shopping season drove a record $257.8 billion online, January 2026
- Avinash Kaushik, Digital Marketing and Measurement Model, Occam's Razor
- Google Analytics Help, Get started with attribution
- Google Ads Help, About attribution models
- Google Ads Help, About data-driven attribution
- Google Ads Help, About Conversion Lift
- Google, Meridian is now available to everyone, January 2025
- Google Meridian (GitHub)
- Meta, Robyn
- Meta, Robyn: Analyst's guide to MMM
- Jha et al., Privacy Policies and Consent Management Platforms: Growth and Users' Interactions over Time, 2024
- Google Ads Help, Updates to consent mode for traffic in the EEA
- Usercentrics, Google's March deadline for consent mode
- Google for Developers, Consent mode overview
- Google Analytics Help, Behavioral modeling for consent mode
- CNIL, Cookies: solutions pour les outils de mesure d'audience
- CNIL, Refuser les cookies doit être aussi simple qu'accepter, 2021
- CNIL, Exemption configuration guide for Piwik PRO
- CNIL, Exemption configuration guide for Piano Analytics (AT Internet), 2024
- noyb, Austrian DSB: EU-US data transfers to Google Analytics illegal, January 2022
- Journal du Geek, Google Analytics: tout comprendre à la décision de la CNIL, February 2022
- Wikipedia, EU–US Data Privacy Framework
- Court of Justice of the EU, Press release 106/25 (Latombe v Commission), September 2025
- Digital Policy Alert, Latombe appeal against the General Court ruling, October 2025
- WebKit, Tracking Prevention in WebKit
- Google Privacy Sandbox, A new path for Privacy Sandbox on the web, July 2024
- Google Privacy Sandbox, Next steps for Privacy Sandbox and tracking protections in Chrome, April 2025
- Google Privacy Sandbox, Update on plans for Privacy Sandbox technologies, October 2025
- GWI, What are ad-blockers?
- Imperva, 2025 Bad Bot Report (Business Wire)
- Verified Data, Google Analytics Audit Study
- Kohavi and Thomke, The Surprising Power of Online Experiments, Harvard Business Review, 2017
- W3Techs, Usage statistics of traffic analysis tools for websites
- Google Analytics Help, EU-focused data and privacy
- Adobe Experience League, Customer Journey Analytics and Adobe Analytics feature comparison
- Piano, Piano Analytics
- Piwik PRO, Introducing new pricing, 2025
- Matomo, Pricing
- Amplitude, Pricing
- Mixpanel, Pricing
- PostHog, Pricing
- Plausible Analytics, Pricing
- Fathom Analytics, Pricing
- Fathom Analytics, EU Isolation
- Microsoft Clarity
- Microsoft Clarity, Cookie consent update
- Analytics Mania, Google Analytics 4 mistakes
- Google Analytics Help, What's new in Google Analytics
- Google Analytics Help, Announcements (Analytics Advisor), December 2025
- Google, Try out Ads Advisor and Analytics Advisor, November 2025
- Google Business, Ask Advisor in Google Analytics, May 2026
- Google, Google Analytics MCP Server (GitHub)
- Adobe, General availability of AI agents, September 2025
- Amplitude, AI Agents usher in new era, June 2025
- Amplitude, Agentic AI Analytics, February 2026
- Mixpanel, Introducing Mixpanel AI, May 2026
- Piano, Piano Analytics MCP, June 2026
- Chen et al. (LinkedIn), Text-to-SQL for Enterprise Data Analytics, 2025
- Spider 2.0 benchmark
- Henkan & Partners, The Essential Guide to A/B Testing
- Henkan & Partners, The Essential Guide to Tag Management
- Henkan & Partners, User Consent in E-commerce: Everything to Know Before 2027
- Henkan & Partners, Server-Side Google Tag Manager for E-commerce
- Henkan & Partners, Session Replay in 2026
- Henkan & Partners, The Essential Guide to Voice of Customer
- Henkan & Partners, The Digital Analytics Market, 1995–2026