Focus
A/B Testing Statistics for Marketers: The Models, When to Use Each, and How AI Can Help
Alexandre Suon · 2026-09-27
You do not need to be a statistician to run good A/B tests, but you do need to understand what the numbers in your testing tool mean. This Focus is an introduction to A/B testing statistics for marketers: the few ideas that matter, the main statistical models in plain English, which one to use in each situation, which tools use which, and how AI can help without leading you astray.
Executive summary
- Statistics separates real effects from noise. Two identical pages never convert at exactly the same rate, especially in the first days of a test. Five ideas let you read almost any result: statistical significance, the confidence interval, statistical power, the minimum detectable effect and the sample size they imply.
- There are four families of models, and they answer different questions. Fixed-horizon frequentist tests ask whether the difference could be chance, with one reading at the end. Sequential tests allow you to check as you go. Bayesian tests give the probability that a version is better. Bandits shift traffic to the leader to earn more during the test.
- Choose the model from your situation, not from fashion. If you plan the sample and read once, use a fixed-horizon test. If your team checks the dashboard daily, use a sequential test. If leaders want "the chance B is better", use a Bayesian test with a stopping rule. For a one-week promotion, use a bandit. For revenue, add capped outliers and variance reduction to any model.
- The biggest risks come from how people read results, not from the maths. Checking a standard test 10 times and stopping at the first good reading turns a 5% false positive rate into about 19%. Looking at 10 metrics gives a 40% chance of at least one false positive. When only 10% of ideas work, about 22% of significant results are false positives.
- Testing tools default to different models. Optimizely, Amplitude, Mixpanel and Datadog Experiments default to sequential testing; VWO and AB Tasty (now combined as Wingify), Dynamic Yield and GrowthBook to Bayesian; Adobe Target, Kameleoon, Statsig and LaunchDarkly to fixed-horizon tests. Check which one yours uses before you read a result.
- AI can plan, check and explain tests, but it still makes statistical mistakes. Most major tools now summarise results with AI. Yet on a 2024 benchmark that asks whether a method's assumptions fit the data, the best model tested scored 64.8%, and published tests show AI is more accurate when it writes and runs code than when it reasons in text. Use AI to calculate in code, to run checks and to draft summaries, and keep a person responsible for the decision.
Section 1 · Why statistics matters
Two identical pages never show identical results, so every test needs statistics to tell signal from noise
A/B testing statistics is the set of methods used to decide whether the difference between two versions of a page, email or feature is real or just chance, and how large that difference is likely to be.
Imagine you show exactly the same page to two groups of visitors. Their conversion rates will still differ, because different people land in each group and buy for their own reasons. In the first days of a test, that random difference can be large. Statistics is how you tell a real improvement from this background noise.
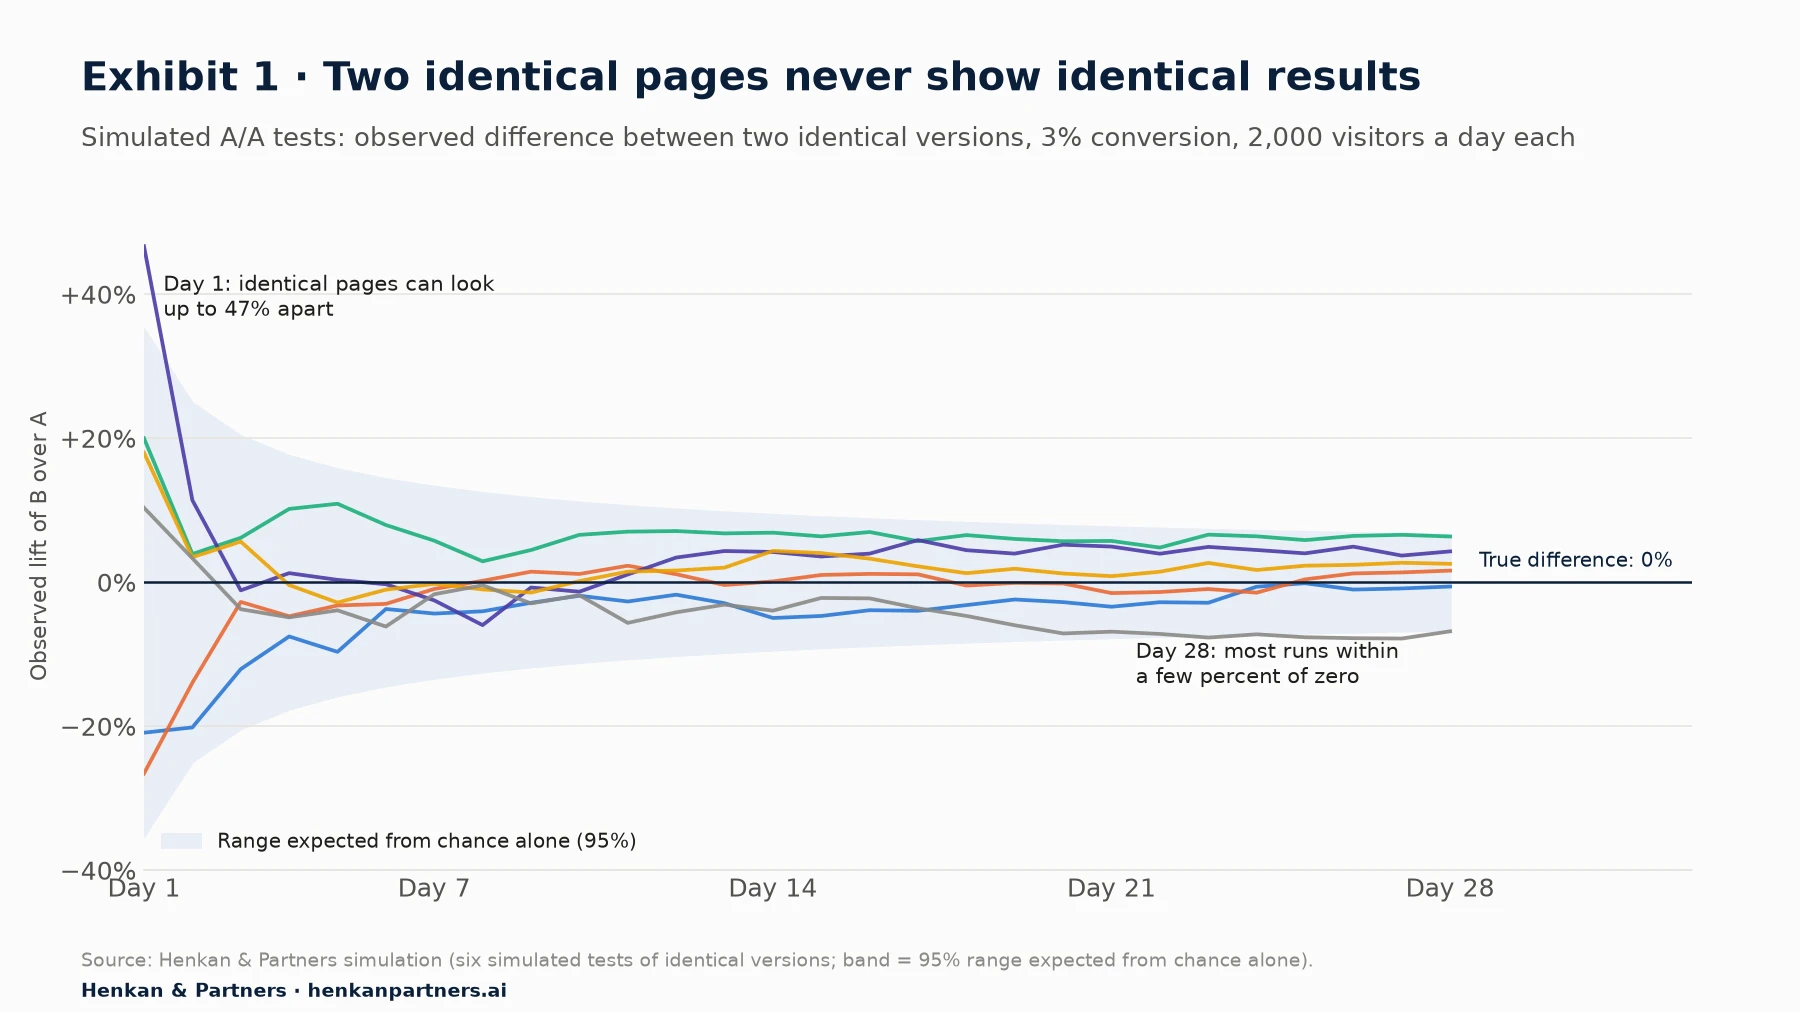
What this shows. On the first day, identical pages looked up to 47% apart. After four weeks, most of the runs had settled within a few percent of zero, but two still sat at or just beyond the edge of the band: noise never disappears completely. A test that is stopped early because "B is up 20%" may be reporting nothing but chance. Every statistical model in this article is a way of deciding when a difference is too large, or has lasted too long, to be noise.
For the basics of running a test, from hypothesis to rollout, see our essential guide to A/B testing. For how tests are delivered to visitors, see our Focus on JavaScript injection, client-side and server-side testing.
For leaders. A reported win is only as reliable as the method behind it. Before acting on a result, ask three questions: which model did the tool use, what threshold did it apply, and did anyone stop the test early because the numbers looked good?
Section 2 · Five ideas to know
Five ideas are enough to read almost any test result
1. Significance and the p-value: could this be chance?
A frequentist test starts by assuming your change had no effect. The p-value is the probability of seeing a difference at least as large as yours if that assumption were true. If it is below the threshold you chose in advance, usually 5%, the result is called statistically significant. A common mistake is to read a p-value of 0.05 as "a 5% chance the win is fake". Ronny Kohavi and colleagues call this "a very common misunderstanding": the true chance depends on how often your ideas work, as Section 5 shows.
2. The confidence interval: how big could the effect be?
A result of "+4%, significant" hides a lot. The confidence interval gives the range of effects consistent with the data, for example +0.5% to +7.5%. A wide interval means you know little about the size of the effect, even if you are fairly sure it is positive. Always report the interval, not just the headline number.
3. Power and the minimum detectable effect: could this test find a real win?
Power is the chance that your test detects a real effect of a given size; 80% is the usual target. The minimum detectable effect (MDE) is the smallest lift you want to be able to detect. These two choices, with your baseline conversion rate, set the sample size. A test with too little traffic will often end "not significant" even when the change works.
4. Sample size: how many visitors you need
A widely used rule of thumb, given by Kohavi and colleagues, estimates the visitors needed per variant for 95% confidence and 80% power.
Visitors per variant ≈ 16 × p × (1 − p) ÷ δ², where p is your baseline conversion rate and δ is the smallest absolute change you want to detect
For a 3% conversion rate, detecting a 5% relative lift (from 3.00% to 3.15%) needs about 16 × 0.03 × 0.97 ÷ 0.0015², or roughly 207,000 visitors per variant. Detecting a 20% lift needs about 13,000.
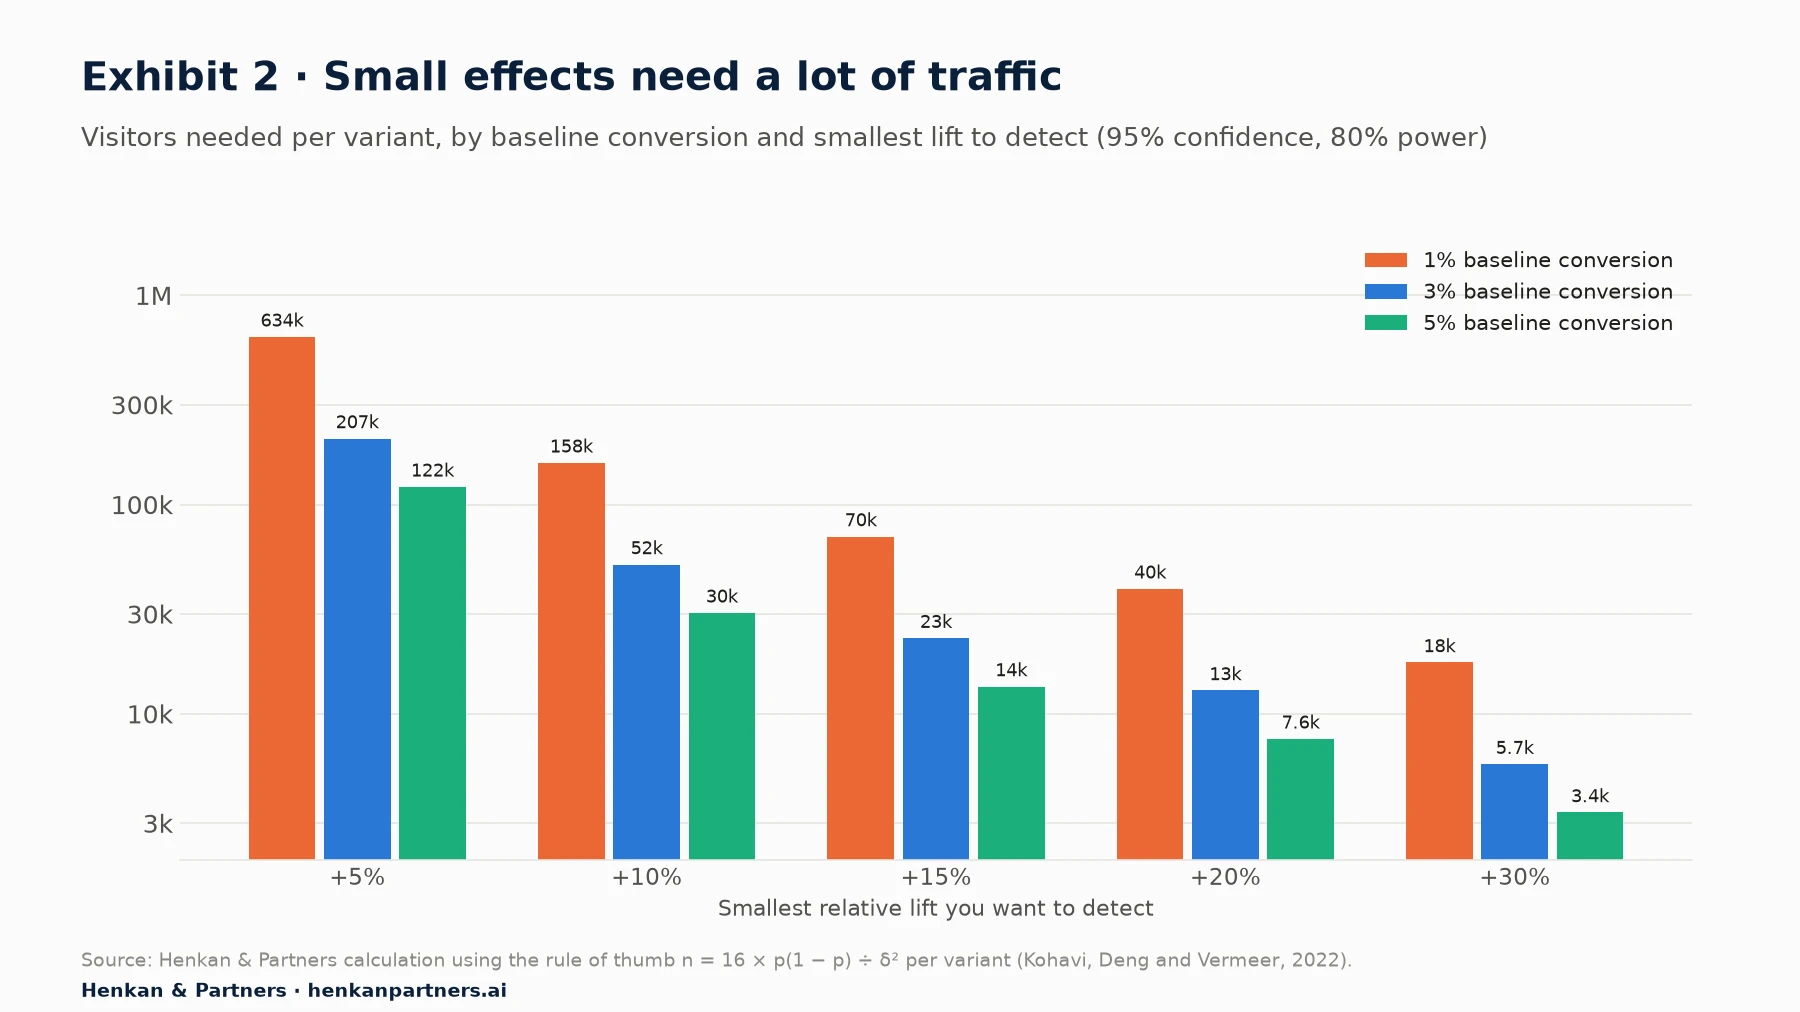
What this shows. Halving the lift you want to detect multiplies the traffic you need by four, and low conversion rates make everything harder. This single chart explains why small sites should test bold changes, and why "we'll just test the button colour" often never reaches a conclusion.
5. Test duration: run full weeks
Shoppers behave differently on Mondays and Saturdays, and at the start and end of the month. Run tests for whole weeks, and at least until the planned sample is reached. Kohavi and colleagues recommend running experiments for two weeks to spot novelty effects, where a new design gets extra attention at first and then fades.
For marketers. Before launch, write down four things: the one primary metric, the smallest lift worth detecting, the sample size that gives, and the end date. Most testing tools include a calculator. Until the test reaches its planned sample, "not significant yet" is the only honest reading.
Section 3 · The models explained
Four families of models answer four different questions
Testing tools use four families of statistical models. They are not rival schools where one is right and the others wrong: each answers a different question and suits a different way of working.
| Model | The question it answers | What your tool shows | Best for | Watch out for |
|---|---|---|---|---|
| Fixed-horizon (frequentist) | Could this difference be chance? | p-value or "significance", confidence interval | Planned tests read once at the end | Checking early and stopping when it looks good |
| Sequential (frequentist) | Could this be chance, even though I keep checking? | Significance that stays valid as you monitor | Teams that watch dashboards daily | Less power for the same traffic; early estimates can be inflated |
| Bayesian | How likely is B to be better, and by how much? | Chance to beat control, expected loss, credible interval | Explaining results to non-specialists | Still needs a stopping rule; the probability is not a guarantee |
| Multi-armed bandit | Which version should get more traffic right now? | Traffic shifting towards the leader | Short campaigns and many variants | Produces weaker evidence; not for permanent decisions |
Fixed-horizon tests: the classic approach
You set the sample size in advance, run the test to the end and read the result once. For a conversion rate, the usual test is a two-proportion z-test, or the equivalent chi-square test. For an average, such as revenue per visitor, it is usually Welch's t-test, which Adobe Target uses because traffic allocation between experiences can be unequal. These tests are simple and well understood, and they work very well if you respect their one rule: do not act on the result before the planned end.
Some metrics need care. Average order value and revenue per session are ratios, and analysing them as if every session were independent understates the noise and produces too many false wins; your analyst or tool should use the "delta method" or resample by visitor instead. Rank-based tests, such as the Mann-Whitney test, tell you whether one group tends to have larger values, not whether average revenue moved.
Sequential tests: check as often as you like
Most teams look at results every day. Sequential tests are designed for that. Group sequential tests, borrowed from clinical trials, let you look a few planned times with stricter thresholds: with five looks and Pocock's boundaries, each p-value must be below 0.0158 instead of 0.05. "Always-valid" methods, such as the mixture sequential probability ratio test (mSPRT) and confidence sequences, let you look at any time. The trade-off is power: in Spotify's 2023 comparison, a well-planned group sequential test reached 90% power where always-valid methods reached about 72% to 75%.
Bayesian tests: probabilities people understand
A Bayesian test combines a prior belief with the data and reports results such as "B has a 96% chance to beat A" and the expected loss if you pick B and it is actually worse. Many teams find this easier to explain; GrowthBook says it defaults to Bayesian statistics "because they provide a more intuitive framework for decision making for most customers." But Bayesian tests are not immune to peeking. In David Robinson's 2015 simulation, checking repeatedly and stopping on an expected-loss rule raised the rate of accepting a harmful change from 2.5% to 11.8%. A stopping rule set in advance is still needed, which is why VWO added a sequential correction to its Bayesian engine in 2024.
Multi-armed bandits: earn while you test
A bandit moves traffic towards whichever version is winning. Thompson sampling, the most common method, sends each visitor to a version with a probability equal to its chance of being the best. Steven Scott of Google showed that bandits lose far fewer conversions while searching for the best option. The cost is evidence: Optimizely states that its bandit optimisations "do not generate statistical significance". Use bandits for short-lived decisions, such as a one-week promotion or choosing between many headlines, not for permanent changes to your site.
Two add-ons that work with any model
Variance reduction removes predictable noise. CUPED, published by Microsoft researchers in 2013, uses each visitor's behaviour before the test; at Bing, the authors report that they could "reduce variance by about 50%, effectively achieving the same statistical power with only half of the users, or half the duration". It helps most with returning or logged-in customers, since first-time visitors have no history to use.
Capping outliers matters for revenue, where a few very large orders can swing the result. In one Microsoft example, capping revenue at $10 per user per week cut the minimum sample needed for the standard test to be reliable from 114,000 to 9,700 users. Set the cap before the test starts, never after seeing the results.
For marketers. You rarely choose the formula yourself; the tool does. What you choose is how you work: whether you read once or check daily, whether you need probabilities for stakeholders, and whether the goal is to learn or to earn during a campaign. Those choices decide which model fits.
Section 4 · Which model to choose
Choose the model from your situation, and add variance reduction and corrections where they apply
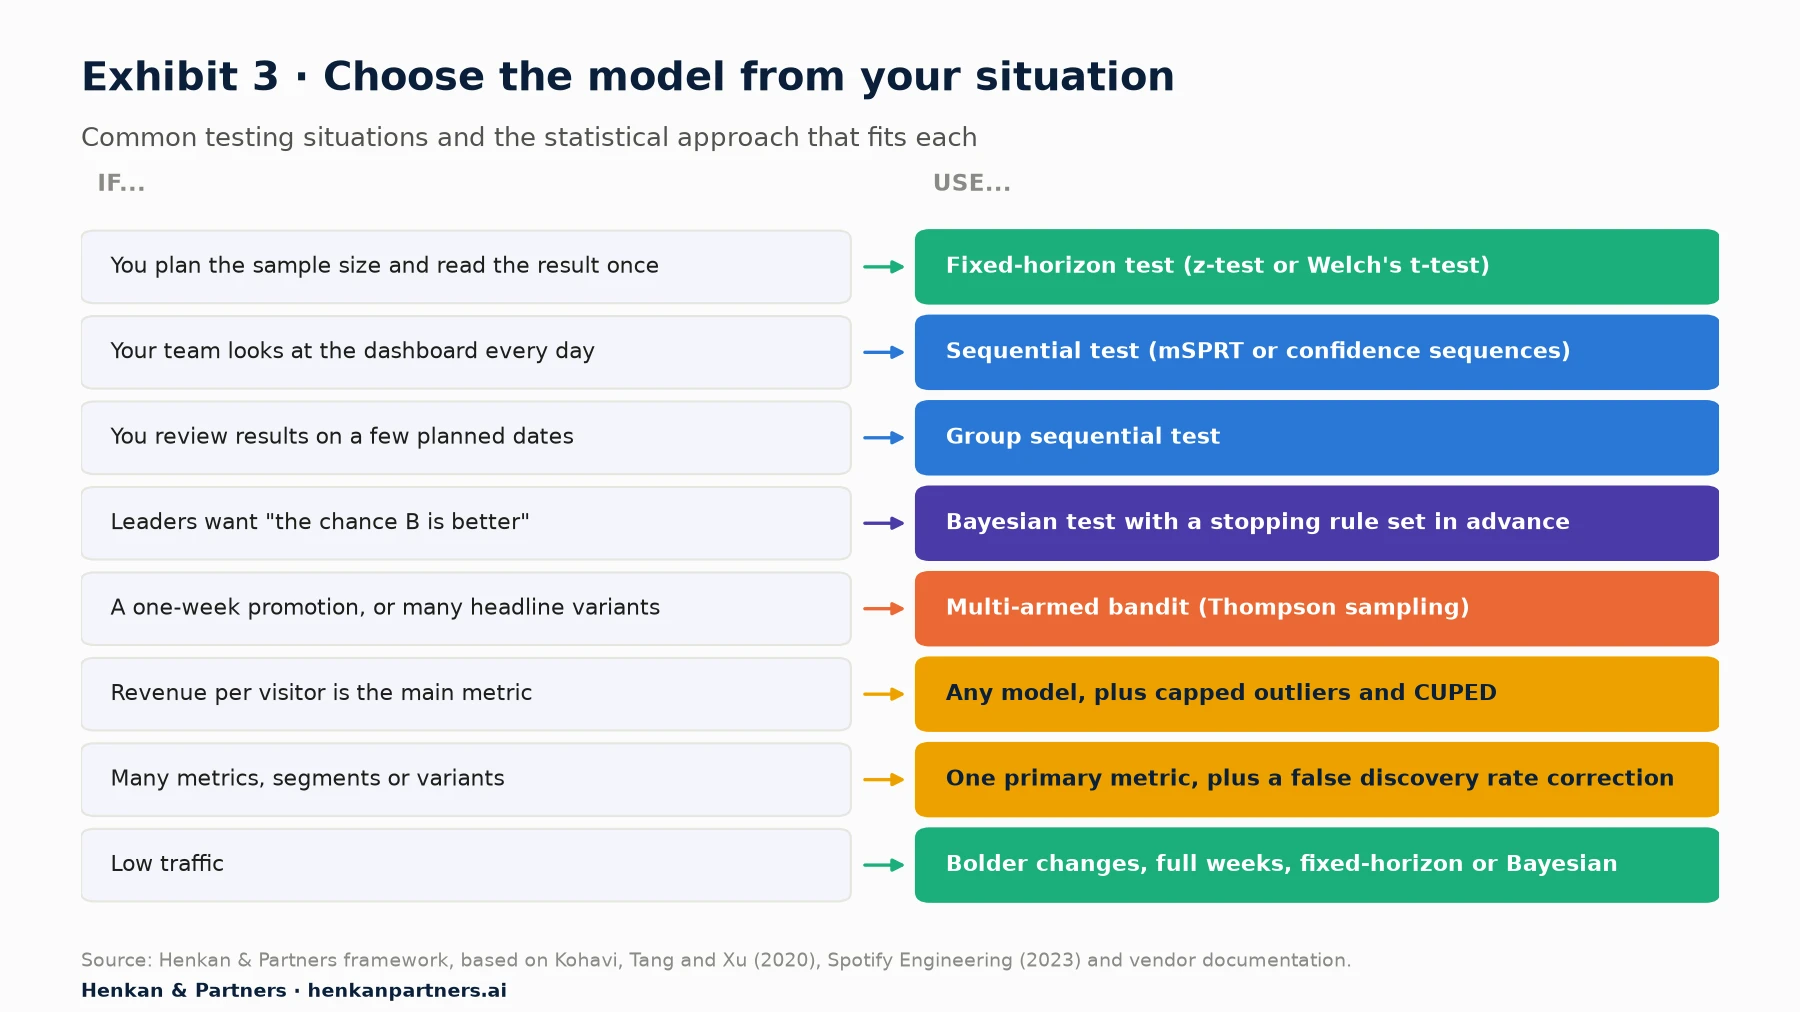
What this shows. Most situations point clearly to one approach. The most common mismatch we see is a fixed-horizon test read every morning, which quietly multiplies false wins. The fix is either to switch the tool to a sequential method or to agree, in writing, not to act before the planned end.
| Situation | Recommended approach | Why |
|---|---|---|
| First tests on a small site | Fixed-horizon test on one bold change, run for full weeks | Simple to plan and explain; bold changes are detectable with less traffic |
| Daily stand-up reviews the testing dashboard | Sequential test, available in most major tools | Keeps the false positive rate valid however often you look |
| Weekly steering committee decides | Group sequential test with one look per meeting | Most power for a small number of planned looks |
| Executives want a probability to act on | Bayesian test, reporting chance to beat control and expected loss | Matches how people talk about risk, if a stopping rule is agreed in advance |
| Black Friday banner, five headlines, one week | Multi-armed bandit | Earns more during a campaign too short to learn from |
| Pricing, shipping or loyalty test judged on revenue | Any model, with outliers capped and CUPED switched on | Revenue is noisy; these two steps can cut the traffic needed sharply |
| Report shows 15 metrics and 10 segments | One primary metric decides; false discovery rate correction for the rest | Otherwise a false positive is close to guaranteed |
Section 5 · Common traps
Most false wins come from how results are read, not from the formula
Peeking: stopping when the numbers look good
The problem has been known since 1969, when Armitage, McPherson and Rowe showed that repeating significance tests as data arrives raises the chance of a false result above the planned level. Evan Miller brought it to online testing in 2010: in a small test checked after every visitor, up to 150, and stopped at the first significant reading, the false positive rate was 26.1%, "more than five times what you probably thought."
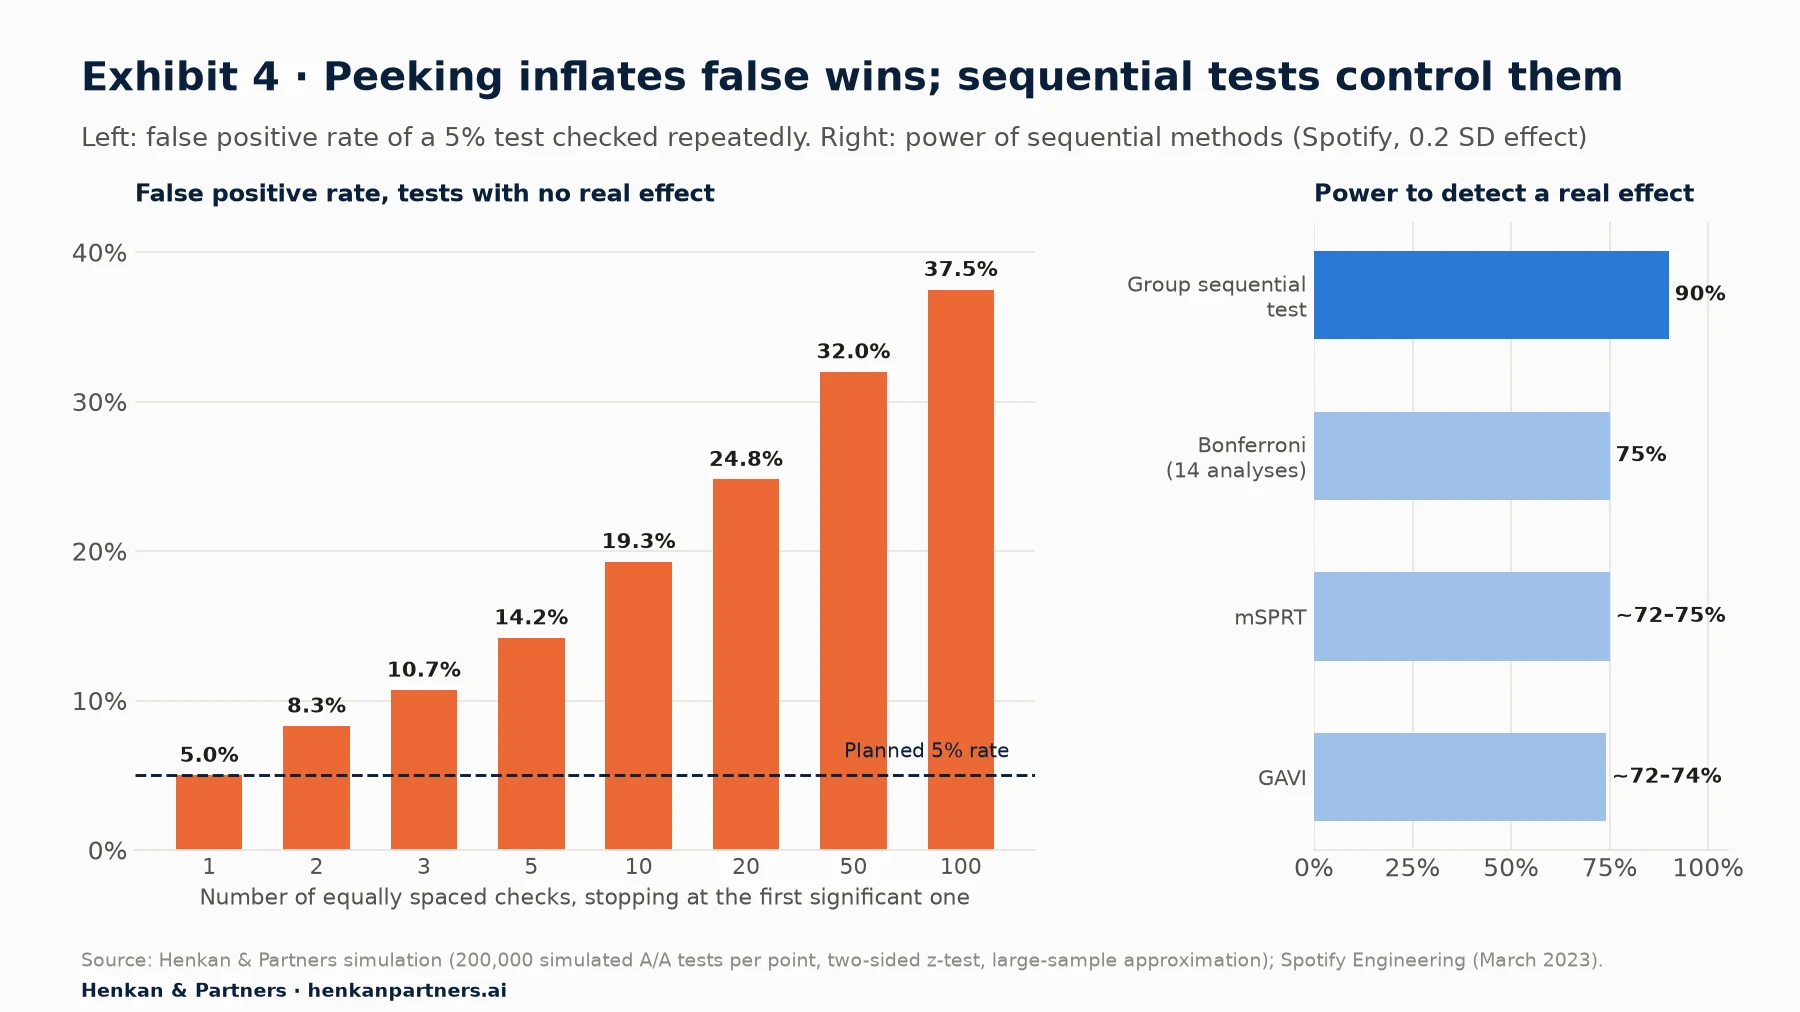
What this shows. Each extra look is another chance for noise to cross the line. With 10 checks, about one test in five with no real effect shows a significant difference at some point. Sequential methods keep the error rate at 5% however often you look, at the cost of some power.
Too many metrics and segments
Each comparison carries its own 5% risk. With 10 independent metrics and no real effect, the chance of at least one "significant" result is 1 − 0.95¹⁰, or about 40%; with 20 segments it is about 64%. The protection is simple: choose one primary metric that decides the test, a few guardrail metrics that can stop a harmful launch, and treat segments as ideas for the next test. Tools that correct automatically help: Optimizely applies a false discovery rate correction across metrics, but notes that "when you segment results, the false discovery rate control is not maintained."
Low win rates mean more false wins
How often your ideas work changes how much a win is worth. Kohavi, Deng and Vermeer (2022) calculated that when 33% of ideas succeed, as Microsoft reported in 2009, 5.9% of significant results are false positives. When 10% succeed, as reported for Booking.com, Google Ads and Netflix, the figure is 22%; at 8% (Airbnb Search) it is 26.4%. The same formula gives about 37% at a 5% success rate. Re-test surprising or high-impact wins before rolling them out.
A broken traffic split
If a test planned a 50/50 split and one group received noticeably more visitors, something went wrong: bots, a redirect that loses visitors, or tracking that fires differently in each version. Microsoft researchers found this sample ratio mismatch in about 6% of experiments and wrote that it "in most cases completely invalidates experiment results." Most modern tools check it automatically; if yours does not, check it yourself before reading anything else.
Results that look too good
Twyman's law states that "any figure that looks interesting or different is usually wrong". A 40% lift from a button change is far more likely to be a tracking bug or noise than a breakthrough. Look for the bug first.
For leaders. For every declared win, ask: was the test stopped at the planned time, was the traffic split as planned, and how many metrics and segments were examined? Three questions remove most false wins before they reach the roadmap.
Section 6 · Which tool uses which
Testing tools differ mainly in their default model, so check yours before reading a result
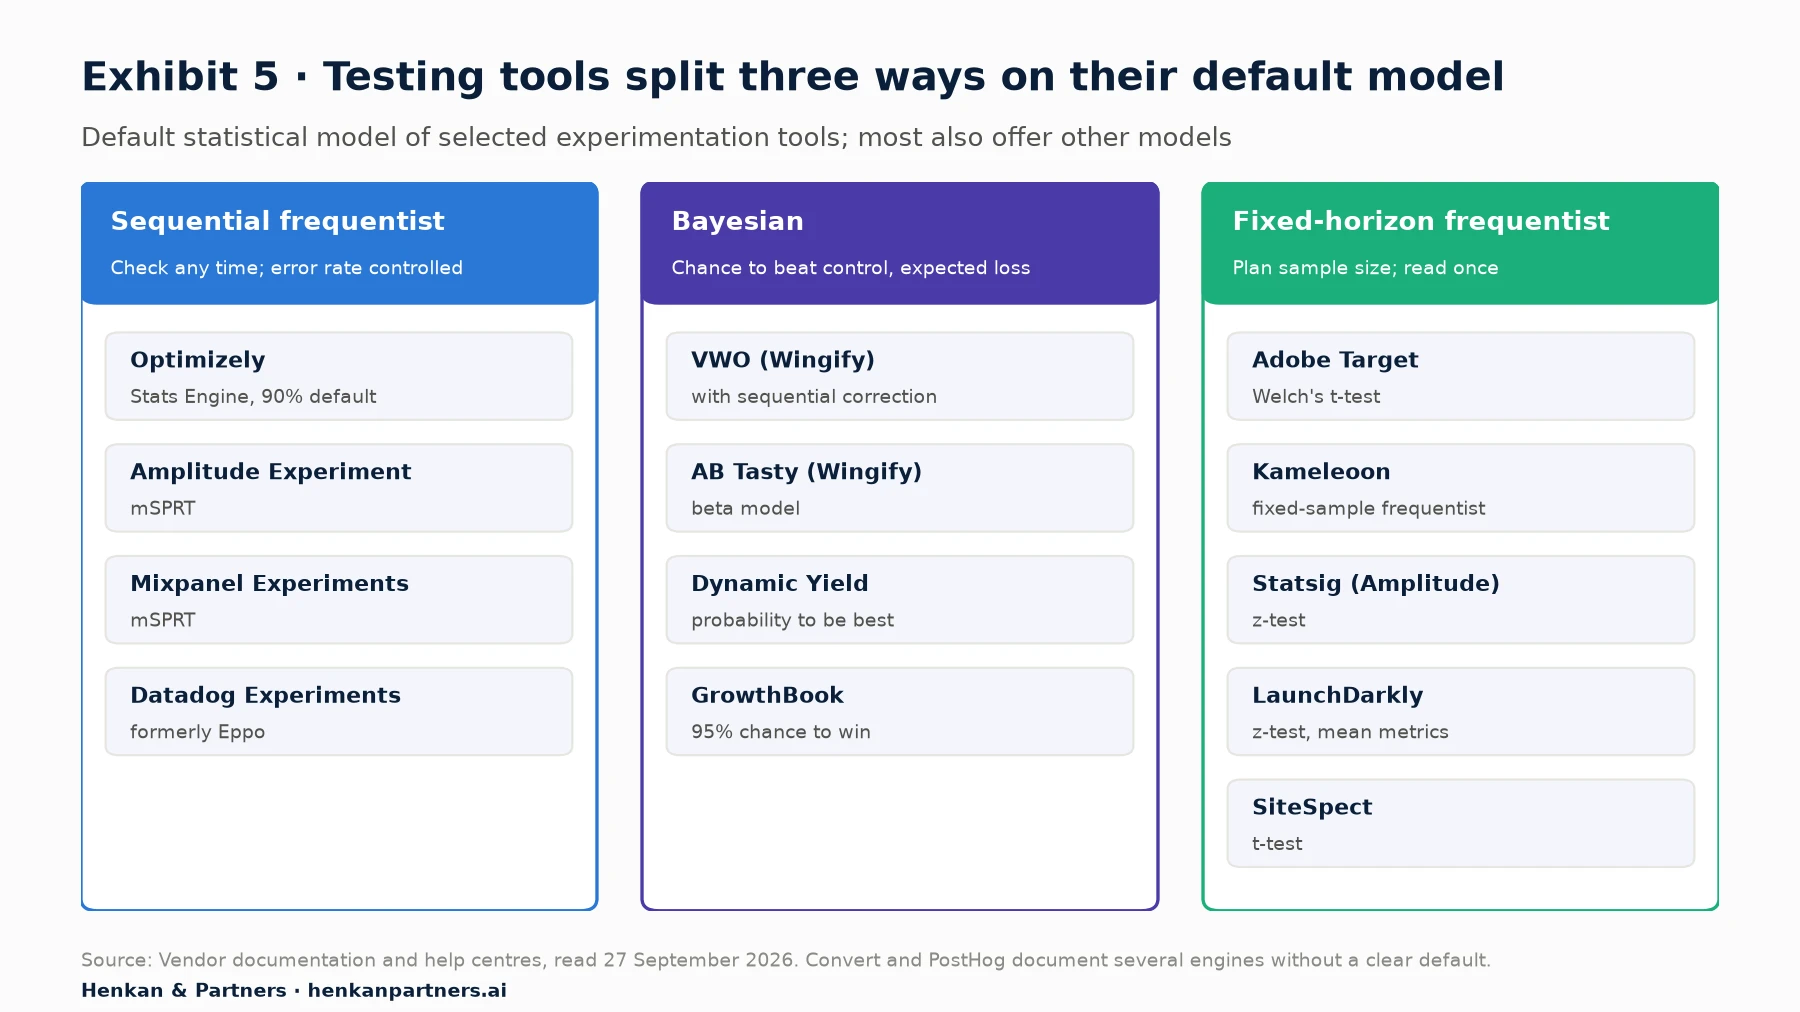
What this shows. A "winner" means different things in different tools. Optimizely declares winners at 90% significance by default, while most others use 95%. Bayesian tools report a probability to be best; frequentist tools report significance and a confidence interval. Most platforms now offer more than one model, so the same data can produce different labels depending on settings.
| Tool (2026 name) | Default model | Other models offered | Variance reduction | Correction for many comparisons |
|---|---|---|---|---|
| Optimizely | Sequential (Stats Engine) | Fixed-horizon frequentist and Bayesian, both in beta | CUPED in warehouse-native analytics, numeric metrics, off by default | Tiered Benjamini-Hochberg |
| VWO (Wingify) | Bayesian with sequential correction | None found in documentation | Not documented | Bonferroni |
| AB Tasty (Wingify) | Bayesian; Mann-Whitney U for cart value | Frequentist, on request | Mentioned on blog only | Bonferroni |
| Kameleoon | Frequentist (fixed sample) | Bayesian, sequential | CUPED | Offered |
| Convert | Not stated | Frequentist t-test, Bayesian, sequential | Not documented | Bonferroni or Šidák |
| Adobe Target | Frequentist (Welch's t-test) | Auto-Allocate bandit | Not documented | Not documented |
| Dynamic Yield | Bayesian | Dynamic allocation bandit | Not documented | Not documented |
| Amplitude Experiment | Sequential (mSPRT) | t-test, Bayesian, Thompson sampling | CUPED, optional | Bonferroni |
| Statsig (Amplitude) | Frequentist (z-test) | Sequential, Bayesian, switchback, bandits | CUPED; winsorisation at 99.9th percentile (Statsig Cloud) | Bonferroni, Benjamini-Hochberg |
| GrowthBook | Bayesian | Frequentist, sequential | CUPED and post-stratification | Holm-Bonferroni, Benjamini-Hochberg (frequentist only) |
| Datadog Experiments (ex-Eppo) | Sequential frequentist | Fixed-sample frequentist, Bayesian | CUPED (Eppo's CUPED++) | Offered |
| LaunchDarkly | Frequentist (z-test) for mean metrics | Bayesian, sequential | CUPED | Bonferroni, Benjamini-Hochberg |
The market is also moving. VWO and AB Tasty announced their combination in January 2026 and launched a single Wingify brand and platform in September 2026, so their two statistics engines may converge. Datadog bought Eppo in May 2025 and now sells it as Datadog Experiments. In May 2026, Amplitude announced it would take on Statsig's brand and customers from OpenAI and keep running the Statsig platform. Our A/B testing tool market report covers these changes in detail.
For marketers. Open your tool's statistics settings and note five things: the model, the threshold, whether sequential testing is on, whether a correction for multiple comparisons is on, and whether variance reduction is on. Put them at the top of every test report.
Section 7 · How AI can help
AI can plan, check and explain your tests, but keep the calculations in code and the decision with a person
AI now appears at every stage of testing, from writing hypotheses to summarising results. For statistics, it can save marketers a lot of time and remove the fear of the maths. It can also produce confident, wrong answers. The evidence so far points to a simple rule: let AI do the work, but make it calculate in code, and keep a person accountable for the decision.
What AI does well
| Task | How AI helps | What to check |
|---|---|---|
| Plan the test | Suggests the right test for your metric, drafts the test plan and calculates sample size and duration | Ask it to write and run the calculation as code, and compare with your tool's calculator |
| Check data quality | Runs the sample ratio check, flags missing tracking or odd traffic patterns | That the check uses visitor counts from the right dates and variants |
| Explain results | Turns significance, intervals and probabilities into plain-English summaries for stakeholders | That the summary matches the numbers and mentions the uncertainty |
| Analyse raw data | Writes SQL or Python for revenue, ratio or segment analyses in your data warehouse | That the code analyses by visitor, caps outliers and uses the planned metric |
| Learn from past tests | Searches and summarises your test archive to find patterns and next ideas | That patterns are treated as hypotheses, not conclusions |
Studies support this division of labour. When six AI assistants (ChatGPT, Claude, DeepSeek, Gemini, Grok and Le Chat) were asked to pick a statistical test for 20 hypothesis scenarios, all six chose correctly every time (Cureus, 2025). Textbook cases are easy; judging whether a method's assumptions hold for real data, as the StatQA benchmark tests, is much harder. On sample size, a 2025 study found ChatGPT's estimates were off by about 3% to 5% on average across 24 standard scenarios, with some individual errors much larger. A 2026 study of power analysis found that GPT-4 and GPT-4o "performed well when generating R code for sample size estimation" but "struggled with direct numerical calculation".
AI inside your testing tool
Most major platforms now include AI features for reading results; the descriptions below are from their own documentation. Statsig added AI experiment summaries in December 2025 that can "make a ship recommendation". Kameleoon's assistant, Kai, reads conversion rates, significance, confidence intervals and sample ratio checks. AB Tasty's Reporting Copilot examines "the confidence interval and chance to win" for conversion rate and average order value; its Evi Analysis assistant is in beta and "does not work in Frequentist mode". PostHog, Adobe's separately licensed Experimentation Agent and Amplitude's Web Experimentation Agent (February 2026) also analyse results, and Optimizely's Opal agents add summaries and programme reports. VWO and AB Tasty relaunched together as Wingify in September 2026 with an "Agentic Experience Optimization Platform".
A second route is the Model Context Protocol (MCP), an open standard that lets general assistants such as Claude or ChatGPT query your testing tool directly. GrowthBook launched an MCP server in May 2025 and its current version answers questions about experiment results, Optimizely launched one in April 2026 with a tool to summarise test results, and Statsig and Amplitude offer them too. This lets you ask "Should we ship the checkout test?" in your usual assistant, using live numbers rather than a pasted screenshot. Adoption is still early: in Optimizely's own report on companies using its AI agents, 6.80% of experiments were summarised with the AI (vendor data from 2025, published 2026).
Where AI goes wrong
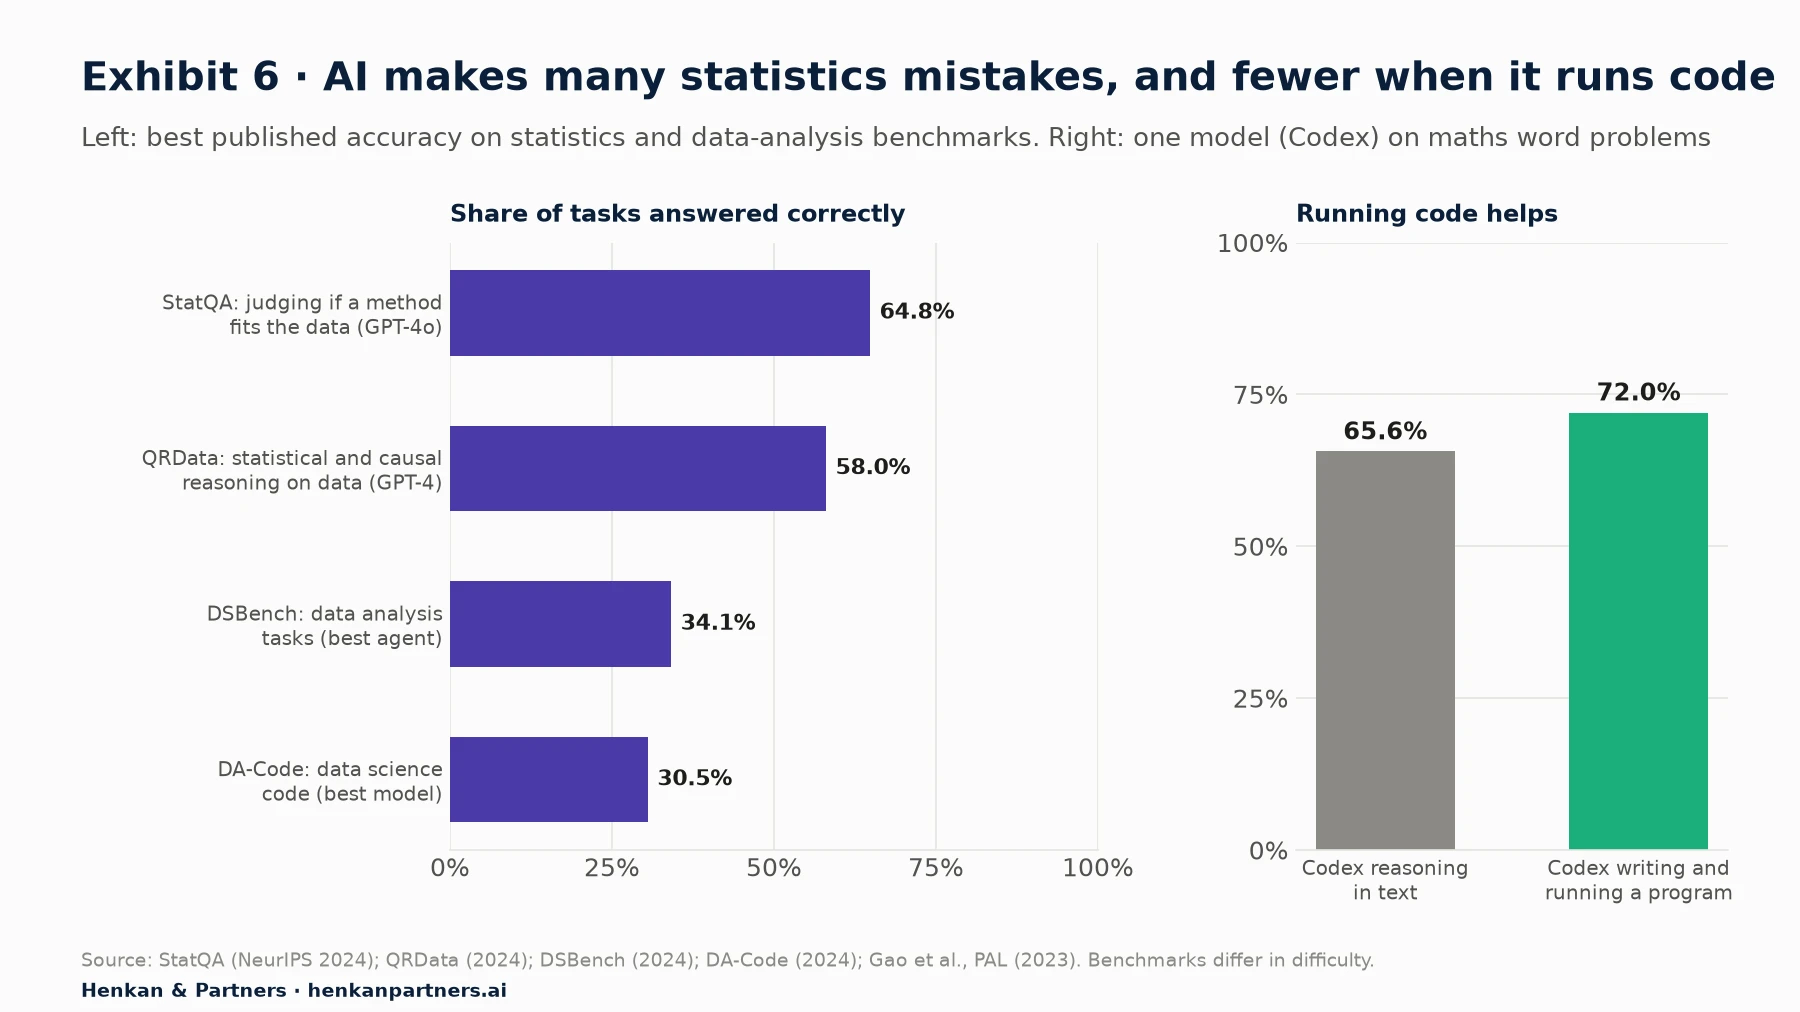
What this shows. Even strong models get a large share of statistics and data-analysis tasks wrong, and they do better when they calculate in code rather than in their heads. Newer models are likely to score higher than those tested here, but the pattern is consistent: treat AI output as a draft to check, not a verdict.
Three risks matter most for marketers. First, explanations can be wrong even when the answer is right: a 2026 study of six AI configurations found that when they correctly rejected common misreadings of p-values and confidence intervals, their explanations "often introduced additional fallacies". Second, AI can be talked into p-hacking: in a 2026 working paper, Claude Code and Codex refused direct requests to push results towards significance, but a reframed request got round those guardrails. Third, AI multiplies the forking paths: in a 2026 study, AI agents given different personas reached "divergent, often opposing, conclusions from the same data and question". Automatic segment scanning, now common in testing tools, raises the same multiple-comparisons risk as Section 5 describes.
Data privacy is a fourth concern. Do not paste customer-level data into a public chatbot. Kameleoon, for example, says its assistant sends "aggregated data with no personal identifiers"; check what your own tool and assistant do with the data you share.
Five rules for using AI with test statistics
- Make it calculate in code. Ask the assistant to write and run the sample size, significance or sample ratio calculation, and show the code.
- Fix the plan before the data arrives. Let AI draft the test plan, primary metric and stopping rule, then do not change them after seeing results.
- Give it the numbers, not your hopes. Ask "what do these results show, including the uncertainty?", not "is this a winner?"
- Treat AI-found segments as new hypotheses. A segment that "wins" in an automated scan needs its own test.
- Share aggregates only, and keep a person accountable. AI can recommend; a named owner decides and signs off the result.
For marketers. A useful prompt: "Here are the visitors and conversions for A and B, and our plan (primary metric, 95% confidence, fixed-horizon, planned sample of 60,000 per variant). Write and run Python to check the sample ratio, compute the lift, the 95% confidence interval and the p-value, and explain the result in three sentences for a non-specialist, including what we still do not know." For how AI is changing test building, see our research on prompt-based experimentation.
Section 8 · By team size
The right set-up depends on how many tests you run and who reads the results
| Team | Recommended set-up | Why |
|---|---|---|
| One or two people (small shop or first programme) | Tool default model; sample size planned with a calculator; one primary metric; no decisions before the planned end unless the tool is sequential; AI for plans and plain-English summaries | Simple rules prevent the most common errors; AI makes the statistics less intimidating |
| Growing CRO, product or data team | Sequential testing; CUPED; false discovery rate control across metrics; guardrail metrics; AI to check sample ratios and draft reports; a test log with the win rate | More tests and more people looking raise the risk of peeking and fishing |
| Multi-brand or international retailer | Documented statistics policy; warehouse-native analysis; review by a statistician; AI connected to the testing tool through MCP, with rules on data sharing and sign-off | Scale and costly decisions need consistent, auditable methods |
For leaders. Ask for a one-page statistics policy: the default model, thresholds, stopping rules, primary-metric rule, correction method, sample ratio threshold, and how AI may and may not be used. It takes a day to write and removes most arguments about whether a result is real.
Section 9 · What to do next
Five moves to make your test results more trustworthy
1. Learn the five ideas
Make sure everyone who reads results understands significance, the confidence interval, power, the minimum detectable effect and sample size. An hour's training saves months of false wins.
2. Check your tool's settings
Note the model, threshold, sequential setting, correction and variance reduction, and put them at the top of every report.
3. Match the model to how you work
If people check results daily, switch on sequential testing. If you need probabilities for stakeholders, use a Bayesian test with a stopping rule. Use bandits only for short campaigns.
4. Fix revenue metrics
Cap outliers at a level set in advance, switch on CUPED where available, and make sure average order value is analysed by visitor.
5. Put AI to work, with guardrails
Use AI to plan tests, run checks in code and draft summaries. Keep the plan fixed, the data aggregated and a named person responsible for each decision.
Our view. Statistics is not the goal. The goal is a better experience for customers that grows revenue and lifetime value. The right model is the one that lets your team make that call quickly without fooling itself, and AI is most useful when it makes that discipline easier, not when it replaces it.
FAQ
Frequently asked questions about A/B testing statistics
Frequently asked questions
What statistics do I need to know for A/B testing?
Five ideas cover most needs: statistical significance and the p-value, the confidence interval, statistical power, the minimum detectable effect and sample size. Together they tell you whether a difference could be chance, how big it might be, and how many visitors you need before you can trust the answer.
Is Bayesian or frequentist better for A/B testing?
Neither is better in general. Bayesian results, such as a chance to beat control, are easier to explain; frequentist tests give well-understood error rates. Both give reliable answers with a stopping rule set in advance, and both mislead when tests are stopped at the first good-looking result.
Can I stop an A/B test early when it reaches significance?
Not with a standard fixed-horizon test. In our simulation, checking a test 10 times and stopping at the first significant reading raised the false positive rate from 5% to about 19%. Stop early only if your tool uses a sequential method, or to end a clearly harmful test.
How many visitors do I need for an A/B test?
It depends on your conversion rate and the smallest lift you want to detect. As a rule of thumb, visitors per variant ≈ 16 × p × (1 − p) ÷ δ². At a 3% conversion rate, detecting a 5% relative lift needs about 207,000 visitors per variant; detecting a 20% lift needs about 13,000.
What is CUPED in A/B testing?
CUPED (Controlled-experiment Using Pre-Experiment Data) is a variance reduction method published by Microsoft researchers in 2013. It uses each visitor's behaviour before the test to remove predictable noise. At Bing it cut variance by about 50%, equal to running the test with half the visitors.
Can ChatGPT or Claude analyse my A/B test results?
Yes, as an assistant, not as the final judge. AI is good at choosing the right test, writing analysis code and explaining results in plain English, but it still makes statistical mistakes and is more reliable when it runs code. Share aggregated numbers only, ask it to show its calculation, and keep a person responsible for the decision.
Which A/B testing tools use Bayesian statistics?
By default, VWO and AB Tasty (now combined as Wingify), Dynamic Yield and GrowthBook use Bayesian models. Optimizely, Amplitude, Mixpanel and Datadog Experiments default to sequential frequentist testing, while Adobe Target, Kameleoon, Statsig and LaunchDarkly default to fixed-horizon frequentist tests. Most offer other models as options.
Key terms
- Statistical significance
- A result is significant when a difference as large as the one observed would be unlikely if the change had no effect. The usual threshold is 5%.
- p-value
- The probability of seeing a difference at least this large if the change had no effect. It is not the probability that your result is a fluke.
- Confidence interval
- The range of effects consistent with the data, for example +1% to +6%. It tells you how big the effect might be, not just whether there is one.
- Statistical power
- The chance that a test detects a real effect of a given size, usually set at 80%. Underpowered tests miss real wins.
- Minimum detectable effect (MDE)
- The smallest lift a test is designed to detect. Halving it roughly quadruples the traffic you need.
- Fixed-horizon test
- A test with a sample size set in advance and a single reading at the end. It is the classic approach behind most textbook formulas.
- Sequential test
- A test designed to be checked several times, or continuously, while keeping the false positive rate at the planned level.
- Bayesian test
- A test that combines prior belief with the data to give probabilities, such as the chance that B beats A.
- Chance to beat control
- The Bayesian probability that a variant is better than the control. Easy to explain, but it says nothing about how much better.
- Expected loss
- The loss you should expect from choosing a variant, averaging the possible shortfalls by their probability. Some Bayesian tools stop a test once it is small enough.
- Multi-armed bandit
- A method that moves traffic towards the best-performing variant during the test. It earns more while running but gives weaker evidence.
- CUPED
- A variance reduction method that uses visitors' behaviour before the test to remove noise, so tests need fewer visitors.
- Sample ratio mismatch (SRM)
- A gap between the planned traffic split, such as 50/50, and the split actually observed. It usually means a bug that invalidates the result.
- False positive
- Declaring a winner when the change had no real effect. Every test has some risk of one; the aim is to keep it low and known.
Sources
Academic papers, company engineering blogs and vendor documentation were checked against the original pages on 27 September 2026. Vendor claims about their own products are labelled as such. The A/A and peeking simulations and the sample size figures are Henkan & Partners calculations from standard formulas. The situation guide, comparison tables, programme by team size and recommendations are Henkan & Partners' own analysis.
- Kohavi, Deng and Vermeer, A/B Testing Intuition Busters, KDD 2022
- Kohavi, Deng, Longbotham and Xu, Seven Rules of Thumb for Web Site Experimenters, KDD 2014
- Kohavi, Crook and Longbotham, Online Experimentation at Microsoft, 2009
- Kohavi, Tang and Xu, Trustworthy Online Controlled Experiments, Cambridge University Press, 2020
- Deng, Knoblich and Lu, Applying the Delta Method in Metric Analytics, KDD 2018
- Deng, Xu, Kohavi and Walker, Improving the Sensitivity of Online Controlled Experiments by Utilizing Pre-Experiment Data (CUPED), WSDM 2013
- Armitage, McPherson and Rowe, Repeated Significance Tests on Accumulating Data, JRSS A, 1969
- Evan Miller, How Not To Run an A/B Test, 2010
- Wikipedia, Pocock boundary
- Spotify Engineering, Choosing a Sequential Testing Framework, 2023
- Johari, Pekelis and Walsh, Always Valid Inference (arXiv)
- Howard, Ramdas, McAuliffe and Sekhon, Time-uniform, nonparametric, nonasymptotic confidence sequences (arXiv)
- Stucchio, Bayesian A/B Testing at VWO, 2015
- David Robinson, Is Bayesian A/B Testing Immune to Peeking? Not Exactly, 2015
- Scott, Multi-armed bandit experiments in the online service economy, 2015
- Fabijan et al., Diagnosing Sample Ratio Mismatch in Online Controlled Experiments, KDD 2019
- Wikipedia, Multiple comparisons problem
- Optimizely, Statistical analysis methods overview
- Optimizely, False discovery rate control
- Optimizely, How long to run an experiment
- Optimizely, CUPED
- Optimizely, Stats Accelerator compared to multi-armed bandit optimizations
- VWO, Introducing VWO's enhanced SmartStats, December 2024
- AB Tasty, Statistics for the reporting
- AB Tasty, Frequentist Analysis mode
- Kameleoon, Choosing the right statistical method for A/B testing
- Kameleoon, Statistical significance
- Convert, Statistical Methods Used
- Adobe Experience League, Statistical calculations in A/Bn tests
- Dynamic Yield, The Bayesian Approach to A/B Testing
- Amplitude, Finalize your experiment's advanced settings
- Statsig, p-Value Calculation
- Statsig, Winsorization
- GrowthBook, Statistics overview
- GrowthBook, Multiple Testing Corrections
- Datadog, Analysis methods (Datadog Experiments)
- LaunchDarkly, Bayesian versus frequentist statistics
- LaunchDarkly, Statistical methodology for frequentist experiments
- PostHog, Frequentist statistics
- Mixpanel, Experiments
- SiteSpect, SiteSpect Statistics
- PR Newswire, AB Tasty and VWO Unite Under Wingify, September 2026
- GlobeNewswire, VWO and AB Tasty Join Forces, January 2026
- Datadog, Datadog Acquires Eppo, May 2025
- Amplitude, Amplitude and Statsig partnership, May 2026
- StatQA: Are Large Language Models Good Statisticians? (NeurIPS 2024)
- QRData: Are LLMs Capable of Data-based Statistical and Causal Reasoning? (2024)
- DSBench: How Far Are Data Science Agents from Becoming Data Science Experts? (2024)
- DA-Code: Agent Data Science Code Generation Benchmark (2024)
- Gao et al., PAL: Program-aided Language Models (2023)
- Cureus, Evaluating the accuracy of LLMs in statistical test selection, 2025
- Family Practice, ChatGPT's performance in sample size estimation, 2025
- Journal of Behavioral Data Science, Can Large Language Models be Trusted for Power Analysis?, 2026
- BMC Medical Research Methodology, Classifying 25 misinterpretations of statistical tests: a comparison of six LLMs, 2026
- Asher et al., Do Claude Code and Codex P-Hack? Sycophancy and Statistical Analysis in LLMs (working paper, 2026)
- Miao, Pritchard and Zou, The Agentic Garden of Forking Paths (arXiv, 2026)
- Statsig, AI-Powered Experiment Summary, December 2025
- Kameleoon, Kai (AI assistant) documentation
- AB Tasty, Reporting Copilot
- AB Tasty, Evi Analysis
- PostHog, Analyze experiments with PostHog AI
- Adobe Experience League, Experimentation Agent
- Amplitude, Amplitude introduces agentic AI analytics, February 2026
- Optimizely, 2026 Opal release notes
- Optimizely, Experimentation MCP server overview
- CMSWire, Optimizely launches remote MCP server, April 2026
- GrowthBook, Introducing the first MCP server for experimentation and feature management, May 2025
- Statsig, Guide to using Statsig's MCP server
- Amplitude, Amplitude MCP server
- Optimizely, The Opal AI Benchmark Report
- Henkan & Partners, The Essential Guide to A/B Testing
- Henkan & Partners, JavaScript Injection, Client-Side or Server-Side A/B Testing
- Henkan & Partners, The A/B Testing Tool Market, 2006–2026
- Henkan & Partners, How AI Is Reshaping A/B Testing: What 19 Prompt-Built Tests Tell Us