Focus
Synthetic Users in Customer Research: What AI Personas Can and Cannot Replace
Alexandre Suon · 2026-09-28
Synthetic users are AI personas that answer research questions in place of real customers. The best published studies show they can reproduce known survey patterns surprisingly well, and the same literature shows them flattening differences, drifting between model versions and getting relationships wrong. This deep dive sets out what synthetic personas can and cannot replace in customer research, how to validate them, and how to combine them with real research and A/B testing.
Executive summary
- Synthetic users are language-model simulations of customers, not a new source of customer data. Every answer is a prediction of what a person like this might say, generated from the model's training data and whatever real data you ground it in. Treat outputs as hypotheses, never as measurements.
- At the aggregate level, the best evidence is genuinely encouraging. GPT-3 silicon samples matched US vote choice with tetrachoric correlations of 0.90 to 0.94 (Argyle et al., 2023). Stanford agents built from two-hour interviews reproduced people's survey answers 85% as accurately as those people reproduced their own answers two weeks later (Park et al., 2024).
- The failures are systematic, not random. Synthetic answers show too little variance, 48% of regression coefficients in one study differed significantly from real survey data and a third of those flipped sign (Bisbee et al., 2024), and results changed after a silent model update. Minority views, independents and people over 65 are poorly represented.
- Grounding in real, first-party data matters more than the choice of model. Agents given only demographics reached 74% of test-retest consistency; agents given interviews and surveys reached 86%. Personas built from your analytics, survey and CRM data are more useful than personas invented in a prompt, but they still inherit the limits of what you measured.
- Use synthetic users to sharpen questions, not to answer them. They are good for drafting and stress-testing surveys and copy, preparing interviews, early concept screening and exploring known segments. They cannot replace effect sizes, pricing decisions, A/B test results, behaviour, new categories or small segments.
- Validate before you trust, and label every output. Back-test the panel against surveys you have already run, hold out questions, check variance and subgroups, and repeat after every model change. Then put real research and controlled experiments downstream of every synthetic finding that matters.
Section 1 · Definitions
Synthetic users are AI stand-ins for customers, not a new kind of respondent
Synthetic users (also called synthetic respondents or synthetic personas) are simulated research participants generated by a large language model (LLM), conditioned on a profile such as demographics, attitudes or real behavioural data, and used to answer surveys, take part in interviews or react to concepts as a real customer might.
The idea is simple. A large language model has read a vast amount of text written by people. If you describe a person to it and ask a question, it predicts how such a person would probably answer. Ask a thousand times with a thousand different profiles and you have a synthetic sample. The appeal is obvious: answers in minutes instead of weeks, no recruitment, no incentives and no panel fatigue.
The risk is just as obvious once you say it plainly. No customer was asked anything. The answer is a statistical guess about people, produced by a model trained mostly on public internet text and tuned to be helpful and agreeable. Whether that guess is useful depends on the question, the grounding data and whether anyone has checked it against reality.
The vocabulary is used loosely across vendors and papers. The distinctions below are the ones that matter in practice.
| Term | What it means | Typical use |
|---|---|---|
| Synthetic respondent | A single simulated answer set to a structured questionnaire, usually one of many in a synthetic sample. | Survey pre-tests, concept screening, attitude tracking |
| Synthetic persona | A named, described character ("Sophie, 34, urban, price-sensitive") that can be questioned repeatedly. | Interviews, workshops, copy and journey reviews |
| Synthetic user | The umbrella term used by product and UX teams for either of the above. | UX and product discovery |
| Silicon sampling | Conditioning a model on the demographic backstories of real survey respondents to reproduce a population's answer distribution. Coined by Argyle et al. (2023). | Academic replication of known surveys |
| Generative agent / digital twin | A simulation of one specific real person, built from that person's own interview or survey data, used to predict how they would answer new questions. | Individual-level prediction, research panels |
A digital twin in this sense is the most demanding version. The 2025 Twin-2K-500 dataset from Olivier Toubia and colleagues, for example, surveyed 2,058 US participants across four waves and 500 questions, averaging 2.42 hours per person, precisely so that researchers could build and test twins at the individual level. Most commercial "synthetic users" are nowhere near that depth: they are personas assembled from a short profile and a prompt.
Our view. The single most useful question to ask any synthetic panel, internal or bought, is: what real data does each persona rest on, and when was it last checked against real answers? If the answer is "a demographic description and the model's general knowledge", you have a brainstorming tool. If the answer is "measured behaviour and survey data from our own customers, back-tested last month", you have something closer to a research instrument, though still not a replacement for one.
Section 2 · How they are built
How a synthetic panel is built matters more than which model runs it
There are five common ways to build synthetic users. They sit on a ladder from cheapest and least grounded to most expensive and most grounded. Vendors rarely say exactly which rung they are on, so it is worth knowing what to ask.
1. Prompted personas
You write a description ("You are a 45-year-old mother of two in Lyon who shops online for groceries weekly") and ask the model to answer in character. This takes minutes and needs no data. Everything the persona "knows" comes from the model's training data, which means it reflects internet stereotypes of that kind of person. This is the setup most early tools used, and the one most prone to the failures described in Section 4.
2. Backstory conditioning (silicon sampling)
Instead of inventing profiles, you take the real demographic and attitudinal profiles of respondents from an existing survey and ask the model to answer as each of them. Argyle and colleagues did this with thousands of backstories from the American National Election Studies (ANES). The result is a synthetic sample whose composition mirrors a real one, which corrects some of the model's skew but still relies on the model's general knowledge for the answers.
3. Personas grounded in first-party data (retrieval)
Here each persona is built from your own measured data: web and app analytics (what segments browse, abandon and buy), survey and review verbatims, customer relationship management (CRM) attributes, support tickets and interview transcripts. At question time, the system retrieves the relevant records and feeds them to the model alongside the question. This technique is called retrieval-augmented generation (RAG). The model is still predicting, but it predicts from your customers' own words and behaviour rather than from a stereotype.
4. Fine-tuned models
Fine-tuning means further training a model on many examples of real answers so that its default responses shift towards them. Brand, Israeli and Ngwe report that fine-tuning GPT on previous survey data from similar contexts improved alignment with human answers for existing product features and new variants of them, but did not produce comparable gains for entirely new product categories or for differences between customer segments. Fine-tuning is powerful inside the territory the data covers and weak outside it.
5. Individual digital twins
The most grounded approach builds one agent per real person from that person's own rich data, typically a long interview and a battery of survey answers, then asks the agent new questions. This is expensive to build, raises serious consent questions and is mostly found in research settings today. It is also where the strongest accuracy results come from.
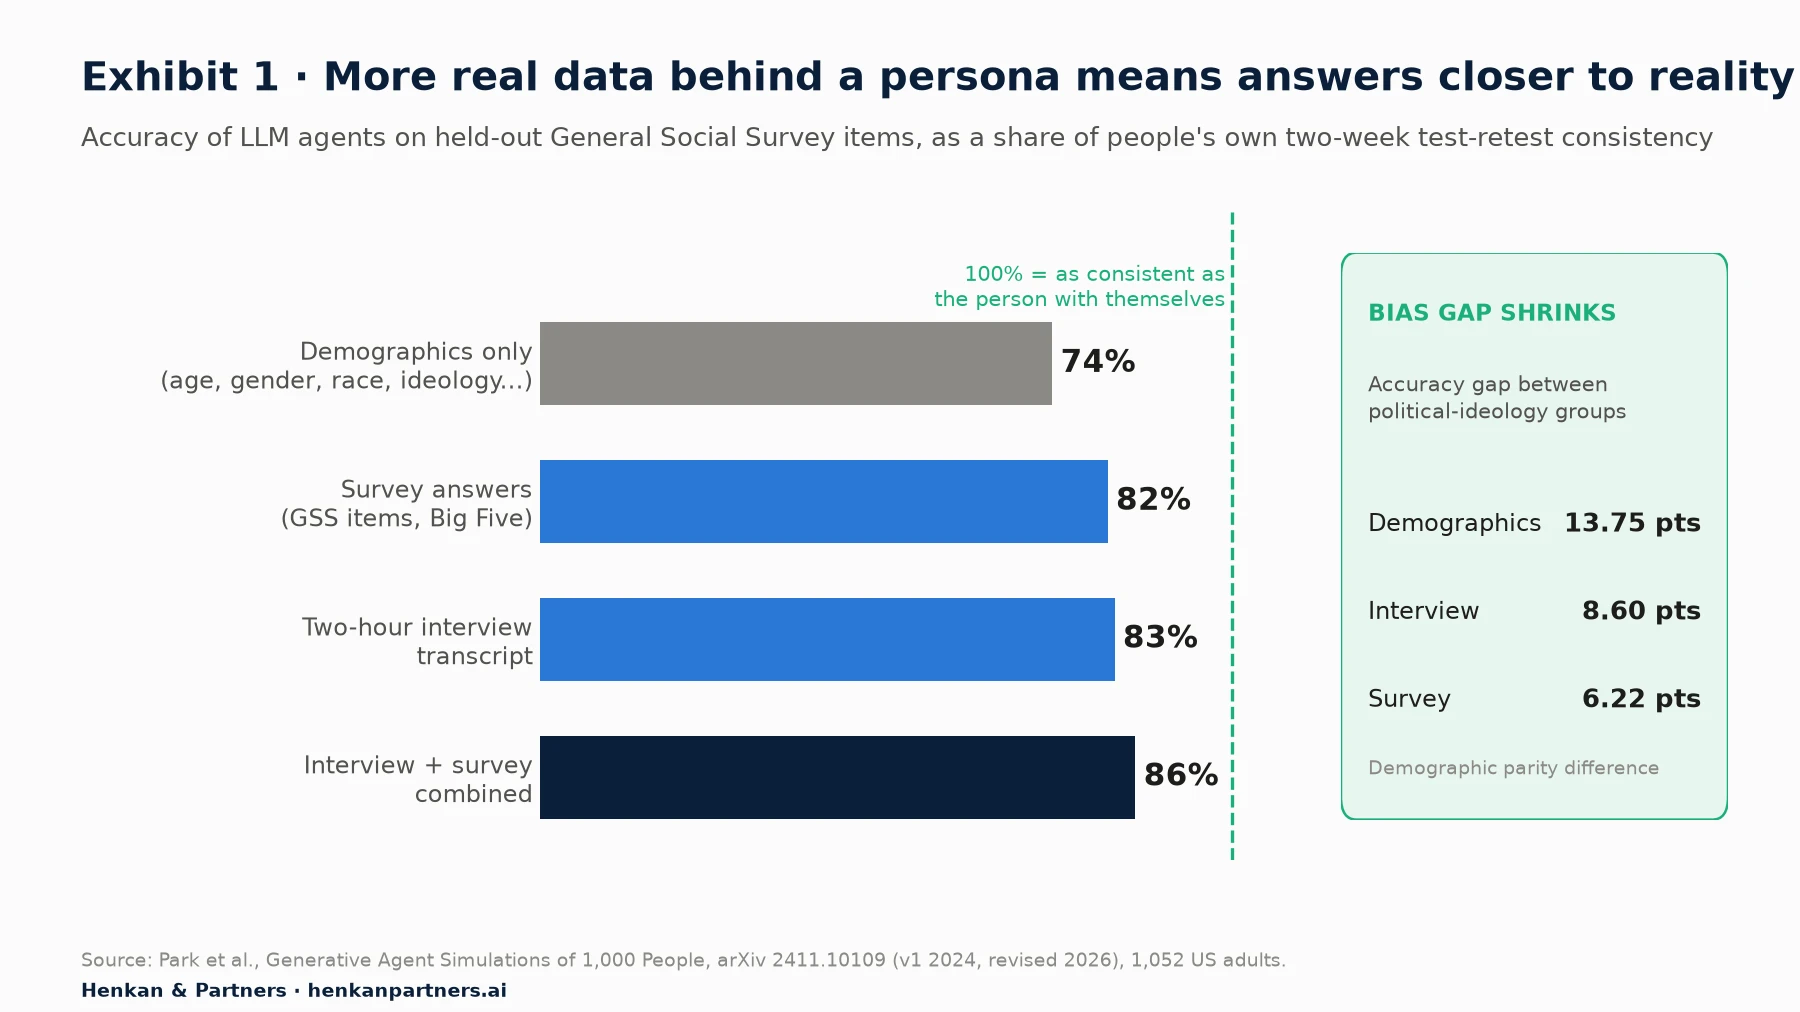
What this shows. Park and colleagues built agents for 1,052 Americans and tested them on survey items the agents had not seen. Measured against how consistently people answer the same questions two weeks apart, demographics-only agents reached 74%; agents built from real interviews and surveys reached 82% to 86%. Grounding also cut the accuracy gap between political-ideology groups roughly in half. The lesson for businesses is direct: the data behind a persona matters more than the persona's description. Note that the gains from combining sources were modest, which suggests returns diminish once the model has enough evidence about a person.
| Approach | Data needed | Cost and speed | Main strength | Main weakness |
|---|---|---|---|---|
| Prompted persona | None | Minutes, near zero | Instant ideation | Stereotyped, agreeable, unvalidated |
| Silicon sampling | Profiles of real respondents | Hours | Mirrors a real sample's composition | Answers still come from general knowledge |
| Grounded in first-party data (RAG) | Analytics, surveys, CRM, verbatims | Days to set up | Speaks from your customers' own words and behaviour | Only as good, and as recent, as the data |
| Fine-tuned model | Many past survey answers | Weeks, specialist skills | Strong within known categories | Weak on new categories and segment differences |
| Individual digital twin | Long interviews and surveys per person | Months, high cost, consent | Best individual-level accuracy | Hard to scale, privacy-heavy |
Disclosure: Henkan & Partners offers a synthetic user panel built from clients' measured analytics and survey data (Henkan Labs), which sits in the "grounded in first-party data" row above. We have tried to describe every approach, including its weaknesses, on the evidence alone.
Section 3 · The case for
At the aggregate level, the best studies show synthetic samples can reproduce known human patterns
Since 2022, a small body of peer-reviewed papers and preprints has tested whether language models can stand in for human samples. The headline results are strong enough to explain why the market exists. Read them carefully, though: almost all of them test whether a model can reproduce results that were already known.
Argyle et al. (2023): "Out of One, Many" and silicon sampling
Published in Political Analysis, this paper introduced the term algorithmic fidelity: the degree to which a model, conditioned on a subgroup's characteristics, reproduces that subgroup's response patterns. The authors set four tests: generated text should be indistinguishable from human text (a "social science Turing test"), consistent with the conditioning profile (backward continuity), natural in tone and form (forward continuity), and should reproduce the relationships between variables seen in real data (pattern correspondence).
Using GPT-3 and ANES backstories, the silicon sample's vote choice matched real respondents with tetrachoric correlations of 0.90 (2012), 0.92 (2016) and 0.94 (2020). Across the ANES variables tested, the associations between items (measured by Cramér's V) differed from the human data by a mean of just −0.026. In a free-text task, human judges could not reliably tell GPT-3's lists of words describing partisans from human ones.
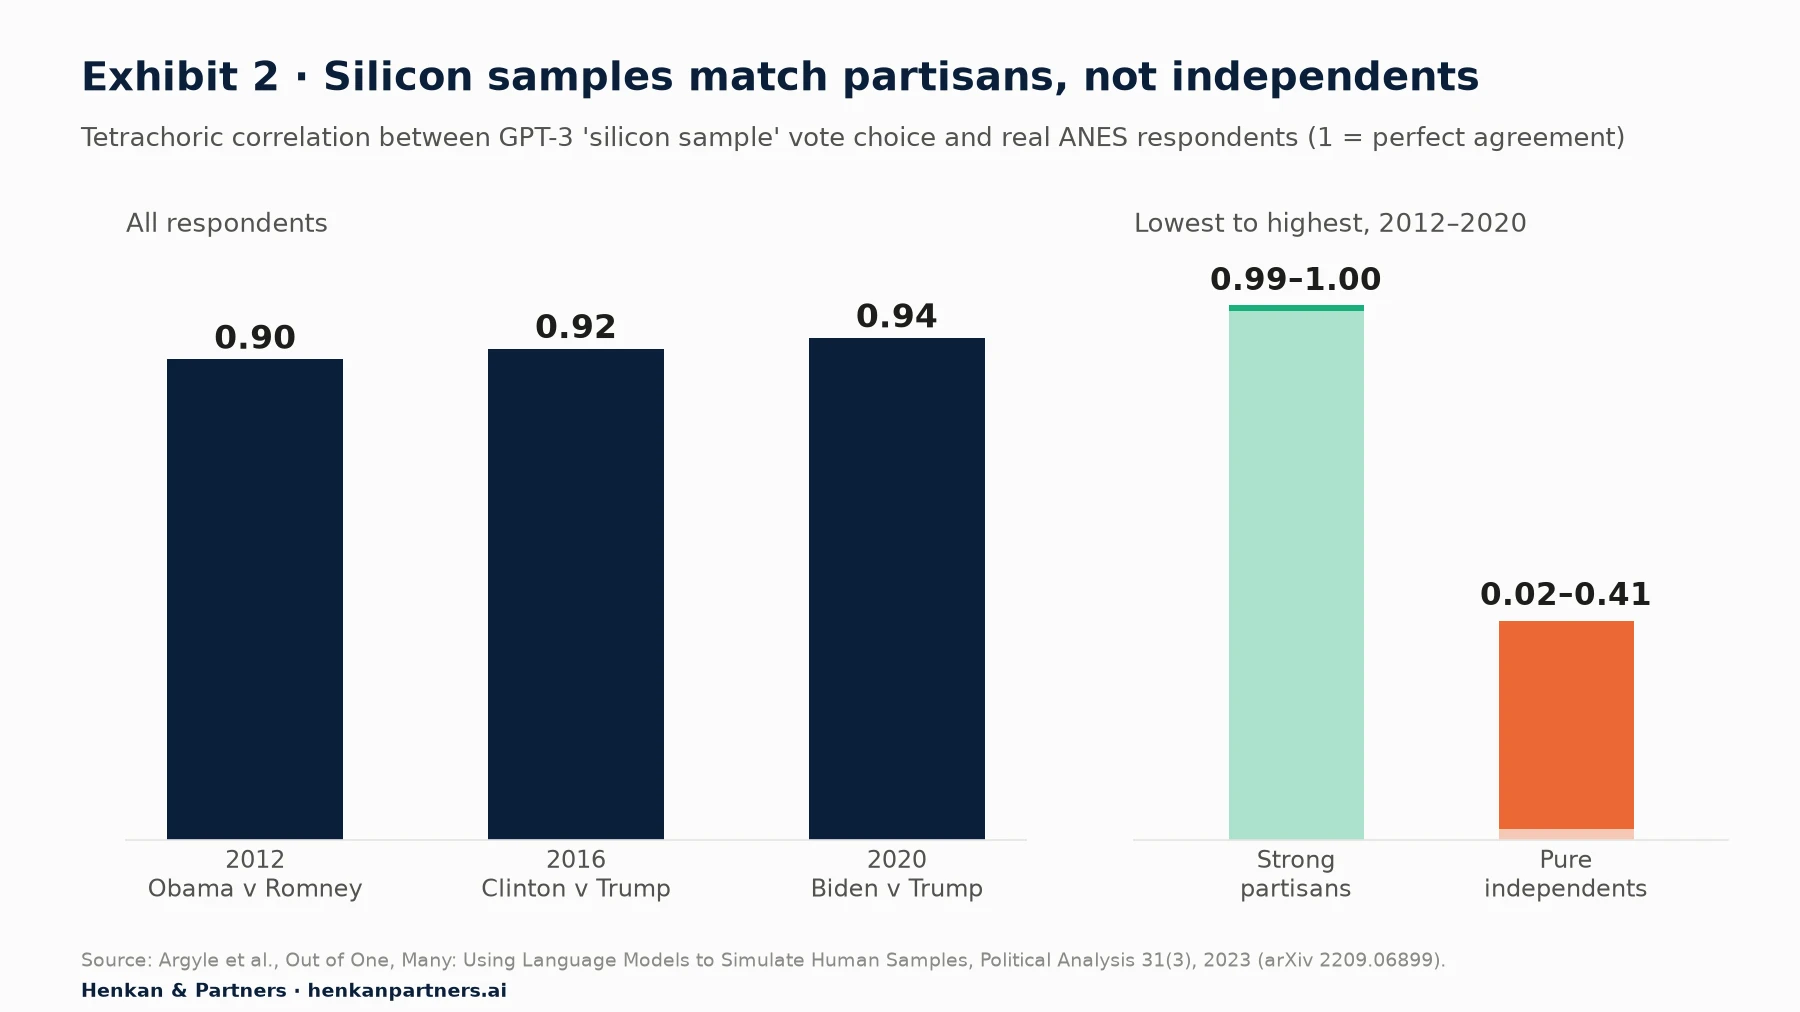
What this shows. The overall correlations look excellent. Split by group, the picture changes: strong partisans, whose vote is easy to predict from their profile, were matched almost perfectly, while pure independents, the people campaigns most want to understand, were matched poorly. In commercial terms, a synthetic panel will tend to be most accurate for the customers whose behaviour you could already predict, and least accurate for the undecided middle where most optimisation value sits.
Horton (2023): homo silicus
Economist John Horton, later with Apostolos Filippas and Benjamin Manning, argued that LLMs are "implicit computational models of humans", a homo silicus that can be given endowments, information and preferences and then observed in simulated scenarios. Using a GPT model, he re-ran classic behavioural economics experiments on fairness and social preferences (Charness and Rabin, 2002), fairness judgements about price rises (Kahneman, Knetsch and Thaler, 1986) and status quo bias (Samuelson and Zeckhauser, 1988). The results were qualitatively similar to the originals. The paper's contribution is less the accuracy than the idea: cheap simulations let you try many variations of an experiment before running the expensive human one.
Aher, Arriaga and Kalai (2023): Turing experiments
Presented at the International Conference on Machine Learning (ICML) in 2023, this paper proposed Turing experiments: instead of asking whether a model can pass as one human, ask whether it can simulate a representative sample of participants in a classic study. The authors replicated the Ultimatum Game, garden-path sentence parsing, the Milgram obedience experiment and a "wisdom of crowds" estimation task. The first three replicated reasonably well with larger models. The fourth exposed what they called a hyper-accuracy distortion: newer, more aligned models such as ChatGPT and GPT-4 gave implausibly correct answers to general-knowledge questions, unlike real people. A persona that knows too much is as unrealistic as one that knows too little.
Brand, Israeli and Ngwe (2023): GPT for market research
This Harvard Business School working paper is the most directly relevant to e-commerce. The authors asked GPT-3 to act as a customer choosing between products at different prices and found largely realistic behaviour: downward-sloping demand and plausible willingness to pay (WTP), though evidence of diminishing marginal utility was mixed across scenarios. The method mattered enormously.
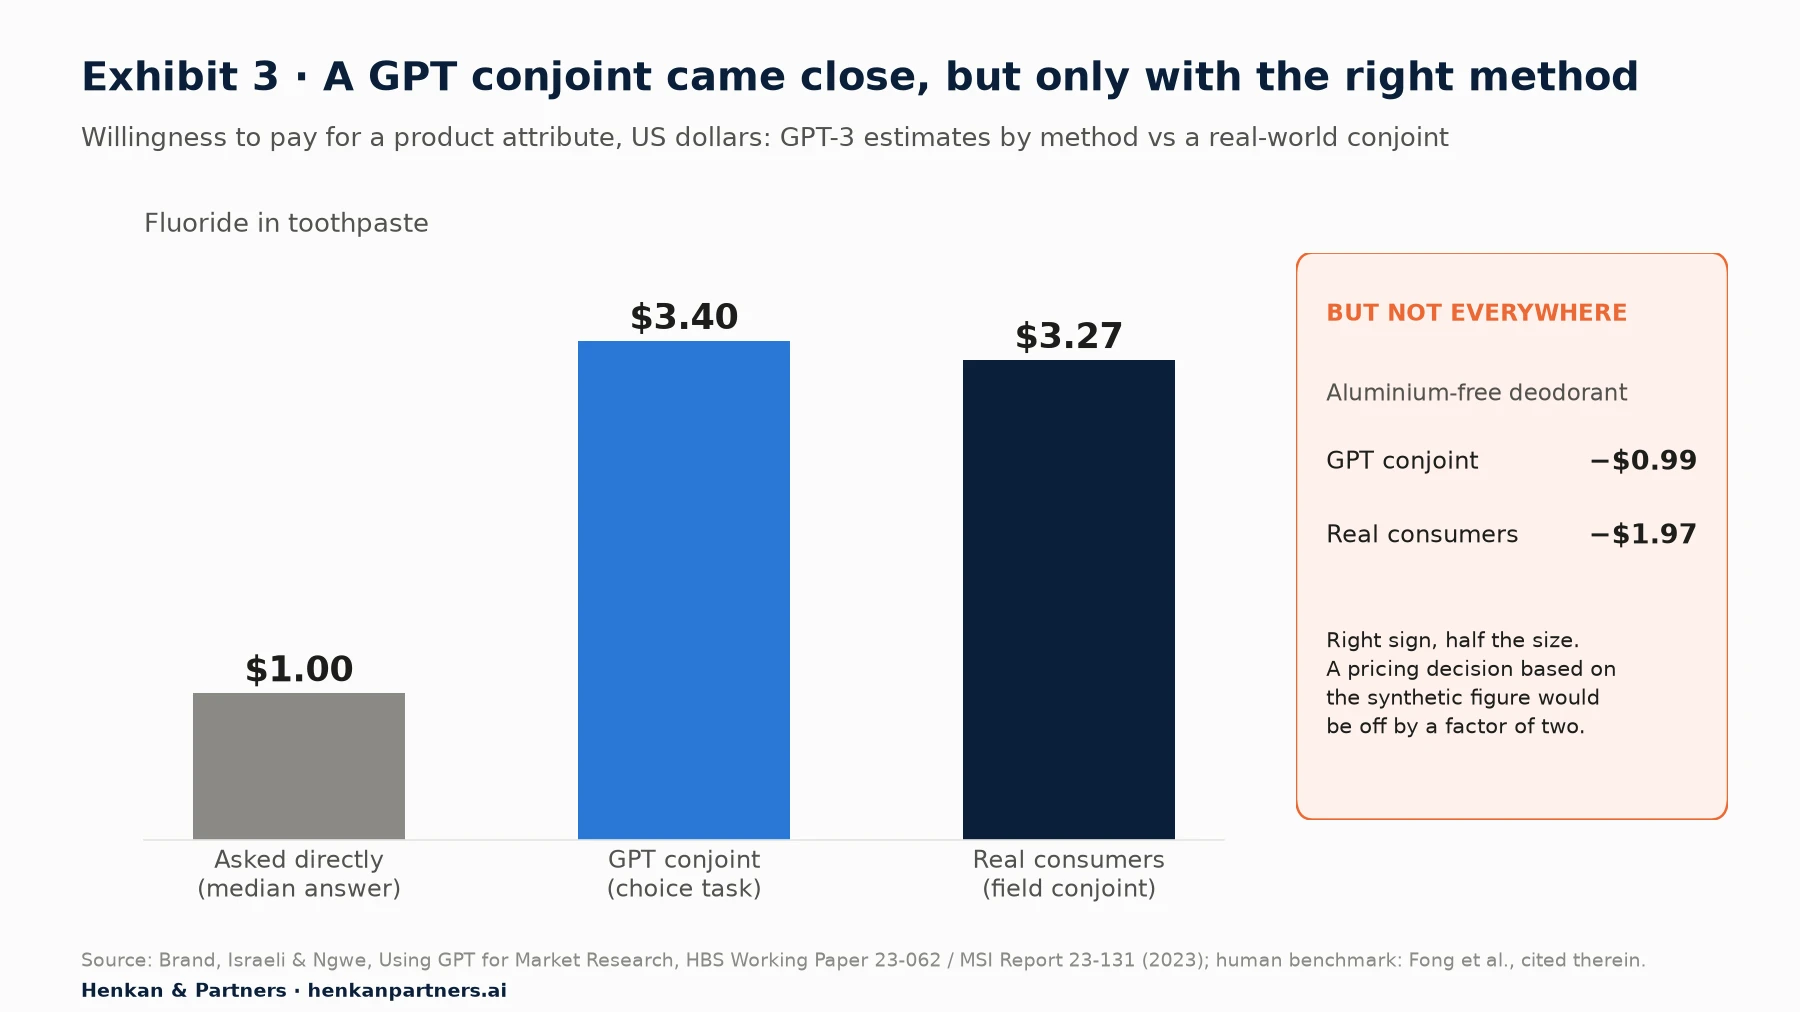
What this shows. When GPT-3 was simply asked what fluoride was worth, the median answer was $1.00. When it instead made repeated choices between toothpastes with and without fluoride at different prices (a conjoint design), the implied WTP was $3.40, close to the $3.27 found in a real conjoint with consumers. For aluminium-free deodorant, the same approach got the direction right but produced about half the real value. One study, one model generation, two attributes: encouraging for directional reads, not a basis for setting prices.
The revised version of the paper adds the fine-tuning result described in Section 2: fine-tuning on earlier survey data improved alignment for known features and variants of them, but not for new categories or segment-level differences. That limitation is the one that matters most for innovation work.
Park et al. (2024): generative agents of 1,052 people
The Stanford-led study shown in Exhibit 1 is the strongest individual-level result to date. Its first version reported that agents replicated participants' General Social Survey answers "85% as accurately as participants replicate their own answers two weeks later"; the 2026 revision reports 83% for interview-based agents, 82% for survey-based agents and 86% for both combined, against 74% for demographics only. The same agents also predicted Big Five personality traits and behaviour in economic games, and reproduced the effects in five published experiments, with an effect-size correlation of 0.98 for interview-based agents.
Two caveats. First, these are agents of specific people built from two hours of interview each, which is not what most commercial tools offer. Second, a demographics-only persona baseline also reproduced the experimental effects well (r = 0.93), which suggests that replicating well-known effects is an easier test than predicting individuals.
Newer evidence: predicting experiments and purchase intent
Two more recent strands are worth knowing. Luke Hewitt, Ashwini Ashokkumar, Isaias Ghezae and Robb Willer tested whether GPT-4 could predict the results of survey experiments; their project site reports that predicted effect sizes correlated with actual ones at r = 0.85, and describes the work as published in Nature in 2026. For large multi-treatment experiments, the correlation fell to 0.34, roughly on par with expert forecasters (0.26). Correlation of effect sizes is not the same as getting the magnitude right, but it suggests models can help rank which treatments are worth testing.
In consumer goods, researchers from PyMC Labs and Colgate-Palmolive tested synthetic consumers on 57 personal-care concept surveys with 9,300 human responses. Their method, semantic similarity rating (SSR), asks the model for a free-text reaction and then maps that text onto the rating scale, instead of asking for a number. It reached 90% of human test-retest reliability in ranking concepts. We return to why the elicitation method matters in Section 4.
For marketers. The positive studies are strongest where the question is well-trodden (politics, classic economics games, familiar grocery categories) and the output is an average or a ranking. Your brief is probably less well-trodden than that.
For leaders. None of these papers shows a synthetic panel predicting a new product's sales, a price change's revenue impact or the result of an A/B test. Treat any vendor claim that implies otherwise as unproven until you have seen your own back-test.
Section 4 · The case against
Averages often survive; variance, subgroups and relationships often do not
The critical literature is as solid as the positive one, and it points to failures that are systematic rather than random. That is good news in one sense: systematic failures can be tested for.
Bisbee et al. (2024): the perils of synthetic survey data
James Bisbee, Joshua Clinton, Cassy Dorff, Brenton Kenkel and Jennifer Larson asked ChatGPT to answer ANES "feeling thermometer" questions (0 to 100 ratings of groups) as personas matching real respondents. Average scores were reasonably close to the real ones. Almost everything beneath the average was not.
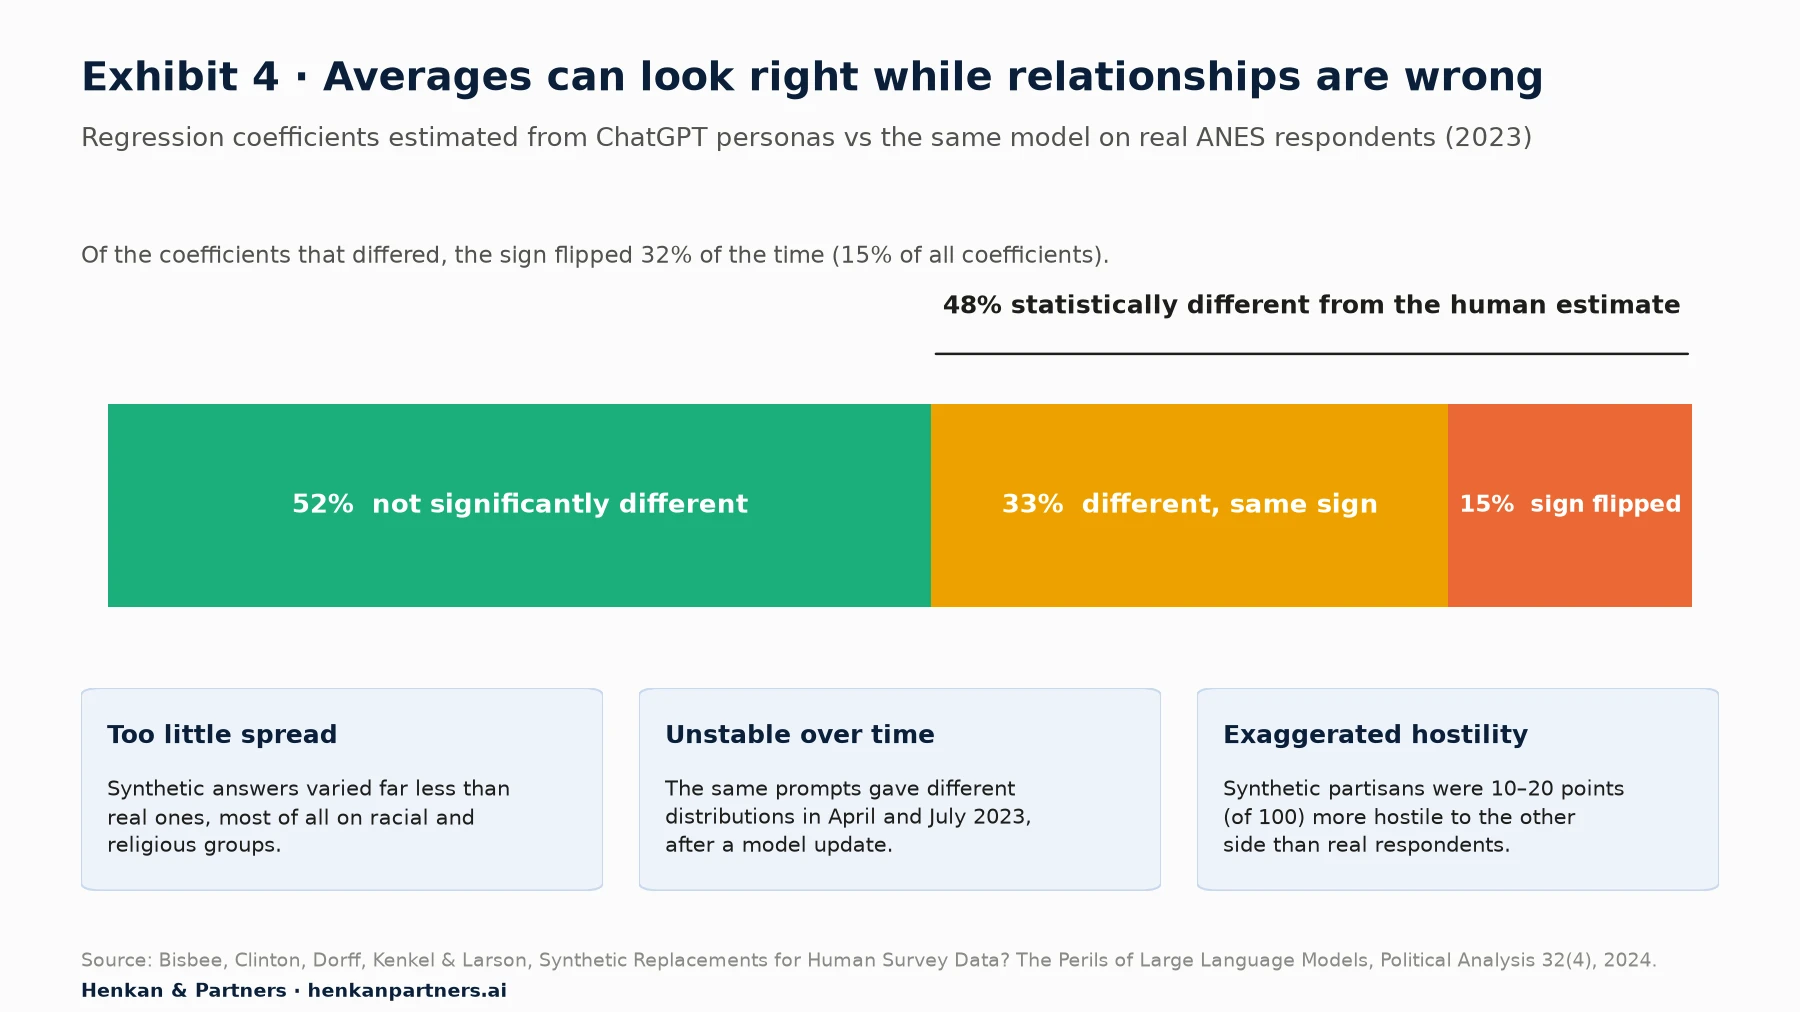
What this shows. When the authors ran the same regressions on synthetic and real answers, 48% of coefficients differed significantly, and in 32% of those cases the sign flipped. Synthetic answers varied far less than real ones, especially about racial and religious groups, and synthetic partisans were more hostile to the other side than real ones. Most worrying for anyone building a process: identical prompts produced materially different distributions in April and July 2023, after a model update. If your team drew a segment insight from a synthetic panel in spring, it may not have reproduced in summer.
Santurkar et al. (2023): whose opinions do language models reflect?
Stanford researchers compared language model answers with US public opinion across 60 demographic groups using Pew survey questions (the OpinionQA dataset). They found misalignment between models and the population comparable to the gap between Democrats and Republicans on climate change. The misalignment persisted even when models were explicitly asked to answer as a given group, and some groups, including people aged 65 and over and widowed people, were poorly represented. Models tuned with human feedback leaned towards particular groups' views. The implication is that a model's "default customer" is a specific, skewed kind of person, and prompting alone does not fully fix it.
Wang, Morgenstern and Dickerson (2025): misportrayal and flattening
Published in Nature Machine Intelligence, this study compared four LLMs with 3,200 human participants across 16 demographic identities. It found that models misportray groups (answering as outsiders imagine the group, not as members speak), flatten the diversity of views within groups, and encourage identity essentialism, treating a demographic label as if it determined opinions. The authors advise against replacing human participants wherever identity is relevant to the task, especially for marginalised groups.
Sycophancy and unrealistic positivity
Language models trained with human feedback tend towards sycophancy: telling the user what they appear to want to hear. Anthropic researchers showed in 2023 that five state-of-the-art AI assistants behave this way consistently across tasks, and that the behaviour is partly driven by human raters preferring agreeable answers. In research this shows up as enthusiasm. When Nielsen Norman Group tested synthetic users in 2024, a synthetic participant claimed to have completed every online course it had started, whereas a real participant admitted not finishing them. Shown a hypothetical drone-delivery concept, it called the idea a "game-changer". Synthetic users also listed seven things that make a course engaging but could not say which mattered most, which is the only part a product team needs.
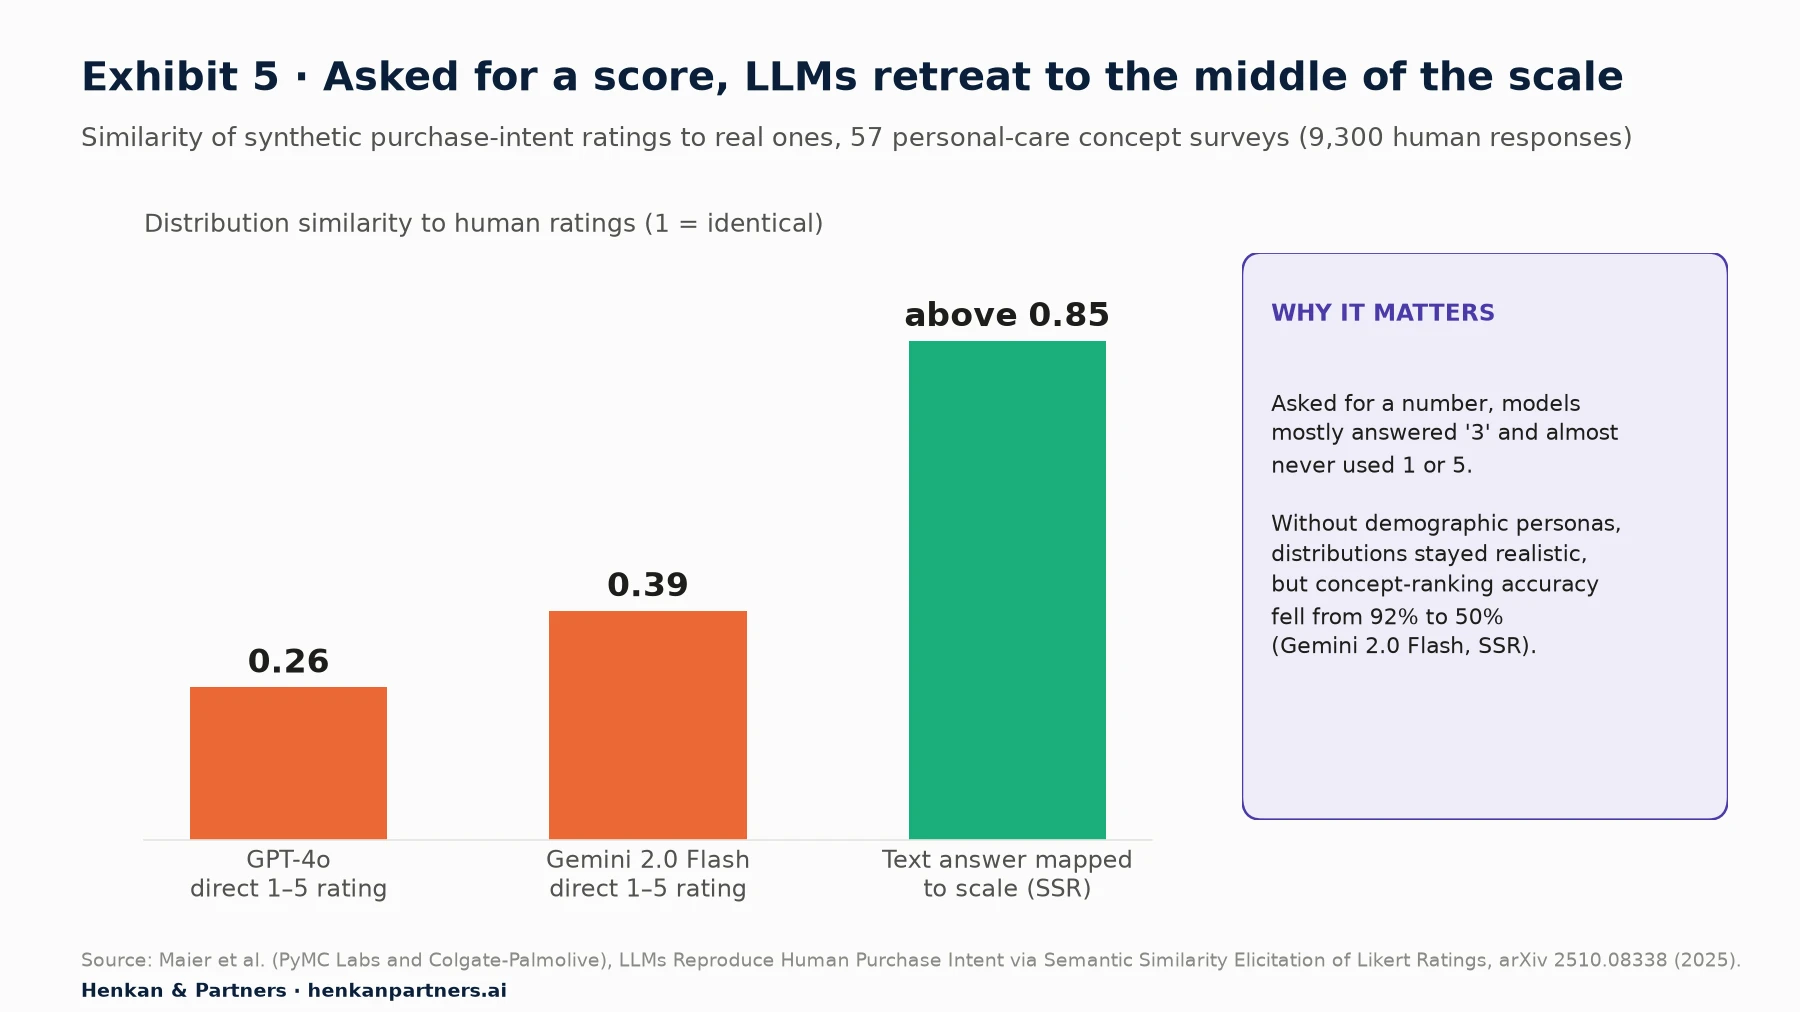
What this shows. When asked directly for a 1-to-5 purchase-intent score, GPT-4o and Gemini 2.0 Flash mostly answered 3 and almost never used 1 or 5. Distribution similarity was 0.26 and 0.39. Mapping free-text reactions onto the scale raised similarity above 0.85. Removing the demographic personas kept distributions realistic but badly weakened the model's ability to tell strong concepts from weak ones (correlation attainment of 50% versus 92% with personas, for Gemini 2.0 Flash). The practical lesson: a synthetic panel's accuracy depends on the elicitation method as much as the model, so ask vendors exactly how scores are produced.
Other failure modes to test for
- Western, educated and online bias. Models learn from text that over-represents English-speaking, educated, internet-active people. Santurkar et al. show the skew within the US; it is likely to be larger for markets and languages that are less represented online. Test every market separately.
- Poor performance on the new. Fine-tuning did not transfer to new product categories in Brand et al. A model cannot have read reviews of a product that does not exist yet, so it falls back on analogies.
- Hidden confounding in simulated experiments. George Gui and Olivier Toubia showed, across demand estimation for 40 products, that when a model is told only that a price has changed, it silently changes its assumptions about other things too (quality, context), producing implausible demand curves. Revealing the experimental design to the model helped.
- Hyper-accuracy. Newer models know facts real customers do not, which distorts tasks involving knowledge, estimates or comprehension (Aher et al.).
- Model drift. Results can change when the provider updates the model, without notice (Bisbee et al.). Pin model versions and re-test after every change.
Our view. The pattern across these studies is consistent. Synthetic samples are best at central tendency on familiar questions and worst at spread, subgroups, relationships, the new and the negative. Most of the decisions that matter in e-commerce optimisation live in the second list.
Section 5 · The market
The vendor market is growing fast, and its accuracy claims are not comparable
Synthetic research has moved from academic curiosity to venture-funded category in about three years. The table summarises six vendors we checked in September 2026. Every accuracy figure is vendor data: self-reported, measured on the vendor's chosen questions with the vendor's chosen metric.
| Vendor | What it offers | How personas are grounded | Headline claim (vendor data) | Notable facts |
|---|---|---|---|---|
| Synthetic Users | AI-moderated interviews and surveys with synthetic participants | Stable personality profiles (OCEAN model); optional RAG on your transcripts, tickets and conversations | "85–92% synthetic-organic parity" in comparison studies; $2–60 per interview | States that uncalibrated synthetic users are "individually believable, but collectively wrong" |
| Evidenza | Synthetic B2B buyers for surveys and interviews | "AI-based copies" of target customers; method not detailed publicly | 88% average similarity across 100+ validation tests; cites a 0.81 correlation in a Salesforce test | Co-founded by Peter Weinberg and Jon Lombardo, formerly of LinkedIn's B2B Institute |
| Aaru | Behaviour simulation of populations for product, pricing, messaging and scenario planning | "Public and proprietary data" | Mean total variation distance 7.62% and mean absolute error 3.53% across 2,993 questions | Series A led by Redpoint Ventures, over $50m, with some shares at a $1bn valuation (TechCrunch, December 2025); partners include Accenture, EY and Interpublic Group |
| Electric Twin | Synthetic audiences answering research questions in seconds | Built from customer data | "Up to 96% match rate" (1 minus mean absolute error); validation with LSE cited, 50,000+ evaluations | Co-founder Ben Warner is a former Chief Data Adviser to the UK Prime Minister |
| Qualtrics | Synthetic panels inside its research platform | Fine-tuned LLMs built for market research | "Twelve times more accurate" in matching human responses than general-purpose AI | Showcased at X4, March 2026; panels for the UK, Ireland, Canada, Australia and New Zealand announced for H1 2026 (diginomica) |
| Toluna | Toluna Synthetic Personas for claims, idea and ad pre-tests | Anonymised first-party data from a panel of 81 million+ people | "80% correlation to human responses"; ad-test results "120x faster" | Offers 1 million synthetic personas |
Three observations help you read this market.
The metrics are not comparable. "Parity", "similarity", "match rate", "correlation" and "total variation distance" measure different things. A 96% match on the average of a question is compatible with a flattened distribution and wrong subgroup patterns, as Bisbee et al. showed. Ask for the metric, the questions, the baseline and the spread.
The incumbents' advantage is data. Research incumbents can build on large bodies of real survey data (Toluna cites a panel of more than 81 million people). That is a real advantage for grounding, and it also means the personas reflect panel members, who are not the same as your customers.
Failure rates are rarely published. Vendor validation reports show where the product works. Academic papers show where the approach breaks. You need both views, which is why Section 7 is about running your own back-test.
For leaders. When buying, ask five questions: what real data grounds each persona; which model and version runs it and how you will be told when it changes; how scores are elicited; what the back-test results were on questions like yours, including variance and subgroups; and whether you own the outputs and the data you upload.
Section 6 · Where they fit
Use synthetic users to sharpen questions, not to answer them
The evidence supports a clear division of labour. Synthetic users are good at producing plausible options quickly. Real research and experiments are needed to decide which option is true and how big the effect is.
What synthetic personas are good for
- Hypothesis generation. Listing reasons a segment might abandon a basket, objections to a subscription offer or questions a first-time buyer might have. Each becomes a candidate for measurement.
- Stress-testing surveys and copy. Finding ambiguous wording, leading questions, missing answer options and jargon before a real survey or page goes live. Our guide to onsite survey design covers what good questions look like.
- Early concept screening. Knocking out clearly weak ideas and ranking a long list before spending on real concept tests, provided the category is familiar and the panel has been back-tested.
- Preparing interviews. Rehearsing a discussion guide, anticipating answers and planning follow-up probes so real interview time goes further.
- Exploring known segments. Asking a grounded persona to explain patterns you already see in analytics, to generate candidate explanations for testing.
What synthetic personas cannot replace
- Effect sizes. How much a change moves conversion, average order value or retention. Only a controlled experiment measures this; see our A/B testing guide.
- Pricing decisions. Even the best WTP result above was off by half on one attribute.
- Behaviour. What people say, synthetic or real, is not what they do. Synthetic answers are one step further removed.
- A/B test results. A panel predicting that a variant will win is a hypothesis, not a result.
- New categories and new markets. The model has no data about what does not yet exist, and fine-tuning did not transfer.
- Minority and hard-to-predict segments. Independents, older customers and under-represented groups are exactly where the evidence shows the largest errors.
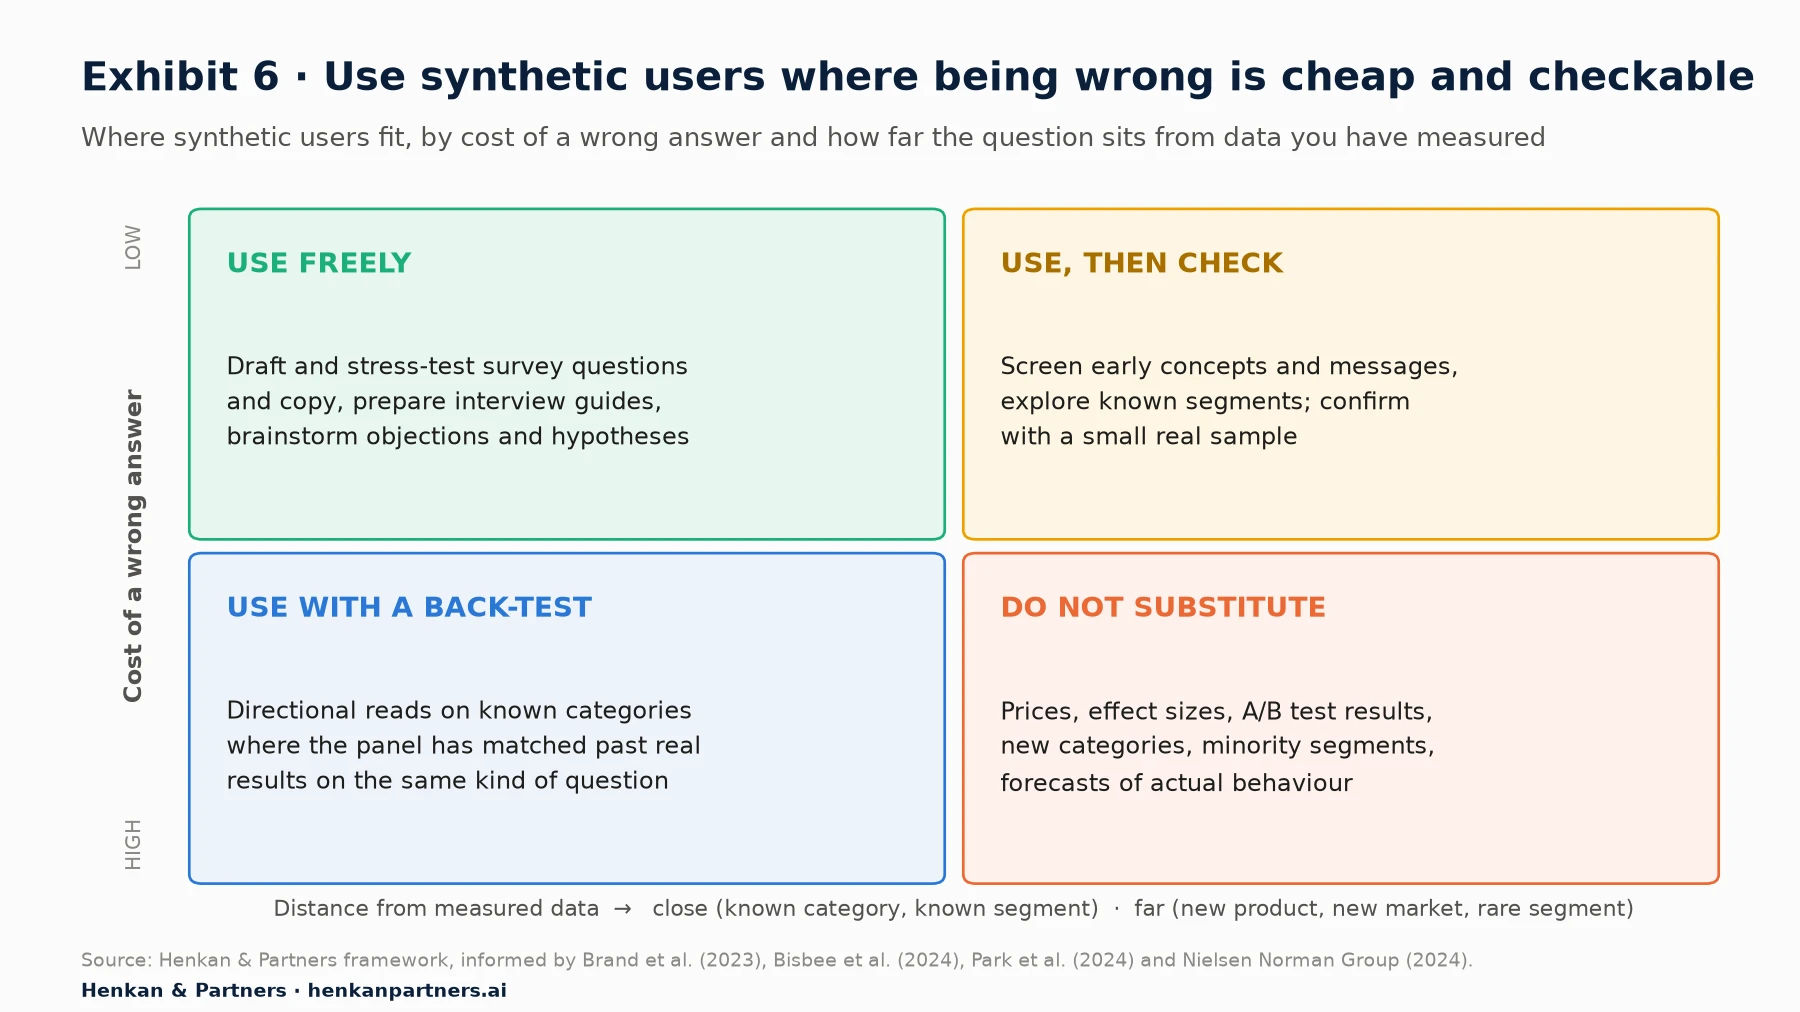
What this shows. The matrix turns the research into a rule of thumb. When a wrong answer is cheap and easy to catch later, such as a draft survey question, synthetic users save real time. When a wrong answer is expensive and the question is far from anything you have measured, such as the price of a new product line, they should not be used as evidence at all. The other two quadrants are where validation earns its keep.
| Decision or task | Synthetic users alone? | What to pair them with |
|---|---|---|
| Draft survey or interview guide | Yes, as a first pass | Pilot with 5–10 real respondents |
| Rewrite product-page copy | For ideas and clarity checks | A/B test the shortlisted versions |
| Rank 30 concept ideas to 5 | Only after a back-test on past concepts | Real concept test on the 5 |
| Explain a drop in a segment's conversion | To list candidate causes | Analytics, session replay and an onsite survey |
| Set a price or discount level | No | Real price test or conjoint, then an experiment |
| Forecast an A/B test winner | No | Run the test |
| Launch in a new country or category | No, beyond early desk research | Local qualitative and quantitative research |
| Understand a small or vulnerable segment | No | Research with that segment, with consent |
Section 7 · Validation
Validate a synthetic panel against data you already have before you trust it
You do not need to take anyone's word for a panel's accuracy, including ours. Most organisations already own the data to test it: past surveys, past concept tests, past A/B tests and analytics. The principle is the same one used in forecasting: back-testing, checking whether a method would have predicted results you already know.
Back-test against surveys you have already run
Take three to five past surveys with known results. Rebuild the respondent mix with synthetic personas, ask the same questions in the same order and compare. Do this before you look at the synthetic panel's view on any new question. If you cannot find past data on questions similar to your planned use, you have learned something important: the panel is operating outside territory you can check.
Hold out questions the panel has not seen
If personas are grounded in your survey data, some questions from those surveys must be held back from the grounding data and used only for testing. Otherwise the panel is simply reading back answers it was given. Park et al. followed exactly this discipline, testing agents only on held-out items.
Check variance, extremes and subgroups, not just averages
Compare the full distribution of answers, not only the mean. Check the share of extreme answers (1s and 5s), the standard deviation and whether the ranking of segments matches. Then re-run a regression or cross-tab you trust on both datasets and count how many relationships agree in size and direction, as Bisbee et al. did.
Mean absolute error (MAE) = average over answer options of |synthetic share − real share|
Total variation distance (TVD) = ½ × sum over answer options of |synthetic share − real share|
Normalised accuracy = synthetic-vs-real agreement ÷ real test-retest agreement
Variance ratio = variance of synthetic answers ÷ variance of real answers (flag if below 0.7)
The variance-ratio threshold of 0.7 is a Henkan & Partners rule of thumb, not a published standard; pick a threshold before you look at results and keep it fixed. Normalised accuracy follows the logic of Park et al.: real people do not answer consistently either, so compare the panel with human test-retest consistency, not with perfection.
Test stability over time and across model versions
Run the same back-test twice, a few weeks apart, and again whenever the underlying model changes. Record the model name and version with every output. Bisbee et al. found material changes after a single update, so stability is not something to assume.
Worked example (illustrative)
The following example is illustrative; the figures are invented to show the method, not taken from a client.
A fashion retailer wants to use a grounded synthetic panel to screen delivery-promise messages. It back-tests on last spring's post-purchase survey, where 1,200 real customers rated five delivery attributes. The synthetic panel gets the ranking of the top three attributes right and the average importance within 4 points on a 100-point scale, a good MAE. But the variance ratio is 0.45, and it misses that customers aged 55 and over rate free returns far higher than everyone else. Verdict: usable for ranking messages for the core segment, not for anything segment-specific. The team screens twelve messages down to three with the panel and then runs an A/B test on the product page, which is the only step that tells them what the change is worth.
| Check | How | Pass signal (Henkan & Partners rule of thumb) |
|---|---|---|
| Ranking | Rank answer options or concepts on both datasets | Top three agree; rank correlation above 0.7 |
| Level | MAE or TVD per question | Within 5 points on most questions |
| Spread | Variance ratio, share of extreme answers | Variance ratio 0.7 or more; extremes present |
| Subgroups | Repeat checks for each segment you plan to use | Same direction for every segment you will report |
| Relationships | Same regression or cross-tab on both datasets | Most coefficients agree in sign and significance |
| Stability | Repeat after weeks and after model changes | Results within the thresholds above |
Section 8 · Workflow
Put synthetic users upstream of real research and A/B tests, never in place of them
The most productive way to use synthetic users is as a fast filter at the front of a research and experimentation programme. They increase the number of ideas you can consider and improve the quality of the questions you ask real people. Real research and controlled experiments remain the decision-makers.
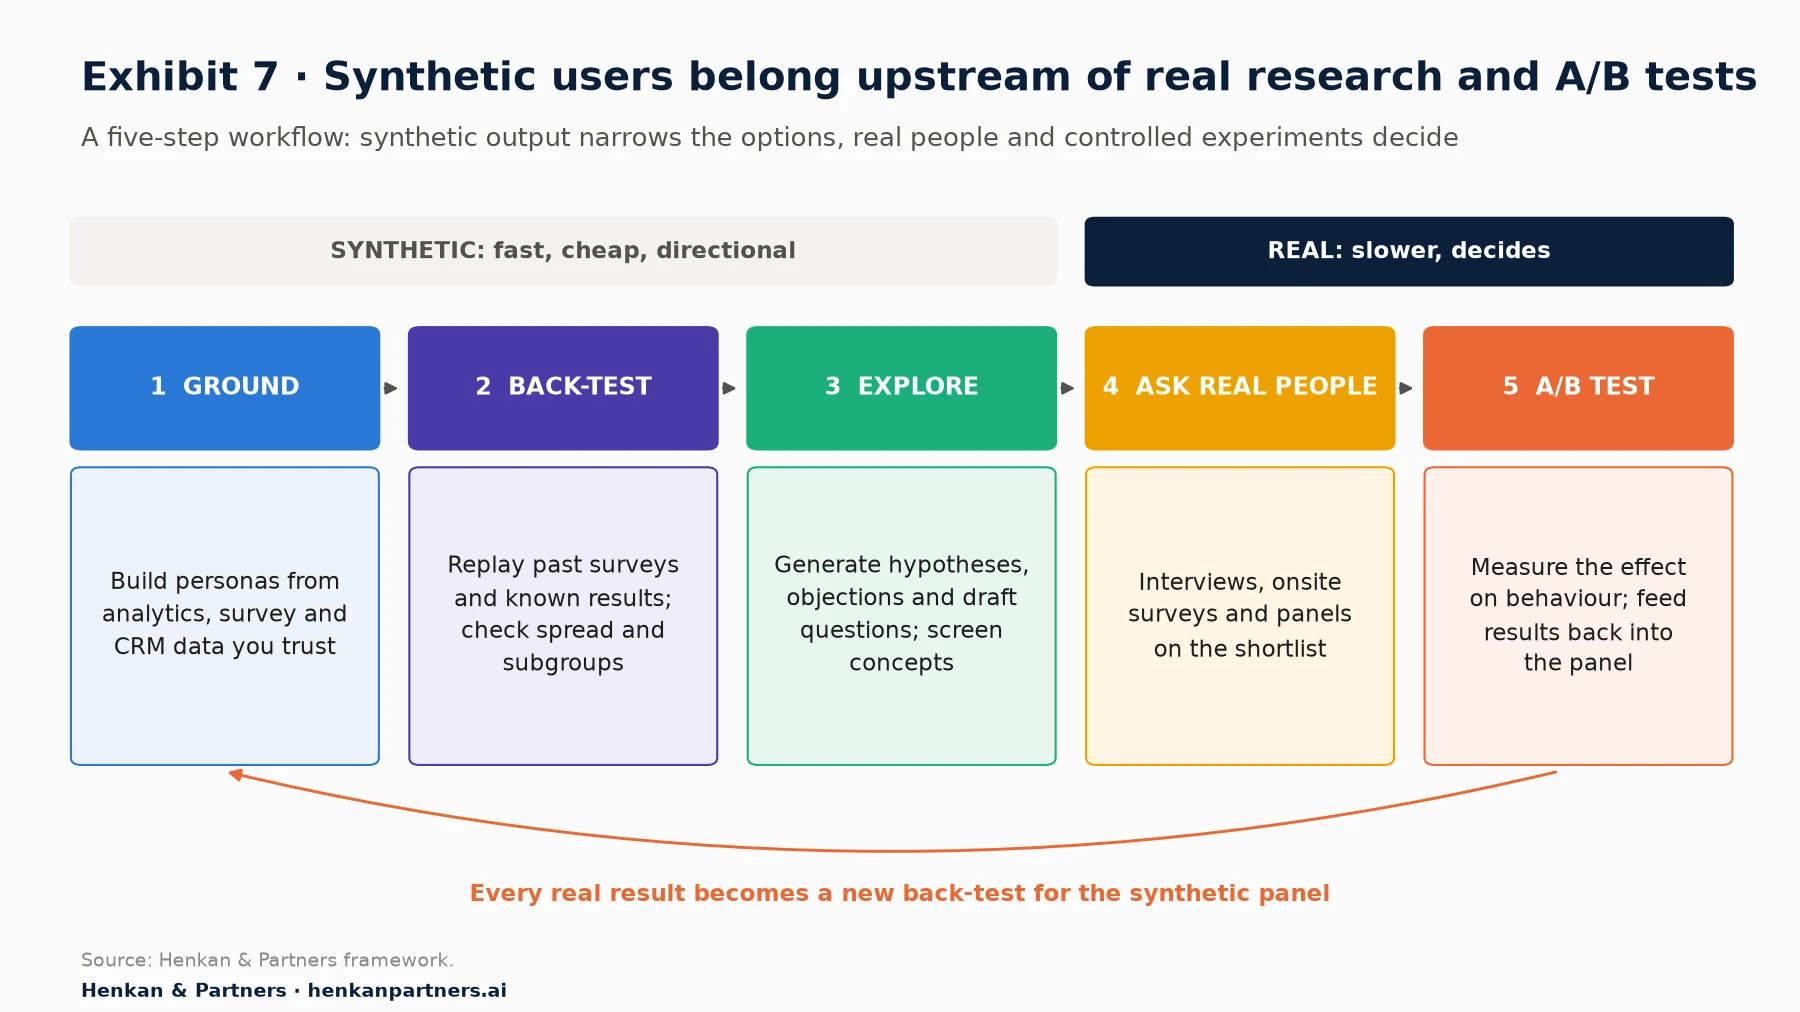
What this shows. The first three steps are synthetic: build personas from data you trust, prove they reproduce known results, then use them to explore. The last two are real: ask people, then test behaviour with a controlled experiment. The feedback loop is the part most teams skip. Every onsite survey and every A/B test result is a fresh back-test that tells you whether the panel is still worth listening to.
- Ground. Build personas from segments you can see in your analytics and describe with your own survey and review data. Our Voice of Customer guide covers the sources, and analysing surveys with LLMs covers turning verbatims into structured data a persona can use.
- Back-test. Run the checks in Section 7 on questions like the ones you plan to ask.
- Explore. Use the panel to widen and then narrow the option set: objections, messages, questions, concepts. Record every output as a hypothesis with its source and model version.
- Ask real people. Take the shortlist to interviews, an onsite survey or a panel. Keep the synthetic predictions to compare against.
- Test behaviour. Build the leading ideas as variants and A/B test them. Prompt-based experimentation now makes building variants much faster, which makes a fast front-end filter more valuable.
AI agents make this loop easier to automate. A panel exposed through the Model Context Protocol (MCP), the open standard that lets AI assistants call external tools, can be queried by the same assistant that drafts survey questions or builds test variants. Our article on AI agents in the experimentation workflow shows where such agents fit today. That convenience is also a risk: the more seamlessly synthetic answers flow into planning documents, the easier it becomes to forget they are synthetic. Label them at source. Our C-level agenda for prompt-based experimentation discusses the governance side.
For marketers. A good week with synthetic users looks like this: Monday, generate 40 candidate objections to your new returns policy; Tuesday, cut them to 8 with a back-tested panel; Wednesday, put the 8 in an onsite survey; the following fortnight, A/B test the top 2 fixes. The synthetic step saved days, and the decisions still rest on real customers.
Section 9 · Ethics
Label synthetic output as synthetic, every time it travels
The ethical questions around synthetic users are practical, not abstract. Most of them come down to people mistaking simulated answers for real ones.
- Disclose in every deliverable. Every chart, quote and finding produced by a synthetic panel should say so, including the model and date. Nielsen Norman Group recommends never presenting synthetic findings as real research. A synthetic "quote" pasted into a slide without a label is, in effect, a fabricated customer quote.
- Do not use synthetic samples to represent people who were not asked. Wang et al. show that models misportray and flatten identity groups. Using synthetic personas to "include" under-represented customers can make their exclusion worse while appearing to fix it.
- Respect the data behind grounded personas. Personas built from CRM records, support tickets or interview transcripts use personal data. Check that your privacy notice and lawful basis cover this use, minimise and aggregate the data, and never let a persona reproduce identifiable details of a real customer.
- Be careful with individual twins. A digital twin of a specific person is a model of that person. Build one only with explicit consent for that purpose.
- Watch for misuse. Argyle et al. themselves warned that models with high algorithmic fidelity could be used for misinformation, manipulation and fraud. Simulating how people respond to persuasion is dual-use.
- Guard against self-confirmation. A sycophantic panel queried by a team that already likes an idea will usually confirm it. Ask for the strongest objections, not for reactions.
Our view. A simple house rule works: synthetic output may inform what you ask or test, but may never be cited as the reason for a decision on its own. If a slide says "customers prefer", a real customer must have said or done it.
Section 10 · Mistakes
Seven mistakes turn a useful tool into a source of false confidence
- Treating averages as validation. A panel that matches the mean can still get spread, subgroups and relationships wrong. Always check all four.
- Asking for numbers directly. Direct 1-to-5 ratings cluster in the middle. Ask for reasons in words, or use a scoring method that has been validated.
- Using synthetic answers as effect sizes. "The panel says conversion will rise 8%" is not a forecast. Run the experiment.
- Skipping the back-test. Without a comparison with known results, you cannot tell insight from confident invention.
- Ignoring model changes. Record model versions and re-test after updates; results can move without warning.
- Using synthetic users for the customers you understand least. New markets, new categories and minority segments are where synthetic users are least reliable and where real research is most needed.
- Letting outputs lose their label. Once a synthetic finding is pasted into a deck without a source line, it becomes indistinguishable from evidence.
Section 11 · Next steps
What to do next
1. List the questions you would ask a synthetic panel
Write down the ten research questions your team faces this quarter and place each on the matrix in Exhibit 6. In our experience, such a list often splits roughly into thirds: good candidates, questions that need a back-test first, and questions that should never go near a synthetic panel.
2. Gather your back-test data
Collect three to five past surveys, concept tests or A/B tests with known results and with questions similar to your planned uses. This is your test set. If it does not exist, start collecting it with your next onsite survey.
3. Run a small, pre-registered pilot
Choose one tool or approach, fix the success thresholds in writing before running it (Exhibit E), and run the back-test. Judge it on spread and subgroups as well as averages. Share the result, including if it fails.
4. Wire it into your research and testing loop
If the pilot passes, use the panel upstream of real research and A/B tests, as in Exhibit 7. Feed every real result back as a new back-test, and agree a labelling rule for synthetic outputs.
5. Get an independent view
If you want help designing a back-test, grounding personas in your own analytics and survey data, or connecting synthetic exploration to a live experimentation programme, talk to us. We will tell you where the evidence says it will not work, too.
FAQ
Frequently asked questions about synthetic users
Frequently asked questions
What are synthetic users?
Synthetic users are simulated research participants generated by a large language model. Each is given a profile, such as demographics, attitudes or real behavioural data, and asked to answer surveys, take part in interviews or react to ideas as a real customer might. Their answers are predictions, not measurements.
What is the difference between synthetic users, synthetic respondents and synthetic personas?
Synthetic respondents usually means simulated answer sets to a structured survey. Synthetic personas are named characters you can question repeatedly, often in interviews. Synthetic users is the umbrella term used by product and UX teams. Digital twins are simulations of one specific real person built from that person's own data.
What is silicon sampling?
Silicon sampling, a term introduced by Argyle et al. in 2023, means conditioning a language model on the demographic backstories of real survey respondents so that the resulting synthetic sample mirrors a real population. With GPT-3 it reproduced US vote choice with correlations of 0.90 to 0.94, but poorly for independents.
How accurate are AI personas compared with real customers?
It depends on grounding and the question. Stanford agents built from two-hour interviews reproduced people's survey answers about 85% as accurately as people reproduced their own answers two weeks later. Demographics-only agents reached 74%. Other studies found synthetic answers with too little variance and wrong relationships, so averages are more reliable than details.
Can synthetic users replace A/B testing?
No. A synthetic panel can help you choose which ideas to test and improve the variants, but it cannot measure how much a change moves real behaviour. Only a controlled experiment with real traffic does that.
Can LLM user research be used for pricing?
Only as an early, directional input. In Brand, Israeli and Ngwe's study, a GPT conjoint came close to a real willingness-to-pay figure for fluoride toothpaste but was about half the real value for aluminium-free deodorant. Set prices with real price tests and experiments.
How do you validate a synthetic panel?
Back-test it against past surveys or tests with known results, hold out questions the panel has not seen, compare full distributions and subgroups rather than averages, check whether relationships between variables agree, and repeat after model updates. Fix pass thresholds before you run the test.
Is it ethical to use synthetic respondents?
Yes, if outputs are clearly labelled as synthetic, never presented as real customer evidence, not used to speak for groups who were not asked, and built from personal data only where your privacy basis allows. Individual digital twins need explicit consent.
Which companies sell synthetic user research?
Examples include Synthetic Users, Evidenza, Aaru, Electric Twin, Qualtrics synthetic panels and Toluna Synthetic Personas. Their accuracy claims are vendor data measured with different metrics, so run your own back-test before comparing them.
Key terms
- Synthetic users
- LLM-generated stand-ins for research participants. They matter because they make research fast and cheap, but every answer is a prediction, not data.
- Synthetic respondents
- Simulated answer sets to a structured questionnaire. Useful for piloting surveys; risky when treated as a sample.
- Synthetic personas
- Named, described simulated customers you can question repeatedly. Helpful for ideation and interview preparation, prone to stereotyping.
- Digital twin
- A simulation of one specific real person built from that person's own data. The most accurate form, and the most demanding on data and consent.
- Silicon sampling
- Conditioning a model on real respondents' backstories to reproduce a population. It showed that composition matters, and that predictable groups are easier to simulate.
- Algorithmic fidelity
- How closely a model reproduces a subgroup's real response patterns. The core property a synthetic panel must demonstrate before use.
- Grounding
- Supplying a model with real data about the person or segment it simulates. It is the single biggest driver of accuracy in the evidence.
- Retrieval-augmented generation (RAG)
- Fetching relevant records at question time and passing them to the model. The usual way to ground personas in first-party data without retraining.
- Fine-tuning
- Further training a model on examples of real answers. Improves accuracy within known categories but transferred poorly to new ones in published tests.
- Back-testing
- Checking whether a method reproduces results you already know. The most practical way to decide whether to trust a synthetic panel.
- Holdout questions
- Questions deliberately kept out of the grounding data and used only for testing. They stop a panel from simply repeating answers it was given.
- Test-retest consistency
- How consistently real people answer the same question twice. A fair ceiling for judging synthetic accuracy, since humans are not perfectly consistent either.
- Sycophancy
- A model's tendency to agree with or please the user. In research it inflates enthusiasm for concepts and hides objections.
- Hyper-accuracy distortion
- Aligned models answering knowledge questions more correctly than real people would. It makes personas unrealistically well-informed.
- Conjoint analysis
- A choice-based method that infers the value of product attributes from trade-offs. Gave far better synthetic willingness-to-pay estimates than asking directly.
Sources
All sources were checked in September 2026. Vendor descriptions and accuracy figures for Synthetic Users, Evidenza, Aaru, Electric Twin, Qualtrics and Toluna are vendor data taken from the vendors' own websites or, for Qualtrics, as reported by diginomica; they are not independently verified and use different metrics. Park et al. (2024), Horton (2023), Gui and Toubia (2023), Maier et al. (2025), Toubia et al. (2025), Santurkar et al. (2023) and Sharma et al. (2023) were read on arXiv; Park et al. was revised in 2026 and we report both the original and revised figures. The Hewitt et al. figures are taken from the authors' project site. Exhibits 1 to 5 show sourced data. Exhibits 6 and 7, Exhibits B, D and E, the validation thresholds and the worked example are Henkan & Partners frameworks; the worked example is illustrative.
- Argyle, L. P., Busby, E. C., Fulda, N., Gubler, J. R., Rytting, C. & Wingate, D. (2023). Out of One, Many: Using Language Models to Simulate Human Samples. Political Analysis 31(3). Preprint: arXiv 2209.06899.
- Horton, J. J., Filippas, A. & Manning, B. S. (2023). Large Language Models as Simulated Economic Agents: What Can We Learn from Homo Silicus? arXiv.
- Aher, G., Arriaga, R. I. & Kalai, A. T. (2023). Using Large Language Models to Simulate Multiple Humans and Replicate Human Subject Studies. ICML 2023.
- Brand, J., Israeli, A. & Ngwe, D. (2023, revised 2024). Using LLMs for Market Research. Harvard Business School Working Paper 23-062.
- Marketing Science Institute (2023). Using GPT for Market Research, MSI Report 23-131.
- Park, J. S. et al. (2024, revised 2026). Generative Agent Simulations of 1,000 People. arXiv.
- Bisbee, J., Clinton, J. D., Dorff, C., Kenkel, B. & Larson, J. M. (2024). Synthetic Replacements for Human Survey Data? The Perils of Large Language Models. Political Analysis 32(4).
- Santurkar, S., Durmus, E., Ladhak, F., Lee, C., Liang, P. & Hashimoto, T. (2023). Whose Opinions Do Language Models Reflect? arXiv.
- Wang, A., Morgenstern, J. & Dickerson, J. P. (2025). Large language models that replace human participants can harmfully misportray and flatten identity groups. Nature Machine Intelligence.
- Sharma, M. et al. (2023). Towards Understanding Sycophancy in Language Models. arXiv.
- Gui, G. & Toubia, O. (2023). The Challenge of Using LLMs to Simulate Human Behavior: A Causal Inference Perspective. arXiv.
- Hewitt, L., Ashokkumar, A., Ghezae, I. & Willer, R. (2026). Predicting results of social science experiments using large language models. Project site.
- Maier, B. F. et al. (2025). LLMs Reproduce Human Purchase Intent via Semantic Similarity Elicitation of Likert Ratings. arXiv.
- Toubia, O. et al. (2025). Twin-2K-500: A dataset for building digital twins of over 2,000 people. arXiv.
- Nielsen Norman Group (2024). Synthetic Users: If, When, and How to Use AI-Generated "Research".
- Synthetic Users (2026). Synthetic Users, Science and Pricing. Vendor data.
- Evidenza (2026). Evidenza. Vendor data.
- Aaru (2026). Aaru. Vendor data.
- TechCrunch (2025). AI synthetic research startup Aaru raised a Series A at a $1B headline valuation.
- Electric Twin (2026). Electric Twin. Vendor data.
- diginomica (2026). Qualtrics X4: new CEO Jason Maynard declares the insight gap closed.
- Toluna (2026). Toluna Synthetic Personas and Toluna home page. Vendor data.