Guide
The Essential Guide to Voice of Customer (VoC)
Alexandre Suon · 2026-09-26
Analytics shows where customers struggle. Voice of Customer (VoC) research tells you why. A/B testing proves which fix works. This guide explains how to collect, analyse and act on what customers say: the methods and metrics, an 8-step process, how to write questions and size samples, how to use AI safely, and how to connect feedback to your analytics and experimentation programme.
Executive summary
- Voice of Customer is the systematic practice of capturing what customers say, in their own words, and turning it into decisions. The term comes from Japanese quality management and was popularised by a 1993 study showing that 20–30 customer interviews uncover 90–95% of customer needs.
- VoC is most valuable when it sits between analytics and testing. Analytics finds the drop-off, VoC explains it, and an A/B test proves the fix. Baymard's surveys show why shoppers abandon checkout (extra costs 40%, slow delivery 20%, card-security worries 19%), which no funnel report can show.
- Start from a decision, not a survey. Pick a question you need answered this quarter, choose the method that answers it and decide in advance what you will do with the answer.
- Small, well-targeted surveys beat long, generic ones. Two or three questions shown at the right moment get more complete answers than longer surveys, and far more responses than badly timed pop-ups. Wording and order can move answers by 10 points or more.
- Know how much your numbers can move by chance. With 100 answers, a percentage has a margin of error of about ±10 points, and a Net Promoter Score typically ±15 or more. Size your sample before you report a trend.
- Use AI to read, humans to decide. Large language models now code open-text answers almost as accurately as trained human coders on clear themes. But AI-simulated "synthetic respondents" understate how much people differ, so use them for ideas, never as evidence.
Section 1 · The basics
What is Voice of Customer?
Voice of Customer (VoC) is the systematic practice of capturing what customers need, expect and experience, in their own words, through surveys, reviews, support conversations, interviews and observation, then analysing that feedback and turning it into decisions about products, services and experiences.
The term was popularised by Abbie Griffin and John Hauser's 1993 paper "The Voice of the Customer" in Marketing Science. It grew out of Quality Function Deployment (QFD), a product-design method whose basic tool, the "house of quality", originated in 1972 at Mitsubishi's Kobe shipyard. In QFD a customer need is "a description, in the customer's own words, of the benefit to be fulfilled by the product or service". That phrase still defines good VoC work: the customer's words, not the company's interpretation of them.
Their findings remain practical today: 20–30 one-to-one interviews uncover 90–95% of the needs in a product category; two one-hour interviews find about as many needs as one two-hour focus group (51% vs 50%); and several analysts reading the same transcripts find far more than one alone (seven together identified 99%).
VoC overlaps with market research, UX research and customer-experience (CX) management, but its role in a digital team is specific: analytics measures what people do, VoC explains why, and experimentation proves which change causes a better outcome.
Section 2 · Why it matters
Analytics shows where customers struggle, VoC explains why, and testing proves what works
Most digital teams are rich in behavioural data and poor in explanations. A funnel report can show that seven in ten carts are abandoned. It cannot show that shoppers left because delivery costs appeared too late, or because they did not trust the payment page. Those answers only come from asking customers or reading what they already wrote.
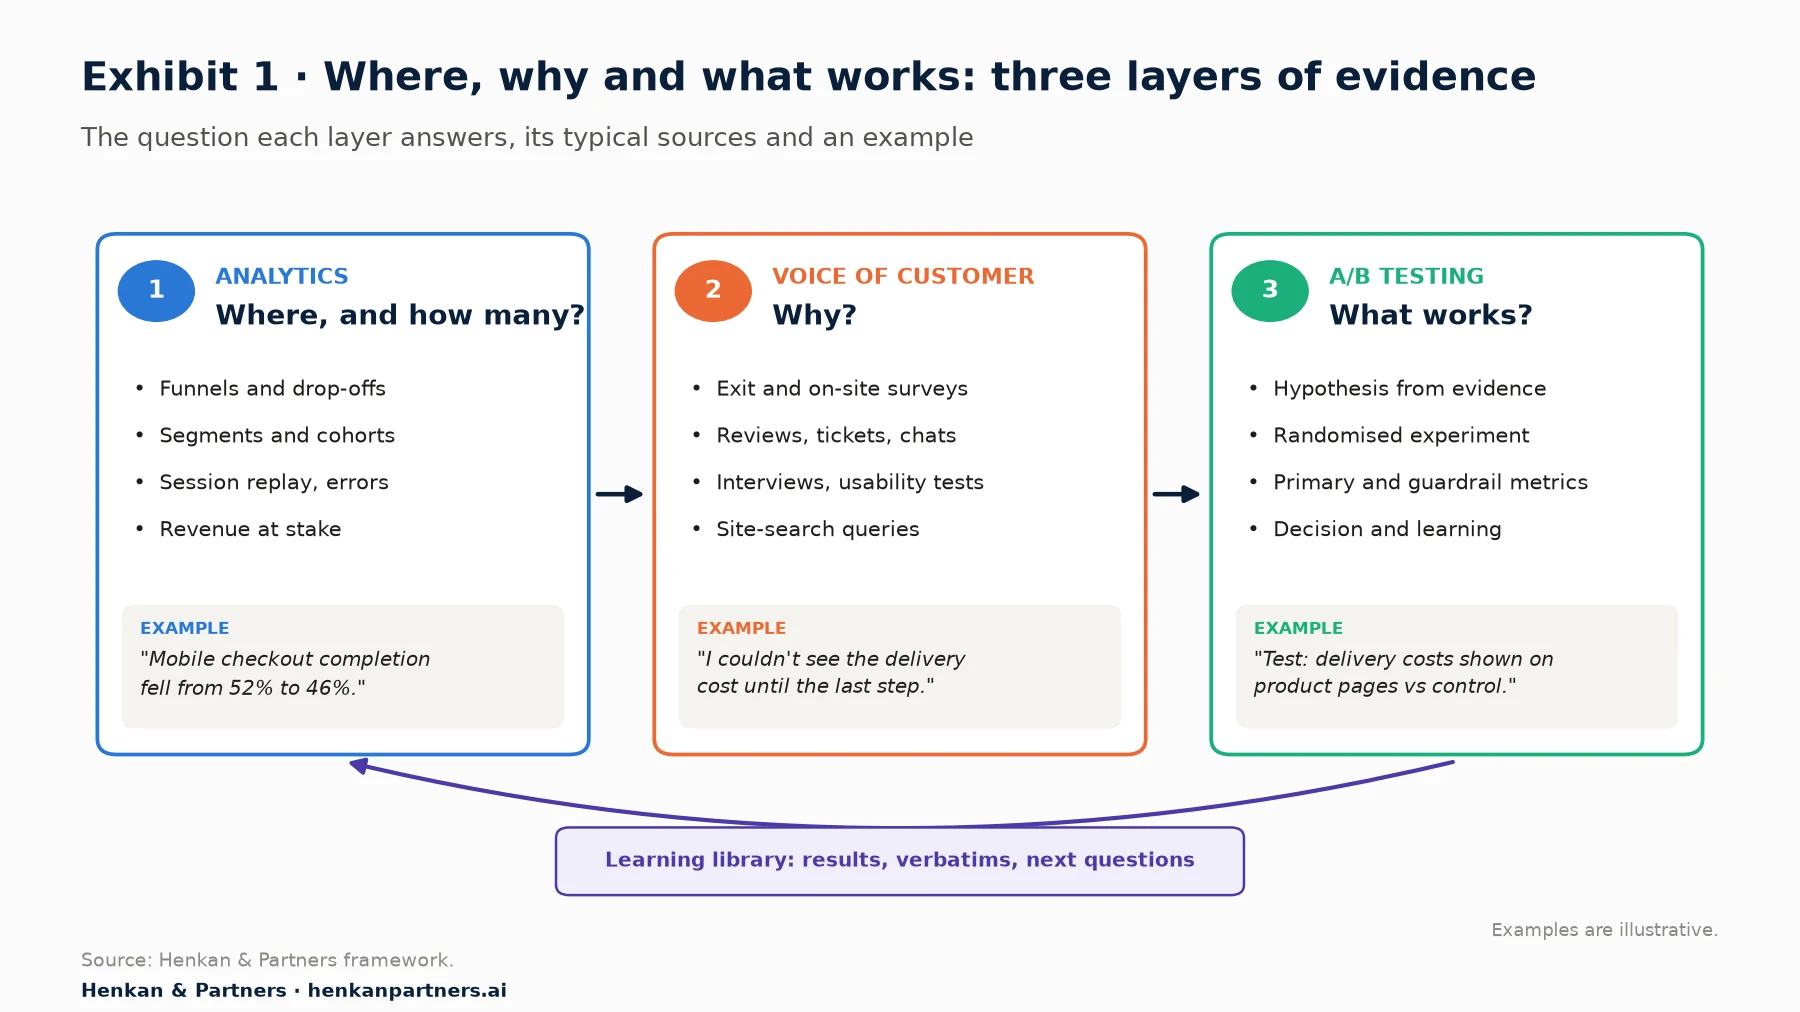
What this shows. Each layer answers a question the others cannot. Analytics without VoC produces guesses about causes. VoC without analytics produces anecdotes with no sense of scale. Neither proves anything without a controlled test. In our experience, teams that connect the three turn customer feedback into revenue, and revenue results into better questions for customers.
Customers already say why they leave
Baymard Institute's long-running research is a good example. Across 50 studies, the average documented cart abandonment rate is 70.22%. In Baymard's survey, 42% of US online shoppers said they had abandoned a cart because they were "just browsing". Excluding those, shoppers named reasons that point straight to fixes:
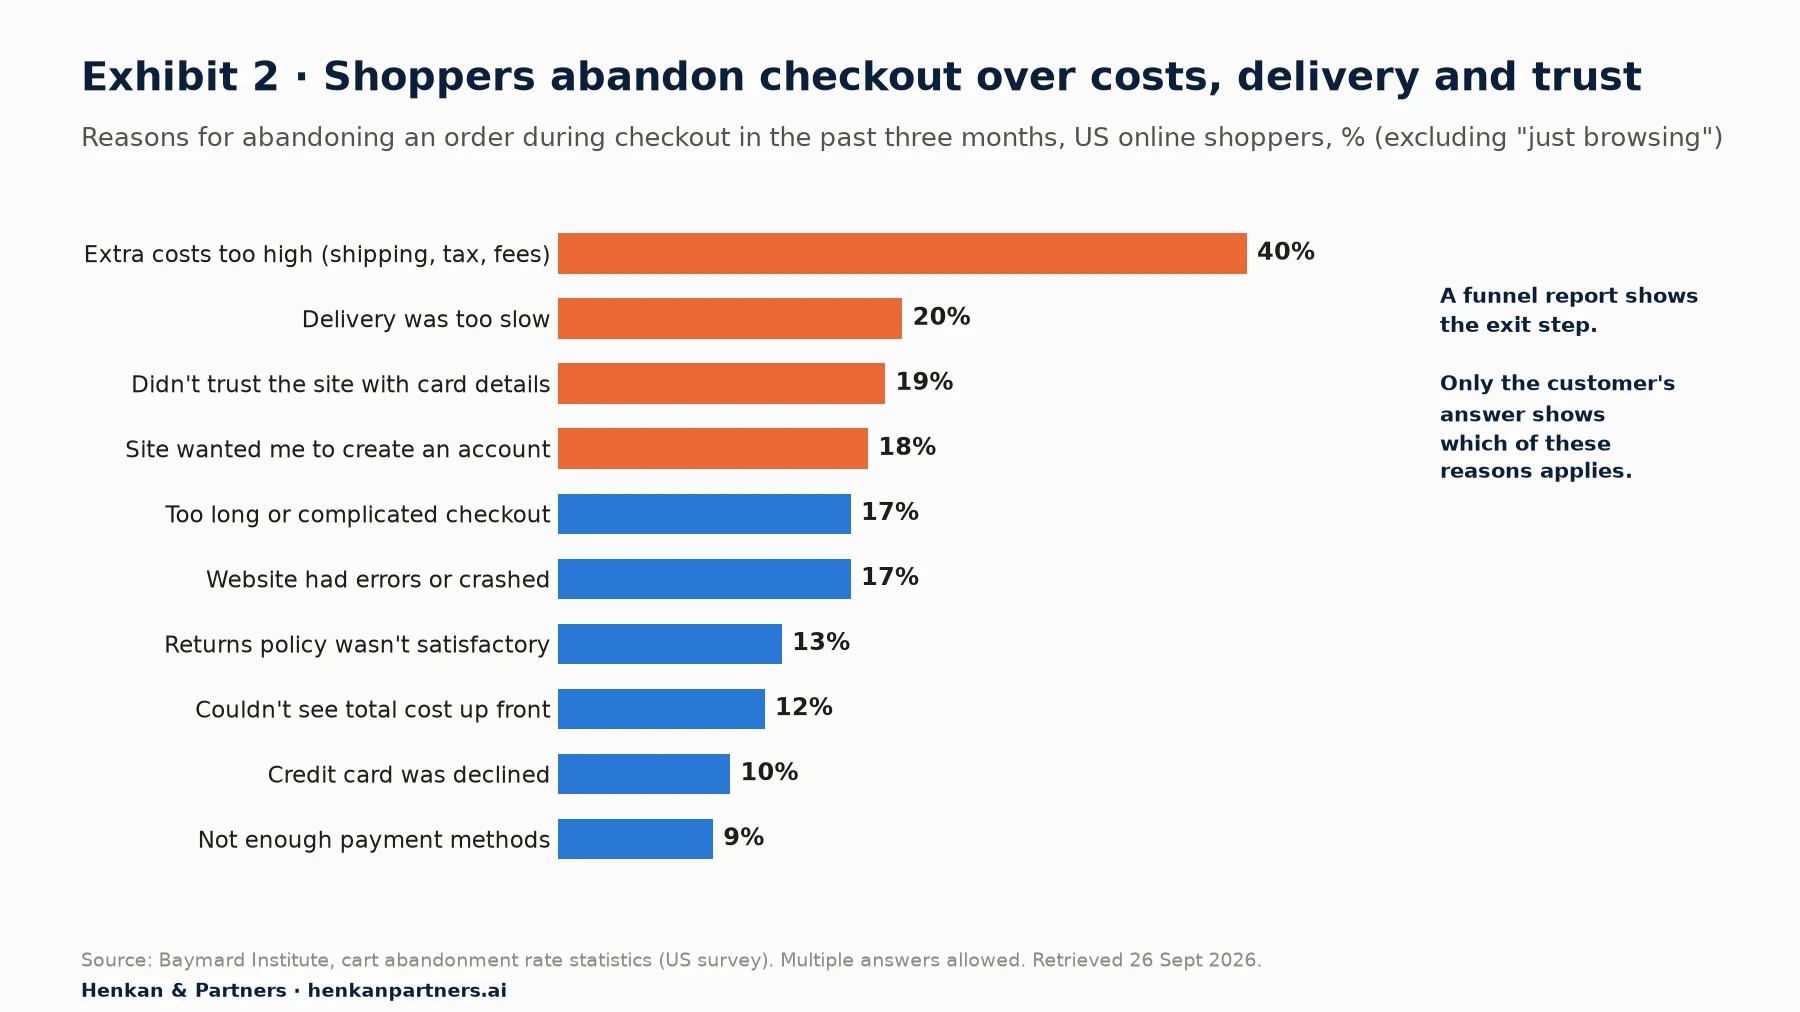
What this shows. Nearly every reason is a worry or an expectation, not a click-path problem. Analytics would show the exit on the shipping or payment step; only the customer's answer tells you whether to change the delivery offer, the trust signals or the account requirement. Your own customers' reasons will differ, which is why you need to ask them.
Why this matters for revenue, and for A/B testing
- Bad experiences cost sales, and most customers stay silent. In Qualtrics XM Institute's 2025 survey of 20,001 consumers in 14 countries, 34% cut their spending with a company after a negative experience, and fewer than one in three consumers gave feedback to companies, an all-time low.
- Most test ideas fail. In an Optimizely analysis of 127,000 experiments, only 12% produced a statistically significant improvement on their primary metric. At Microsoft (2009), about one third of ideas improved the metrics they were designed to improve. In our experience, customer evidence is the most reliable source of better test ideas.
- What people say and what they do differ. A review of 10 meta-analyses (422 studies) found that intentions explained only 28% of the variance in behaviour. So read VoC next to behaviour and check it with tests.
- Retention is where experience pays off. Frederick Reichheld's research at Bain, summarised by Harvard Business Review in 2014, found that increasing customer retention rates by 5% increased profits by 25% to 95% in the industries studied. The figures are old and industry-specific, but the logic still holds.
For marketers. Before you design your next A/B test, find at least one piece of customer evidence behind it: a survey answer, a review, a ticket or a replay. If you cannot, you are testing an opinion.
For leaders. Ask your team to show, for every major test or roadmap item, which customer problem it solves and how many customers or how much revenue that problem affects. That single question connects VoC to the P&L.
Section 3 · Methods
The VoC toolkit: ask, observe and read what customers already wrote
VoC methods differ on two dimensions. The first is who starts the conversation: you (solicited feedback, such as a survey) or the customer (unsolicited feedback, such as a review or a complaint). The second is whether you capture what people say or what they do. Good programmes combine methods from different corners, because each has blind spots.
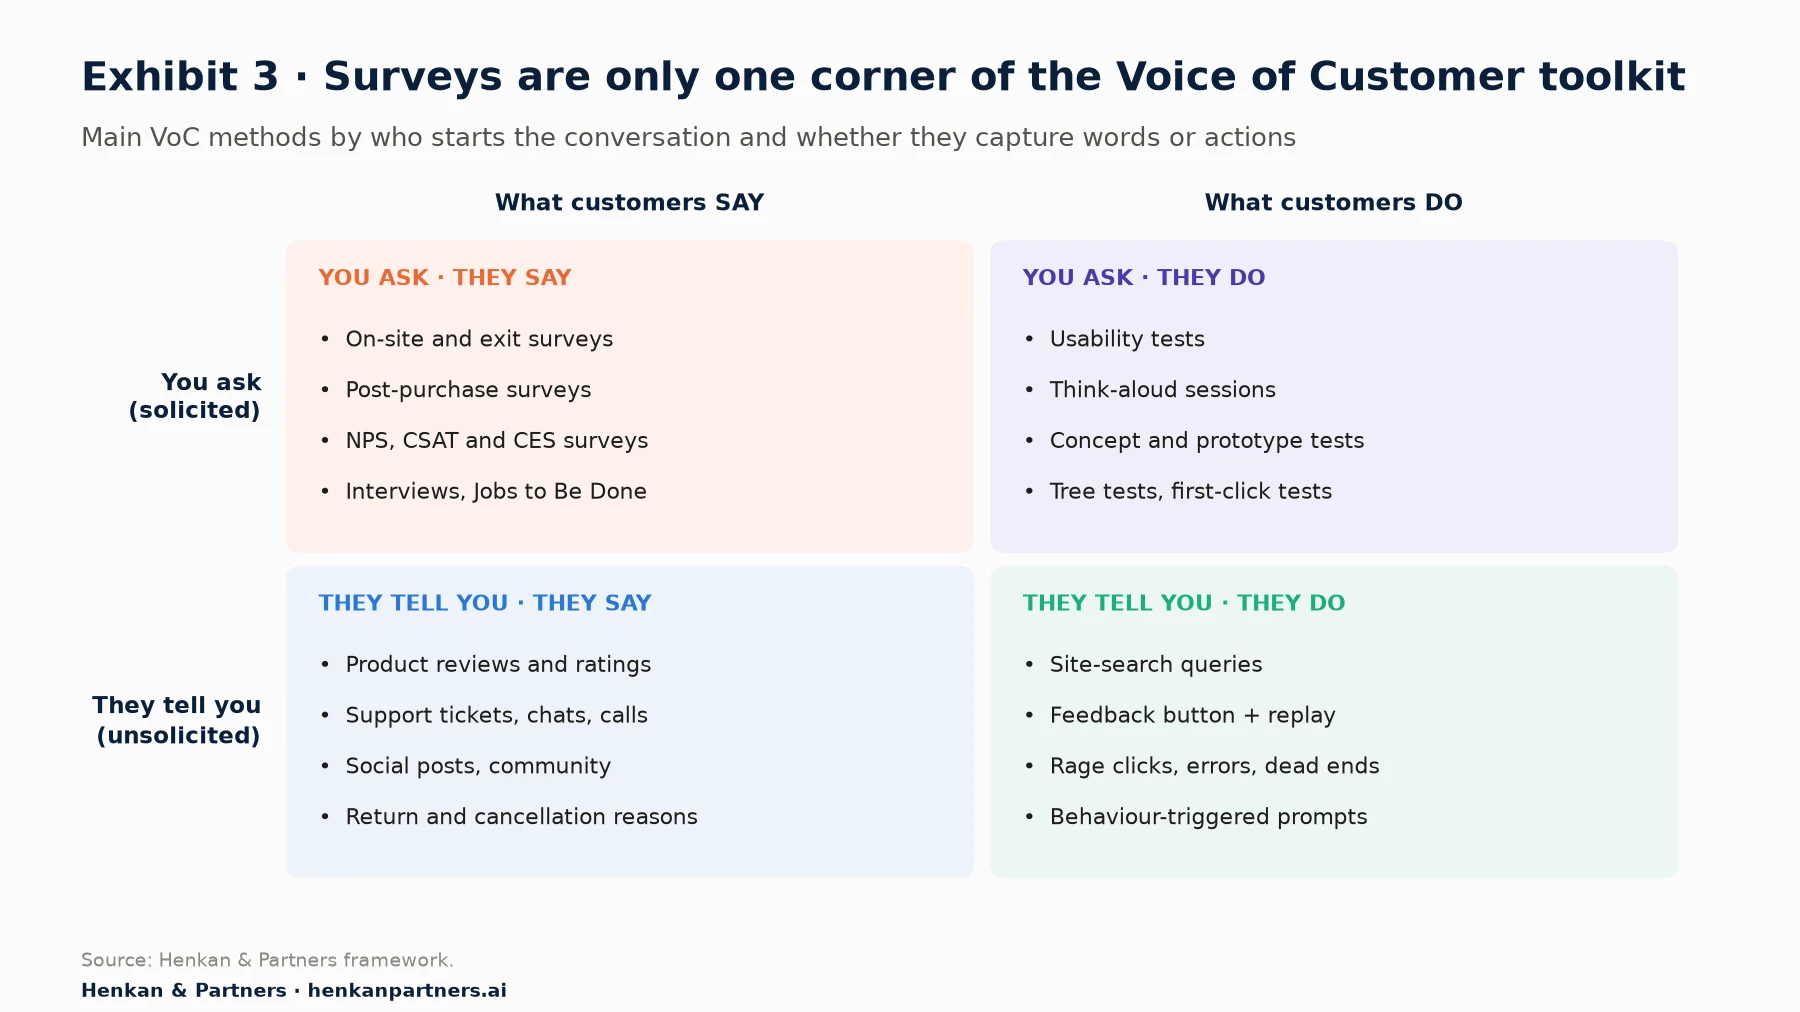
What this shows. Surveys and interviews (top left) are the methods most people think of, but they are only one corner. Unsolicited feedback (bottom half) is often larger, cheaper and more candid, and it already exists in your helpdesk, reviews platform and site search. Observation methods (right) reveal problems people do not notice or cannot describe.
| Method | Best for | Strengths | Watch out for |
|---|---|---|---|
| On-site or in-app survey | Why visitors hesitate or leave a specific page | In the moment; can be linked to behaviour and replays | Intrusive if badly timed; low response on pop-ups |
| Exit survey | Why people abandon cart, checkout or sign-up | Direct reasons for the biggest drop-offs | Only reaches people who see it before leaving |
| Post-purchase survey | Why people bought, what nearly stopped them | High response; buyers are motivated | Misses those who did not buy |
| NPS, CSAT or CES survey | Tracking loyalty, satisfaction or effort over time | Comparable scores; good for trends and alerts | A score without verbatims does not say what to fix |
| Reviews and ratings | Product fit, quality, sizing, expectations | Large volume; public; also influences buyers | Selection bias towards very happy and very unhappy |
| Support tickets, chats and calls | What goes wrong after purchase | Rich detail; already collected | Unstructured; needs coding or AI analysis |
| Site-search queries | What people look for and cannot find | Customers' own words, at scale | Needs regular review; not a survey |
| Customer interviews | Motivations, context, decision process | Depth; uncovers unknown needs | Small samples; interviewer skill matters |
| Usability tests | Whether people can complete key tasks | Shows problems people cannot describe | Artificial setting; small samples |
| Jobs to Be Done (switch) interviews | Why people switch to or from you | Reveals the "job" and competing options | Needs recent switchers and a trained interviewer |
Choose the method from the question
Start from the question, not the method ("let's run an NPS survey"):
- "Why do people leave this page?" On-site or exit survey on that page, linked to replays.
- "What do buyers think of our products?" Reviews and return reasons, plus a post-purchase survey.
- "Why do customers contact us or churn?" Support tickets, chats and cancellation reasons, plus a CES survey after contact.
- "What should we build or test next?" Interviews and usability tests, then a short survey to count each finding.
- "Are we getting better or worse over time?" A tracked NPS, CSAT or CES survey with an open question.
The Jobs to Be Done theory, set out by Clayton Christensen and colleagues in Harvard Business Review in 2016, is useful when the question is strategic. It starts from the idea that customers "hire" a product to make progress in a particular circumstance. "Switch" interviews, developed by practitioners such as Bob Moesta, put it into practice by asking what customers used before, what triggered the switch and what nearly stopped them.
Section 4 · Metrics
NPS, CSAT and CES measure different things, and none of them tells you what to fix on its own
Scores make feedback easy to track and report, which is why they dominate VoC dashboards. Each of the three main scores answers a different question, and each needs an open follow-up question ("What is the main reason for your score?") to be useful.
Net Promoter Score (NPS)
NPS was introduced by Frederick Reichheld of Bain & Company in the Harvard Business Review article "The One Number You Need to Grow" (December 2003). It asks, in Bain's current wording: "How likely are you to recommend us to a friend or colleague?" on a 0–10 scale. Respondents who answer 9–10 are promoters, 7–8 passives and 0–6 detractors.
NPS = % promoters (9–10) − % detractors (0–6)
Range: −100 to +100
NPS is simple and widely benchmarked, which makes it popular with boards. Its limits are also well documented. A 2007 study in the Journal of Marketing by Timothy Keiningham and colleagues, using data from 21 firms and more than 15,500 interviews, failed to replicate the claim that NPS is clearly superior to other measures in predicting growth; satisfaction predicted growth about as well. NPS also throws away information (a 6 and a 0 count the same) and moves a lot by chance with small samples (Section 7).
Customer Satisfaction Score (CSAT)
CSAT asks how satisfied a customer was with a specific experience, usually on a 1–5 scale. It is the most direct measure of a single interaction, such as a delivery, a return or a support contact. At national level, the American Customer Satisfaction Index (ACSI), founded in 1994 at the University of Michigan, has tracked satisfaction on a 0–100 scale for three decades.
CSAT = (number of 4 and 5 answers ÷ total answers) × 100
Customer Effort Score (CES)
CES comes from a study of more than 75,000 customers by Matthew Dixon, Karen Freeman and Nicholas Toman of the Corporate Executive Board, published in Harvard Business Review in 2010 as "Stop Trying to Delight Your Customers". They found that exceeding expectations made customers only marginally more loyal, while reducing effort mattered a great deal. After low-effort service, 94% of customers said they intended to repurchase and 88% to spend more; 81% of customers who had a hard time solving their problem intended to spread negative word of mouth. The original question was "How much effort did you personally have to put forth to handle your request?".
| Metric | Question it answers | When to use it | Main limitation |
|---|---|---|---|
| NPS | How loyal are customers to us overall? | Relationship tracking, a few times a year; comparing segments | Noisy with small samples; says little about causes |
| CSAT | How satisfied were they with this experience? | Right after a specific interaction: delivery, return, support | Measures a moment, not loyalty |
| CES | How easy was it to get this done? | After a task: support contact, checkout, return, account change | Less useful for emotional or brand questions |
| Open question | Why did they give that score, and what should we change? | After every score | Needs coding or AI to analyse at scale |
Our view. Pick one score that matches the decision you need to make, ask it at the right moment, and always follow it with an open question. The score tells you whether something changed; the verbatims tell you what to do about it. For e-commerce journeys, CES after checkout, delivery and returns is often more actionable than a company-wide NPS.
Section 5 · The process
How to run a Voice of Customer study in 8 steps
The process works for a two-person team running its first exit survey and for a multi-brand retailer running a continuous programme. Steps 1 and 8 are the ones most teams skip, and they decide whether feedback changes anything.
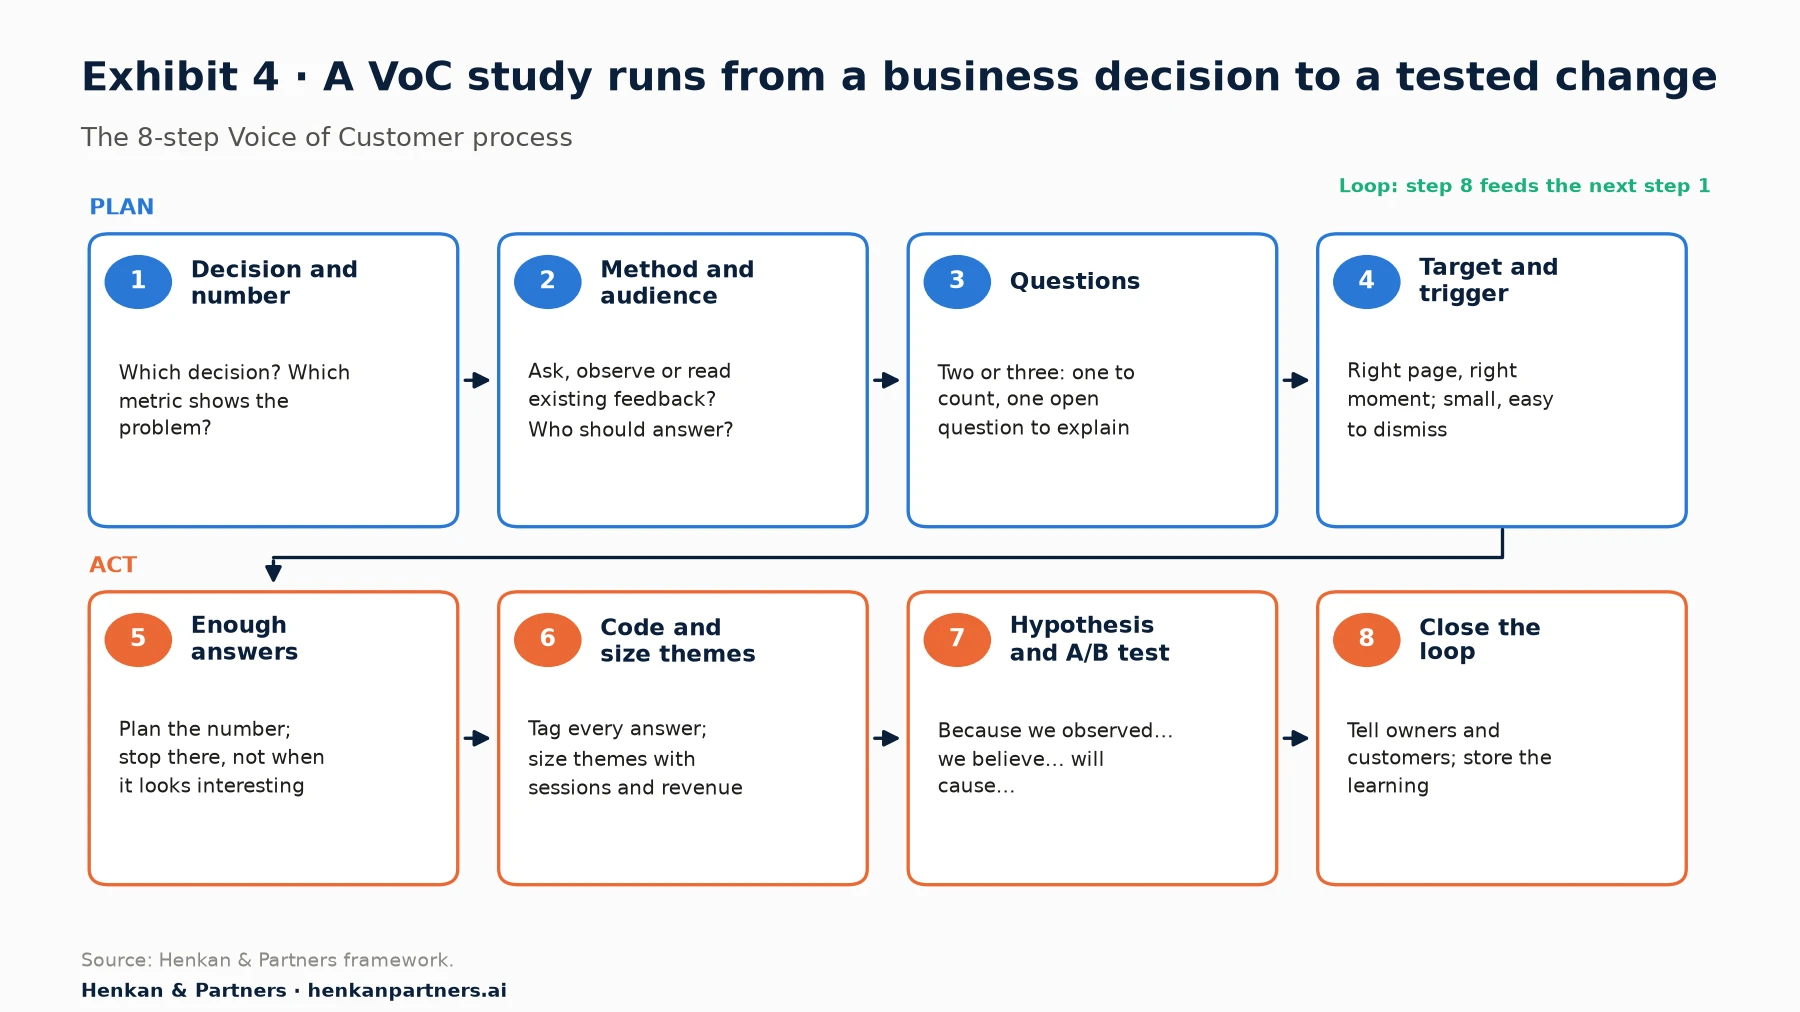
What this shows. VoC is a loop, not a one-off survey. The first four steps make sure you ask the right people the right question at the right moment; the last four make sure the answers become decisions and tests, and that what you learn feeds the next question.
Step 1: Start from a decision and a number
Write down the decision the research should inform and the metric that shows the problem. For example: "Checkout completion on mobile fell from 52% to 46% since the new delivery options launched. We need to decide whether to change the delivery step before peak season." Analytics gives you the number and the place; VoC will supply the reason. If no decision depends on the answer, do not run the study.
Step 2: Choose the method and the audience
Match the question to a method (Section 3), and check first what feedback you already have: reviews, tickets and site-search logs often answer the question before you ask anyone. Then define who should answer (new or returning, mobile or desktop, buyers or non-buyers). The wrong audience gives a confident, wrong answer.
Step 3: Write the questions
Keep an on-site survey to two or three questions: one closed question to count, one open question to understand. Section 6 covers wording and gives a question bank.
Step 4: Target and trigger at the right moment
Show the survey when the experience is fresh and the question makes sense: on exit intent from the cart, after a failed search, on the order confirmation page, or a few days after delivery. Avoid full-screen pop-ups on arrival (Section 10), cap how often one person sees a survey, and exclude people who have already answered.
Step 5: Collect enough answers
Decide in advance how many answers you need (Section 7): a few hundred to count how common a reason is, a few dozen open answers or 12–30 interviews to discover the main reasons. Stop at the planned number, not when the result looks interesting.
Step 6: Code the themes and size them with analytics
Build a short list of themes, tag every answer (by hand, or with AI checked by a human; see Section 8), count each theme, then size it with analytics: the sessions, orders or revenue on the page or segment where it appears. A theme mentioned by 15% of respondents on a page with a million monthly visits matters more than one mentioned by 40% on a page with a thousand.
Step 7: Turn themes into hypotheses and A/B tests
Each important theme should become a hypothesis that names the evidence, the change and the expected effect. Then prove it with an A/B test (see our essential guide to A/B testing).
Because we observed [what customers said, and what analytics shows],
we believe that [change] for [audience]
will cause [effect on customer behaviour].
We will know when [primary metric] moves in an A/B test.
Step 8: Close the loop and store what you learned
Tell the owners of the problem what customers said, and tell customers what changed where you can. Store the finding, verbatims, test and result in one place so nobody asks the same question twice. This learning library is what makes VoC compound over time.
For marketers. Keep a one-page brief for every study: the decision, the metric, the audience, the questions, the target number of answers, and the date you will review the results. It takes ten minutes and prevents most wasted surveys.
For leaders. Measure the VoC programme by the decisions and tests it produces, not by the number of responses collected. A quarterly review of "what customers told us, what we changed, what it earned" keeps the loop honest.
Section 6 · Survey design
Short, neutral, well-timed questions get more answers and more honest ones
On-site surveys compete with the task the visitor came to do, so every question has a cost. Small changes in wording, order and length change both how many people answer and what they say.
Response and completion rates depend on the channel and the length
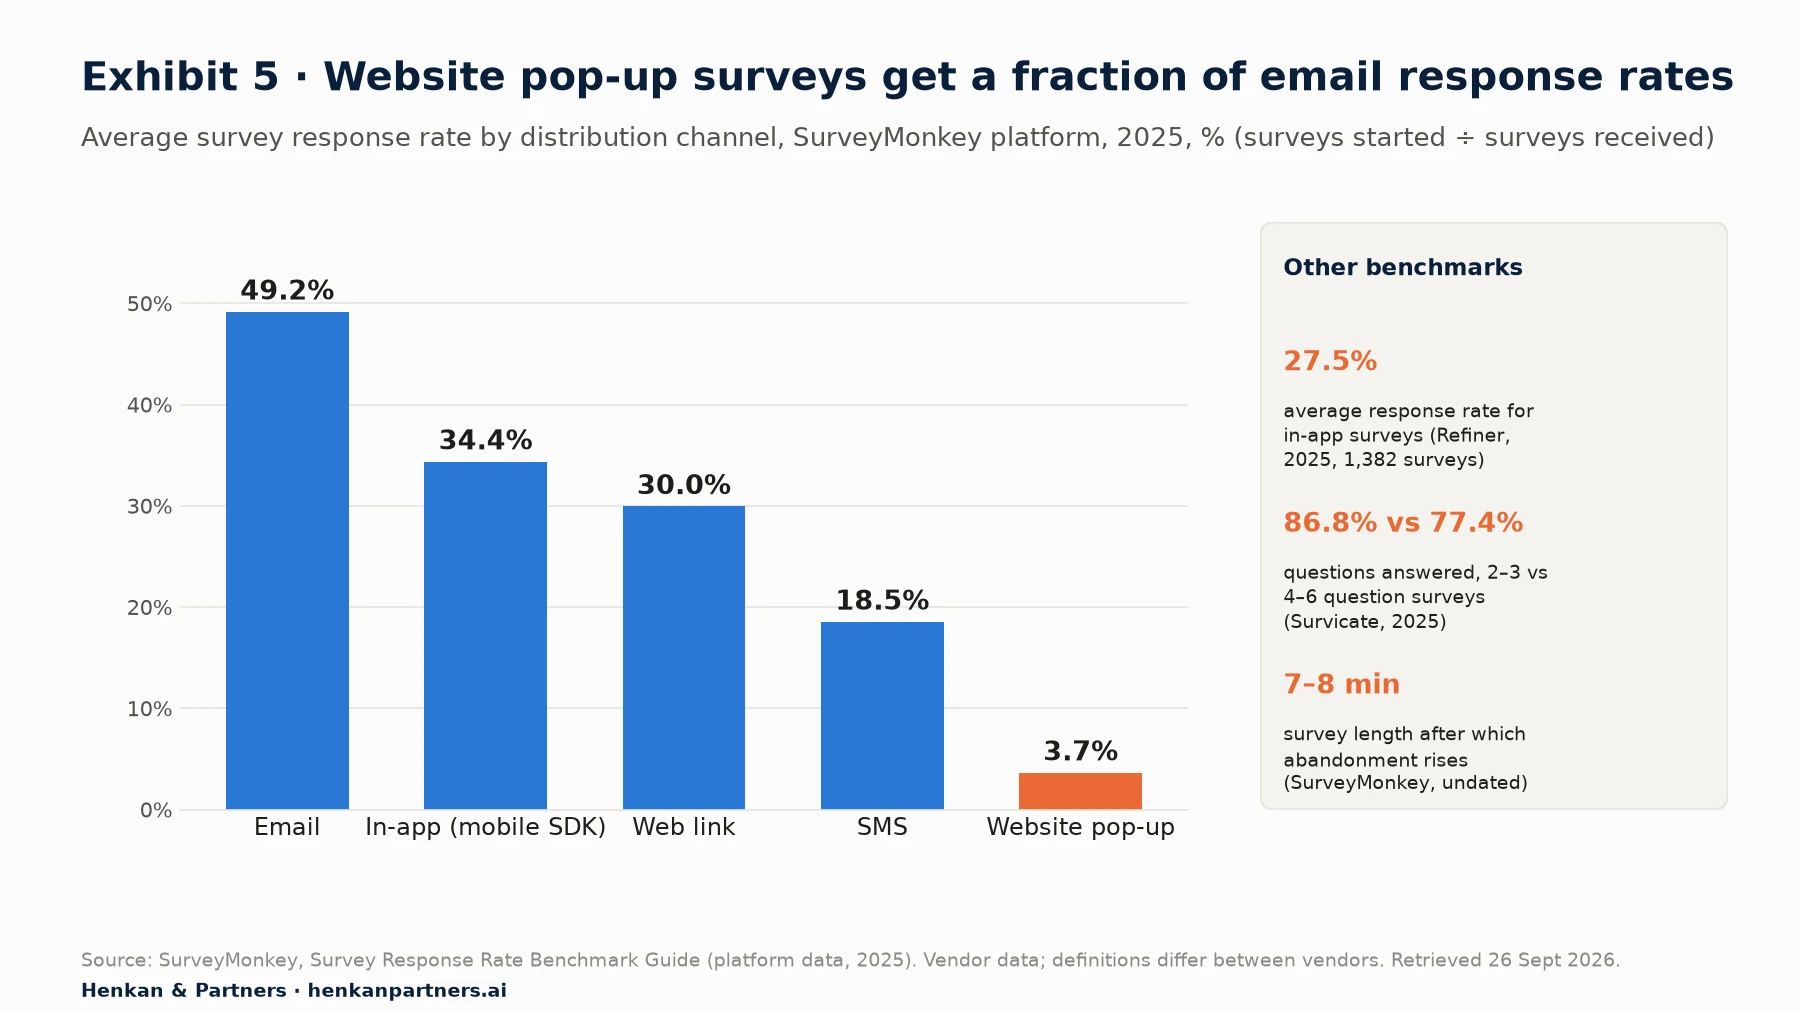
What this shows. People who receive a survey by email or inside an app they chose to use start it far more often than visitors who see a pop-up while shopping. A pop-up's low rate is partly a definition effect, but on-site surveys clearly need traffic, good timing and very few questions. These are one vendor's averages; yours will depend on audience, trigger and design.
Other benchmarks point the same way. In Refiner's 2025 analysis of 1,382 in-app surveys, the average response rate was 27.5%. In Survicate's 2025 benchmark of 8,392 surveys, respondents answered 86.8% of questions on average in 2–3-question surveys, against 77.4% for 4–6 questions (78.8% for 7 or more). An older SurveyMonkey analysis of about 100,000 surveys (undated) found that abandonment rises for surveys that take more than 7–8 minutes.
How to word questions
The Pew Research Center, which runs some of the most careful surveys in the world, has shown how much wording and order matter. In one example, 88% of respondents said they were dissatisfied with the direction of the country when the question came after one about the president's performance, against 78% when it came first. In another, 58% chose "the economy" as the most important issue when it was offered as an option, but only 35% named it when the question was open. Nielsen Norman Group adds practical rules:
- Use neutral language. "How was your checkout experience?" not "How much did you enjoy our new checkout?"
- Ask about the past, not the future. People are poor at predicting their own behaviour. "What nearly stopped you from ordering today?" beats "Would you buy more if we offered free returns?"
- Ask one thing at a time. "How easy and intuitive was the site?" is two questions; the answer tells you about neither.
- Use balanced scales and complete options. Give as many negative as positive options, make choices mutually exclusive, and include "Other (please specify)" and "Not sure".
- Make questions optional and the survey short. End with one optional open question; it is often the most valuable answer.
| Instead of… | Ask… | Why |
|---|---|---|
| "Would you recommend our new checkout?" | "How easy or difficult was it to complete your order today?" (5-point scale) | Neutral, about a real experience, not a prediction |
| "Was the product page clear and helpful?" | "Is anything missing from this page that you need to decide?" (Yes/No, then open text) | One question at a time; finds the gap |
| "Why didn't you buy?" | "What, if anything, is stopping you from completing your order today?" (options plus Other) | Less accusatory; options make it quick |
| "Rate our website from 1 to 10" | "What is the one thing we should improve on this site?" | Actionable; one open question beats a vague score |
An e-commerce question bank
| Moment | Trigger | Closed question | Open follow-up |
|---|---|---|---|
| Product page | After 30–60 seconds or a second visit to the same product | "Do you have all the information you need to decide?" (Yes / No) | "What's missing?" |
| Cart | Exit intent, or a return to the cart without progressing | "What, if anything, is stopping you from checking out today?" (options) | "Anything else we should know?" |
| Checkout | Exit intent on shipping or payment step | "Is anything unclear or worrying on this page?" (Yes / No) | "What is it?" |
| Site search | Zero results, or several searches in one session | "Did you find what you were looking for?" (Yes / No) | "What were you looking for?" |
| Order confirmation | Immediately after purchase | "What nearly stopped you from ordering today?" (options plus Nothing) | "What made you choose us?" |
| After delivery | Email 3–7 days after delivery | CSAT or CES on delivery and product | "What's the main reason for your score?" |
For marketers. Pilot every survey with five colleagues or customers before launch, and read the first 30 answers before you let it run. Confusing questions show up immediately as "?" answers or answers to a different question.
Section 7 · Sample size
With 100 answers a percentage can move 10 points by chance, and an NPS 15 or more
Survey results are estimates. The margin of error tells you how far the true value could be from what you measured. Ignoring it is how teams celebrate or panic over changes that are just noise.
Margin of error (95%) ≈ ±1.96 × √( p × (1 − p) ÷ n )
where p = the proportion measured and n = the number of answers.
Worst case (p = 50%): n = 100 → ±9.8 pts · n = 400 → ±4.9 pts · n = 1,000 → ±3.1 pts
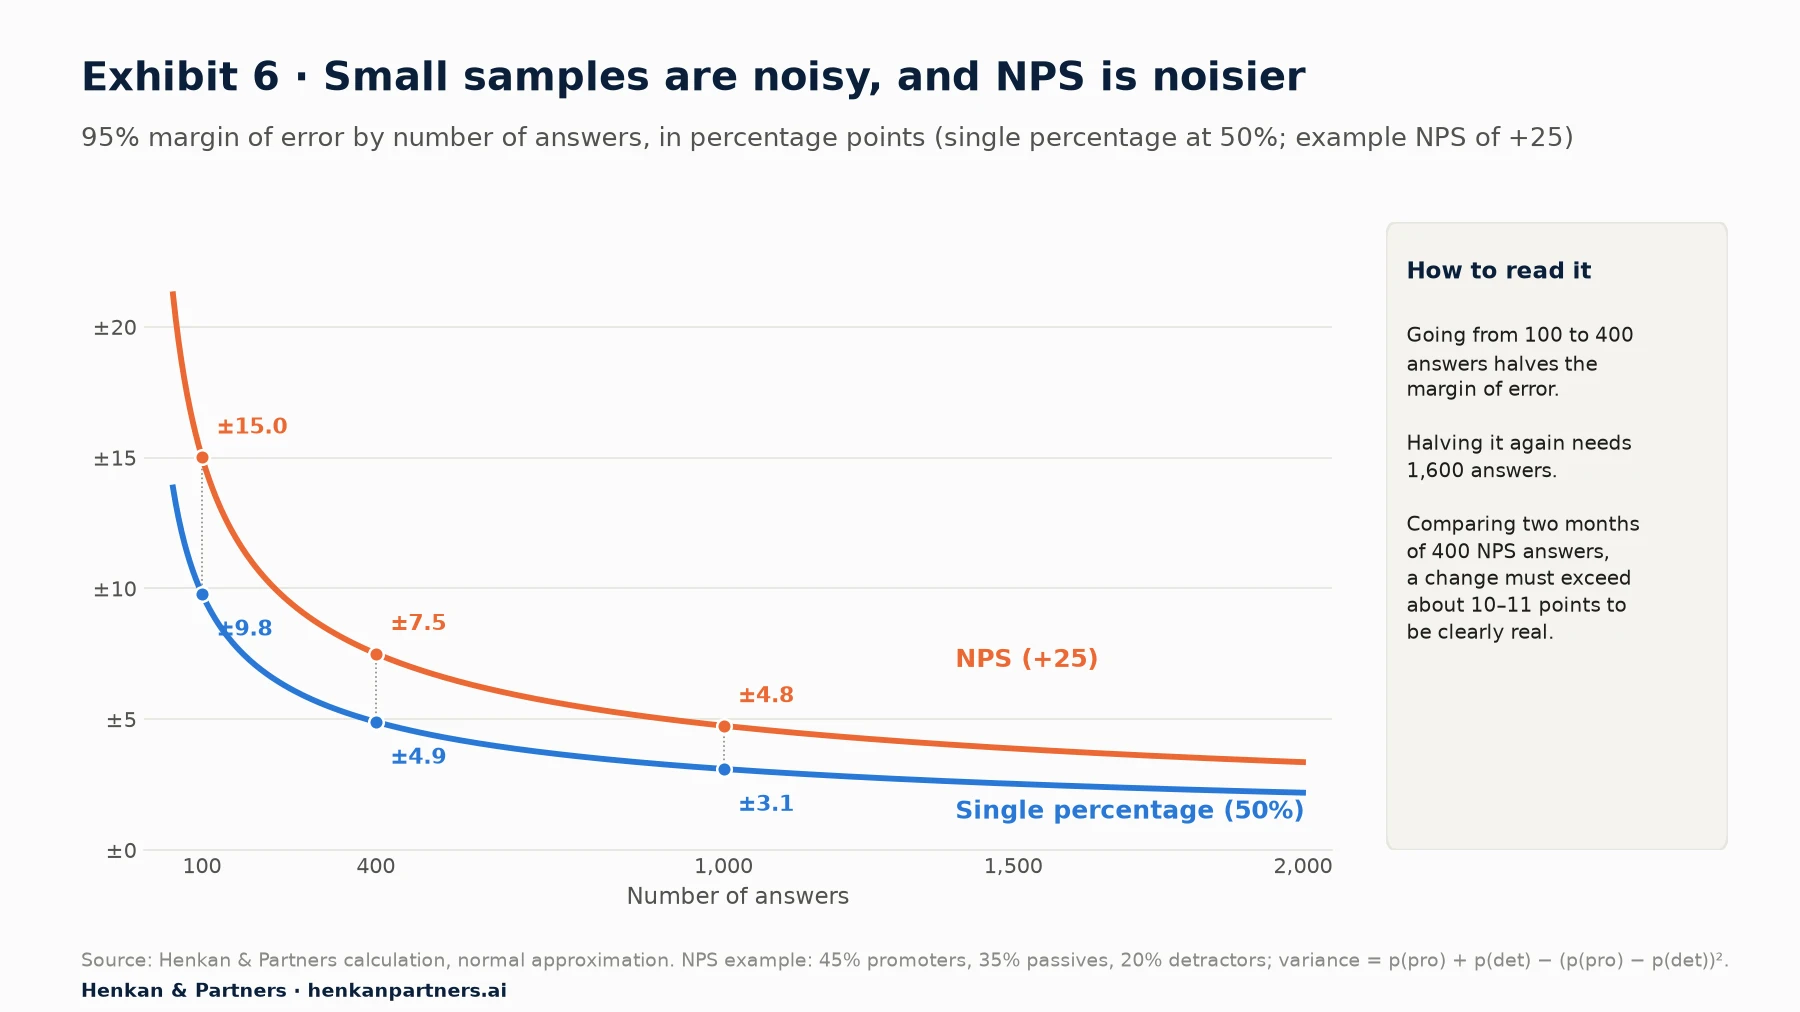
What this shows. Precision improves quickly up to a few hundred answers and slowly after that: going from 100 to 400 answers halves the margin of error, but halving it again needs 1,600. NPS is noisier than a simple percentage because it is the difference of two percentages. With 400 answers a month, a month-on-month NPS change needs to exceed about 10–11 points before you can be reasonably sure it is real.
Rules of thumb for quantitative VoC
- Counting reasons: aim for 200–400 answers per segment you want to compare. Subgroups have much larger margins: the Pew Research Center notes that a subgroup of about 160 people in a survey of about 1,000 has a margin of about ±8 points.
- Comparing two figures: the margin of error on a difference is larger than on each figure. Pew's rule of thumb is roughly double within one survey.
- Tracking NPS: report a confidence interval, not just the score, and look at trends over several periods. MeasuringU's analysis shows that with 36 answers, a 90% confidence interval for NPS can be 40 points wide.
- Non-response bias is not in the margin of error. If only angry or delighted customers answer, a large sample will still be wrong.
Rules of thumb for qualitative VoC
Qualitative research finds problems and reasons; it does not count them. Three findings guide sample sizes:
- Usability tests: Jakob Nielsen's analysis (2000) found that about five similar users uncover roughly 85% of the usability problems in a design, and recommended several rounds of five. It is a rule for iterative usability testing, not for surveys.
- Interviews: in a study of 60 in-depth interviews, Guest, Bunce and Johnson (2006) found that new themes stopped appearing within the first 12 interviews, with the basic themes visible after six, for a fairly similar group of people.
- Customer needs: Griffin and Hauser (1993) found that 20–30 interviews uncover 90–95% of customer needs for a product category.
Our view. Use qualitative methods to find the reasons, then a short survey to count them, then an A/B test to prove the fix. Each method answers the question it is good at. Most bad VoC decisions come from asking one method to do another's job: counting with five interviews, or explaining with a score.
Section 8 · Analysis and AI
AI can now code open answers almost as well as people, but it cannot replace the customers themselves
The hardest part of VoC has always been reading: thousands of answers, reviews and tickets a month, most of them unread. Large language models have made that reading far cheaper and faster.
How to analyse feedback, with or without AI
- Read before you count. Read 50–100 answers and draft 10–20 themes in plain words ("delivery cost shown too late").
- Tag every answer, by hand or with an AI model given a definition and an example for each theme.
- Check the machine. Have a person tag a random 100 answers, compare, fix the definitions and re-run.
- Count and size. Count answers per theme by segment, and size each theme with sessions, orders or revenue.
- Keep the verbatims. Two or three real quotes per theme persuade decision-makers and often become the copy for the test.
What the research says about AI coding
- On clear themes, AI is close to human accuracy. In a 2024 study in Research & Politics, Jonathan Mellon and colleagues found that an Anthropic Claude model (Claude-1.3) coded "most important issue" answers from the British Election Study into 50 categories with 93.9% accuracy, against 94.7% for a human coder. On answers from later survey waves it scored 80.9% against 88.6%, so the gap depends on the task.
- On vague themes, it struggles. A 2025 study in the Journal of Learning Analytics found GPT-4 reached good agreement with human coders on 25 of 34 codes, and did poorly on ambiguous ones, the same codes that humans disagreed about.
- Language and set-up matter. A 2025 study of German open answers found that only a fine-tuned model reached satisfactory agreement with experts.
Synthetic respondents are for ideas, not evidence
Several vendors now offer "synthetic users": AI models that answer surveys or interviews as if they were customers. The research is clear about their limits. A 2024 study in Political Analysis found that ChatGPT's synthetic survey respondents matched human averages but showed much less variation, and that about a third of the relationships that differed from the human data pointed in the opposite direction. Nielsen Norman Group found synthetic users were sycophantic. A 2026 study in Nature found that GPT-4 predictions of 70 survey experiments correlated strongly with real results but systematically overestimated effect sizes.
Our view. Use AI to read and organise what real customers said, and check it on a sample. Use synthetic respondents, if at all, to generate hypotheses and draft questions before you talk to customers. Never report AI-simulated answers as customer evidence, and never size a business case on them.
Section 9 · VoC inside analytics and testing
Feedback is worth most when each answer is linked to what the same customer did
A survey answer on its own is an opinion. The same answer next to the customer's session, segment, order and test variant is evidence. That is why analytics and testing vendors have added survey and feedback modules, and why many teams already pay for one.
Four ways to connect VoC with analytics and testing
- Trigger surveys from behaviour. Show a survey after a signal from analytics: exit intent on the cart, repeated clicks on an element that does nothing ("rage clicks"), a search with no results or an error. You ask the people who just had the problem.
- Watch the session behind the answer. When a customer says "the discount code didn't work", the linked replay shows whether it was a bug, a confusing field or an expired code.
- Read feedback by test variant. Run the same short survey in both the control and the variant of an A/B test, at the same trigger. The test tells you which version won; the answers suggest why. Show it equally in both so the survey does not bias the result.
- Use answers as segments. Some testing tools let you target or personalise by a visitor's survey answer, for example showing reassurance content to visitors who gave a low score.
You do not need an enterprise platform for this. The main tool families are:
| Tool family | What it adds to VoC | Examples |
|---|---|---|
| Experience and product analytics with a VoC module | Surveys and feedback linked to replays, heatmaps and funnels | Contentsquare (incl. Hotjar), Amplitude, PostHog, Mouseflow, Fullstory, Quantum Metric, Glassbox, Air360 |
| Experimentation platforms with surveys | Feedback by variant; targeting by answer | Wingify (VWO and AB Tasty), Kameleoon (survey widgets) |
| Dedicated survey and feedback tools | Richer survey logic and channels; integrations with analytics | Qualtrics, Medallia, SurveyMonkey, Survicate, Typeform, Mopinion |
| Reviews platforms | Product-level feedback at scale | Trustpilot, Yotpo, Okendo, Judge.me, Bazaarvoice |
| AI feedback analytics | Themes across surveys, reviews and tickets | Chattermill, Enterpret, Thematic |
For a full comparison of these vendors, their modules, prices and how to choose one, see our Voice of Customer market report. For the replay side, see our session replay guide.
For marketers. Check your existing analytics and testing contracts before buying a survey tool. A two-question exit survey on the cart, linked to replays, is often the fastest route to your next winning test.
For leaders. The strategic asset is the combined record of what customers did and what they said. Favour tools and data set-ups that keep those two together and let you export them.
Section 10 · Privacy, accessibility and SEO
Privacy, accessibility and search rules shape how you can ask, so check them before launch
On-site feedback involves scripts, personal data and interface elements that are all regulated. This summary covers Europe and the UK as of September 2026; it is not legal advice, so check your set-up with your data protection officer.
Consent and data protection
- Survey and replay scripts fall under the ePrivacy rules in the EU. The European Data Protection Board's Guidelines 2/2023 (final version adopted October 2024) confirm that client-side JavaScript which sends information from the device back to a server is covered. Under Article 5(3) of the ePrivacy Directive, such scripts need consent unless they are strictly necessary for a service the user asked for.
- In France, survey and feedback widgets are not on the CNIL's list of consent-exempt trackers. In February 2026 the CNIL published a draft recommendation on session replay stating that replay requires consent, recommending that tools block the collection of passwords and bank details, and noting that UX improvement does not require linking a session to a user's identity. The final version had not been published at the time of writing.
- The UK has new exceptions. The Data (Use and Access) Act 2025 added an exception to the UK's PECR rules for storage and access used only to collect statistics to improve a service, provided users get clear information and a simple, free way to object. The ICO's April 2026 guidance names A/B testing as likely to qualify; it does not name surveys or replay.
- Answers are personal data. Under the GDPR, collect only what you need for a stated purpose (Article 5), warn people not to type personal details in open-text fields, and set a retention period.
Accessibility
Since 28 June 2025, the European Accessibility Act has applied to e-commerce services in the EU, with an exemption for microenterprises (fewer than 10 staff and no more than €2 million turnover). Survey widgets are part of the service. The WCAG 2.2 criteria that most often catch them out are keyboard access and no keyboard traps (2.1.1, 2.1.2), a logical focus order (2.4.3), focus not hidden by sticky tabs or overlays (2.4.11), labelled inputs (3.3.2), accessible names and roles (4.1.2), a "thank you" message that screen readers announce (4.1.3), and targets of at least 24 by 24 CSS pixels, or enough spacing, for rating buttons and close icons (2.5.8).
Search visibility
Google has discouraged intrusive pop-ups on mobile since January 2017. Its current guidance on interstitials and dialogs says: "Don't obscure the entire page with interstitials" and recommends "banners that take up only a small fraction of the screen" instead. For VoC this means corner or slide-in surveys, triggered after engagement rather than on arrival from search, and easy to dismiss.
Section 11 · Mistakes
10 common Voice of Customer mistakes, and how to avoid them
| Mistake | Why it hurts | What to do instead |
|---|---|---|
| 1. Surveying without a decision | Answers pile up and nothing changes | Write the decision and metric first (Step 1) |
| 2. Leading or double-barrelled questions | Answers reflect the wording, not the customer | Neutral, one-idea questions; pilot with five people |
| 3. Full-screen pop-ups on arrival | Annoys visitors, hurts search visibility, low response | Small, well-timed, easy-to-dismiss widgets |
| 4. Scores without verbatims | You know the score fell but not why | Always follow a score with one open question |
| 5. Reading noise as a trend | Teams react to random movements | Report margins of error; plan sample sizes |
| 6. Listening only to people who answer | Fewer than one in three consumers give feedback; the silent majority is missed | Combine surveys with reviews, tickets, search logs and behaviour |
| 7. Ignoring feedback you already have | Paying to ask what customers already told you | Start with reviews, tickets, chats and return reasons |
| 8. Taking what people say at face value | Intentions explain only part of behaviour | Check claims against analytics and test them |
| 9. Letting AI replace customers | Synthetic answers understate variety and can mislead | AI for reading and ideas; real customers for evidence |
| 10. No owner, no loop | Insights die in a slide deck | One owner, a regular review and a link to the test backlog |
Section 12 · Building a programme
A VoC programme should match the size of your team, and every size can start this month
Voice of Customer is not only for large companies. At every size the success measure is the same: decisions made and tests launched because of what customers said.
| Team | What to run | Rhythm | Owner |
|---|---|---|---|
| One or two people (small store or first CRO hire) | Reviews on every product; one exit survey on the cart; one post-purchase question; a monthly read of support tickets | Monthly: top five themes, one test or fix each | The e-commerce or marketing lead |
| Growing digital or CRO team | Behaviour-triggered surveys linked to replays; VoC evidence required in every test brief; AI coding of reviews and tickets | Weekly theme review; monthly insight report to the business | A named VoC or research lead within the CRO team |
| Multi-brand or international retailer | A shared theme list across channels and markets; CES after key journeys; interviews each quarter; closed-loop alerts to owners | Weekly by brand; quarterly executive review of themes, actions and revenue impact | A VoC programme owner with a budget, working with analytics and experimentation |
For leaders and investors. In due diligence or a quarterly review, ask to see the last three decisions that customer feedback changed, and the measured result of each. A team that can answer quickly has a working VoC programme; a team that shows only NPS charts does not.
Section 13 · What to do next
Five moves turn customer feedback into better experiences and more revenue
1. Audit the feedback you already have
List every place customers already talk to you, including any survey module in your analytics or testing tools. Most teams own more feedback than they read.
2. Answer one question well in the next 30 days
Pick the biggest drop-off in your funnel, write the decision it affects, and run one short survey or five usability tests. Size the themes and share them with the team that can act.
3. Put customer evidence in every test brief
Make the hypothesis template in Section 5 mandatory. Evidence-backed tests are easier to prioritise and explain, win or lose.
4. Link answers to behaviour, lawfully
Connect answers to sessions, segments and test variants, with consent, masking and retention rules agreed with your data protection officer.
5. Give VoC an owner and a rhythm
Name one owner, set a weekly or monthly review, and keep a learning library of themes, verbatims, tests and results. For the wider argument, read our article on why Voice of Customer is the missing layer in optimization strategy.
Our view. The goal of Voice of Customer is not more feedback. It is a better customer experience that grows revenue and lifetime value. Analytics tells you where to look, customers tell you why, and experiments tell you what works. Teams of any size can run that loop, starting with one question this month.
FAQ
Frequently asked questions about Voice of Customer
Frequently asked questions
What is Voice of Customer (VoC)?
Voice of Customer is the practice of capturing what customers need, expect and experience, in their own words, through surveys, reviews, support conversations, interviews and observation, and turning that feedback into decisions.
What are examples of Voice of Customer methods?
Common methods include on-site and exit surveys, post-purchase surveys, NPS, CSAT and CES surveys, feedback buttons, product reviews, support tickets and chat logs, return reasons, site-search queries, customer interviews and usability tests.
What is the difference between NPS, CSAT and CES?
NPS measures overall loyalty (likelihood to recommend, 0–10). CSAT measures satisfaction with a specific experience (usually the share of 4–5 answers on a 5-point scale). CES measures how easy it was to get something done.
How many survey responses do I need?
For counting how common a reason is, a few hundred answers per segment gives a margin of error of about ±5–7 points; 100 answers gives about ±10. NPS is noisier. To discover reasons, 5 usability tests per round or 12–30 interviews usually suffice.
What is a good response rate for an on-site survey?
It varies widely by channel and design. On SurveyMonkey's platform in 2025, website pop-ups averaged a 3.7% response rate against 49% for email. In-app surveys averaged 27.5% in Refiner's 2025 analysis.
How do you use Voice of Customer in A/B testing and CRO?
Use analytics to find where customers drop off, VoC to find out why, and an A/B test to prove the fix. Turn each theme into a hypothesis, and read feedback by test variant to learn why a version won or lost.
Do on-site surveys need cookie consent in Europe?
Often, yes. In the EU, scripts that read or send information from a visitor's device fall under the ePrivacy rules, and survey widgets are not on the French CNIL's list of consent-exempt trackers. Check your set-up with your data protection officer.
Key terms
- Voice of Customer (VoC)
- The practice of capturing customers' needs, expectations and frustrations in their own words, and turning them into decisions. It explains the "why" behind behaviour that analytics measures.
- Unsolicited feedback
- Feedback customers give without being asked: reviews, support tickets, chat logs, social posts, return reasons and site searches. It is candid and plentiful, but unstructured.
- On-site survey (web intercept)
- A short survey shown on a website or app, triggered by a page, an action or a behaviour such as exit intent. It catches customers in the moment.
- Post-purchase survey
- A survey shown on the order confirmation page or sent by email after delivery. It captures why people bought, what nearly stopped them and how the experience felt.
- Net Promoter Score (NPS)
- The percentage of customers who score 9–10 on "How likely are you to recommend us?" minus the percentage who score 0–6. It tracks loyalty over time, but on its own it does not say what to fix.
- Customer Satisfaction Score (CSAT)
- The share of customers who rate an experience 4 or 5 on a 5-point satisfaction scale. It is best for judging a specific interaction, such as a delivery or a support contact.
- Customer Effort Score (CES)
- A score for how easy it was to get something done, such as solving a problem or completing a purchase. Research links low effort strongly to repurchase intentions, and high effort to negative word of mouth.
- Verbatim
- A customer's answer in their exact words. Verbatims often supply the language for better copy and test ideas.
- Coding (thematic analysis)
- Tagging each verbatim with one or more themes, such as "delivery cost" or "size guide", so you can count and compare them. It turns thousands of comments into a ranked list of problems.
- Closing the loop
- Acting on feedback and telling customers or teams what changed.
- Hypothesis
- A testable statement linking evidence, a change and an expected effect. VoC supplies the evidence; an A/B test checks the prediction.
- Margin of error
- How much a survey result could move by chance alone, usually at 95% confidence.
- Synthetic respondents (synthetic users)
- AI models prompted to answer as if they were customers. Useful for generating ideas, but they are not real customers and must not be used as evidence.
Sources
Research findings, benchmarks and regulatory texts were checked against the original publications or the publishers' own pages on 26 September 2026. Vendor benchmarks (SurveyMonkey, Refiner, Survicate, Optimizely) come from each vendor's customer base, use their own definitions and are labelled as such. Margin-of-error figures are Henkan & Partners calculations using the standard normal approximation. Frameworks, question examples and programme recommendations are Henkan & Partners' own and are labelled as such. Henkan & Partners works with several vendors named in this guide, including as a certified partner of Contentsquare, Kameleoon, AB Tasty and Air360; this guide does not rank vendors.
- Griffin & Hauser, "The Voice of the Customer", Marketing Science, 1993 (MIT Sloan PDF)
- Hauser & Clausing, "The House of Quality", Harvard Business Review, May 1988
- Reichheld, "The One Number You Need to Grow", Harvard Business Review, December 2003
- Bain & Company, Measuring your Net Promoter Score
- Keiningham et al., "A Longitudinal Examination of Net Promoter and Firm Revenue Growth", Journal of Marketing, 2007
- Qualtrics, What is CSAT
- American Customer Satisfaction Index, History
- Dixon, Freeman & Toman, "Stop Trying to Delight Your Customers", Harvard Business Review, July–August 2010
- Christensen et al., "Know Your Customers' Jobs to Be Done", Harvard Business Review, September 2016
- Baymard Institute, cart abandonment rate statistics
- Qualtrics XM Institute, businesses risk $3 trillion in sales from poor customer experiences, November 2025
- Optimizely, top 10 takeaways from the experimentation playbook (127,000 experiments)
- Kohavi & Longbotham, "Online Controlled Experiments and A/B Testing" (Microsoft results)
- Webb & Sheeran, Psychological Bulletin, 2006, citing Sheeran (2002) on intentions and behaviour
- Nielsen, "First Rule of Usability? Don't Listen to Users", NN/g, 2001
- Gallo, "The Value of Keeping the Right Customers", Harvard Business Review, October 2014
- SurveyMonkey, survey response rate benchmarks
- Refiner, in-app survey response rates (2025)
- Survicate, 2025 survey completion rate benchmark report
- SurveyMonkey, survey completion times
- Pew Research Center, Writing Survey Questions
- Nielsen Norman Group, Writing Good Survey Questions: 10 Best Practices, 2023
- Pew Research Center, 5 key things to know about the margin of error, 2016
- MeasuringU, confidence intervals for Net Promoter Scores, 2021
- Nielsen, "Why You Only Need to Test with 5 Users", NN/g, 2000
- Guest, Bunce & Johnson, "How Many Interviews Are Enough?", Field Methods, 2006
- Mellon et al., "Do AIs know what the most important issue is?", Research & Politics, 2024
- Liu et al., "Qualitative Coding with GPT-4: Where it Works Better", Journal of Learning Analytics, 2025
- von der Heyde et al., "AIn't Nothing But a Survey?", arXiv, 2025
- Bisbee et al., "Synthetic Replacements for Human Survey Data?", Political Analysis, 2024
- Nielsen Norman Group, Synthetic Users, 2024
- Ashokkumar et al., Nature, July 2026
- EDPB Guidelines 2/2023 on the technical scope of Art. 5(3) ePrivacy Directive, v2, October 2024
- CNIL, guidelines on cookies and other trackers
- CNIL, public consultation on its draft recommendation on session replay, February 2026
- ICO, exceptions for storage and access technologies
- GDPR Article 5
- EUR-Lex, European Accessibility Act, Directive (EU) 2019/882
- W3C, Web Content Accessibility Guidelines (WCAG) 2.2
- Google Search Central, avoid intrusive interstitials and dialogs
- AB Tasty documentation, NPS segment criterion
- Henkan & Partners, The Voice of Customer Market, 2000–2026