Focus
User Interviews: How Many You Need, Who to Recruit and How to Run Them
Alexandre Suon · 2026-10-21
Most teams ask 'how many user interviews do we need?' and get the same answer: five. That number comes from a 1993 model of usability testing, and it holds only for one design, one type of user and problems that affect about a third of people. This guide explains what the five-user rule really says, how many interviews you need per audience, who to recruit and where, how to run a 45-minute interview, and how to turn the notes into a backlog of changes you can test.
Executive summary
- Interviews, usability tests and surveys answer different questions. Interviews explain needs, motives and context; usability tests show where people get stuck on a design; surveys count how common an answer is. Pick the method from the decision you need to make, not from habit.
- The five-user rule is a model, not a law. Nielsen and Landauer's formula, found = 1 − (1 − L)^n, says five users see about 84% of the problems that affect 31% of users. The same five users see only 41% of the problems that affect 10% of users and 23% of those that affect 5%.
- Five is a minimum per audience, not a total. Faulkner (2003) found that random groups of five found anywhere from 55% to 99% of known problems. If your customers fall into four groups that behave differently, five users in total gives you about one per group.
- For interviews, plan five to eight per segment and stop at saturation. Empirical studies of homogeneous groups reached saturation at about 9 to 17 interviews (Hennink & Kaiser, 2022), with the main themes visible after six to twelve.
- Recruit from where your customers already are. CRM e-mail, in-app or on-site invitations, physical locations, customer service and panels each bring different people. Use an open-ended screener, pay a fair incentive and book about 20% more sessions than you need.
- An interview is only worth its synthesis. Code the notes, cluster them into themes, and turn each theme into a hypothesis with evidence, change, audience and metric. In our illustrative round, 24 interviews produce about 600 observations, 8 themes, 12 hypotheses and 3 tests to run first.
Section 1 · Choosing the method
Interviews, usability tests and surveys answer different questions, so start from the decision
Teams often say 'user interviews' for three different activities: a conversation about someone's life and decisions, a session where someone tries to use a design, and a questionnaire sent to many people. Each produces a different kind of evidence. Mixing them up is the first reason research disappoints.
User interviews are one-to-one conversations in which a researcher asks a participant open questions about their experiences, needs, decisions and context. Market research and social science call the same method in-depth, semi-structured or qualitative interviews. Interviews explain why people act as they do; they do not measure how many people do it, and they are not a test of a design.
Nielsen Norman Group describes the method in the same terms: interviews give 'in-depth insight into who your users are, their lives, experiences, and challenges', while usability tests are the tool 'to assess a design: how it performs, what's not working, and why' (Rosala & Pernice, NN/g, 2023). The classic warning applies to both: 'pay attention to what users do, not what they say', because 'self-reported claims are unreliable, as are user speculations about future behavior' (Nielsen, NN/g, 2001).
Christian Rohrer's map of research methods gives a simple way to place each method on two axes: what people say versus what they do, and why and how (qualitative) versus how many and how much (quantitative). Qualitative methods suit questions about why a problem occurs or how to fix it; quantitative methods suit questions about how many people are affected (Rohrer, NN/g, 2022).
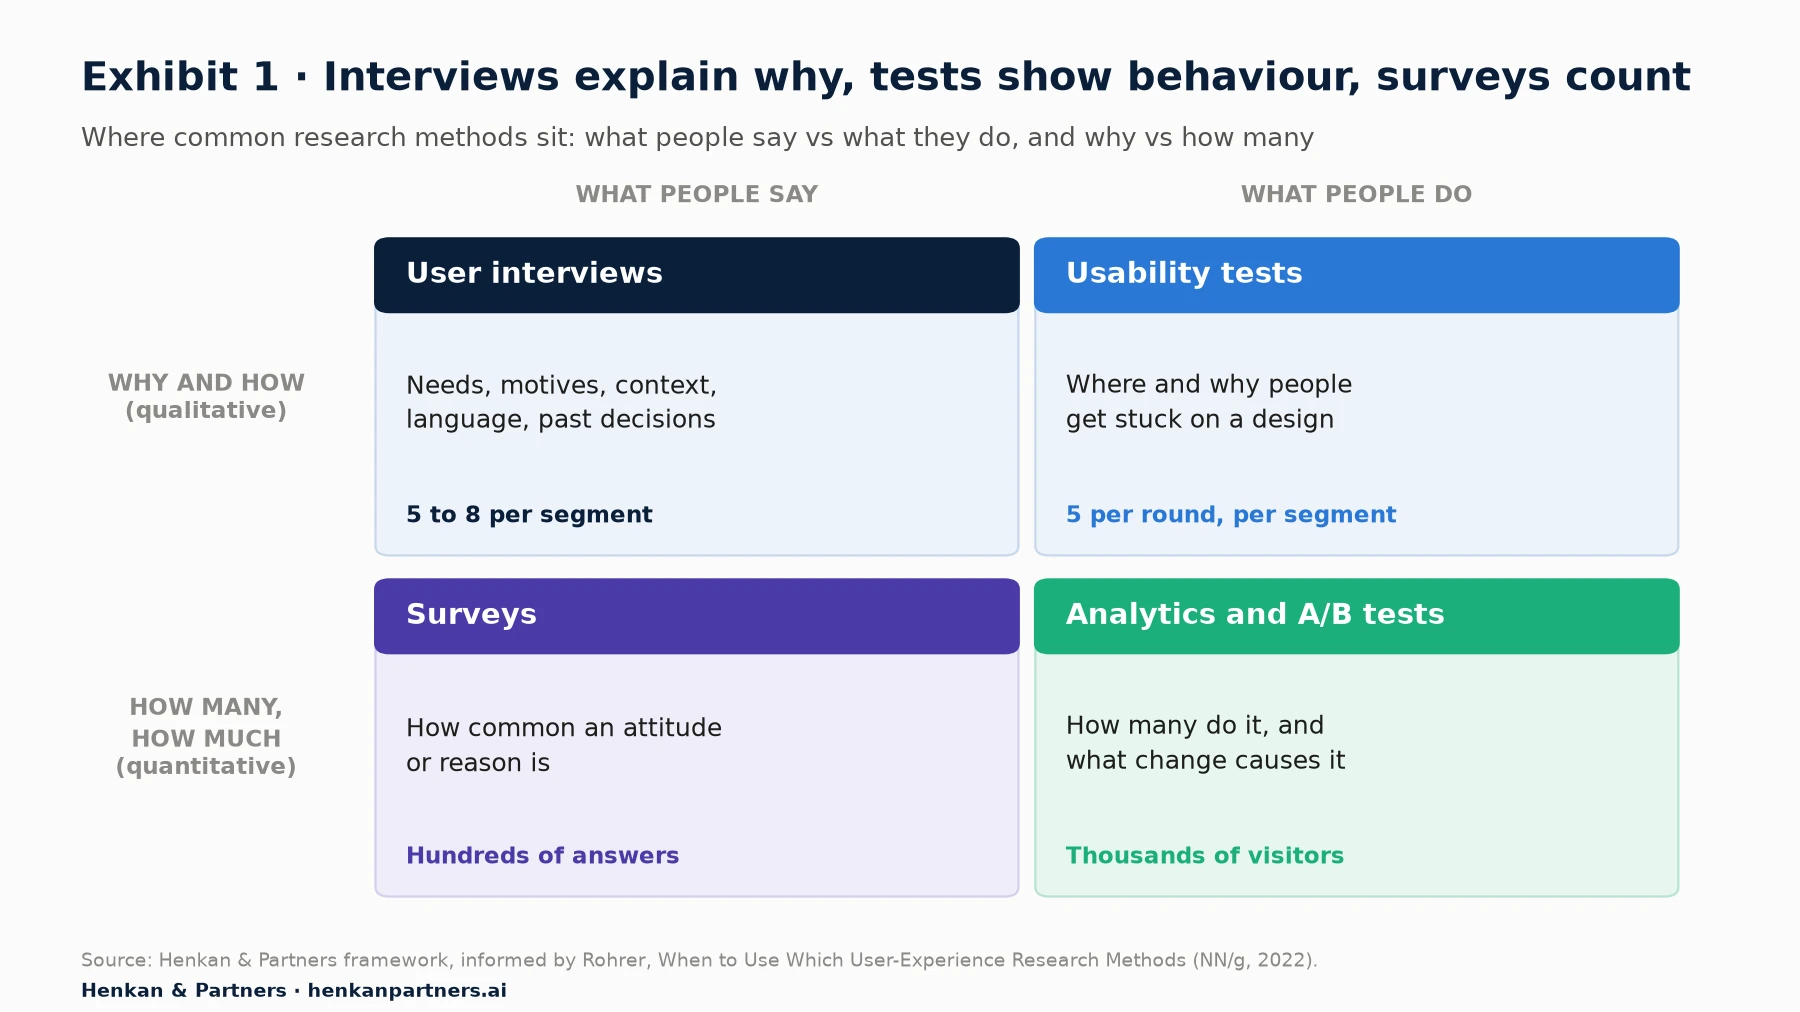
What this shows. Interviews and usability tests sit on the same qualitative row, which is why both work with small samples. They differ on the other axis: interviews collect what people say about their past, usability tests watch what people do with a design. Surveys and analytics move to the quantitative row, where small samples stop working and you need hundreds or thousands of data points.
| Method | Best for | Typical sample | What it cannot do |
|---|---|---|---|
| User interview | Needs, motives, context, vocabulary, why people chose, stayed or left | 5 to 8 per segment, until no new themes appear | Count how common something is; judge a design; predict future behaviour |
| Usability test | Where and why people fail on a page, flow or prototype | About 5 per round and per segment, repeated after fixes | Explain broader motives; estimate how many users hit a problem |
| Survey | How common an attitude, reason or need is; trends over time | Hundreds of answers for stable percentages | Explain the why in depth; reach people who do not answer surveys |
| Analytics and A/B tests | What people actually do, at scale; whether a change causes an effect | Thousands of visitors per variant | Say why people behave as they do |
In practice the methods feed each other. Interviews give you the words and reasons to put in a survey; a survey tells you which of those reasons matter to most people; analytics shows where the drop-off happens; a usability test shows why; an A/B test proves the fix. Our guides to on-site survey design and Voice of Customer cover the survey side of this loop. This article covers the interview side, and the usability rounds that often run with it.
Section 2 · The five-user rule
Five users find most problems only when the problems are common
The five-user rule comes from usability testing, not from interviews. In 1993 Jakob Nielsen and Thomas Landauer analysed usability studies and heuristic evaluations and modelled how the number of distinct problems found grows with each extra participant (Nielsen & Landauer, INTERCHI 1993). In 2000 Nielsen turned the model into the most quoted rule in user research: 'Why You Only Need to Test with 5 Users' (Nielsen, NN/g, 2000).
Share of problems found with n users = 1 − (1 − L)^n

L = probability that a single user runs into a given problem (Nielsen's average across projects: 31%)
n = number of test users

Users needed to reach a target share T: n = ln(1 − T) ÷ ln(1 − L)
With L = 31%, five users find 1 − 0.69^5 = 84% of the problems, which Nielsen rounded to 85%. The article's real recommendation is often forgotten: rather than one study with 15 users, Nielsen advised spending the same budget on '3 studies with 5 users each', fixing problems between rounds. He also wrote that when a product has several distinct groups of users, you should test '3–4 users from each category if testing two groups of users' and '3 users from each category if testing three or more groups of users' (Nielsen, NN/g, 2000).
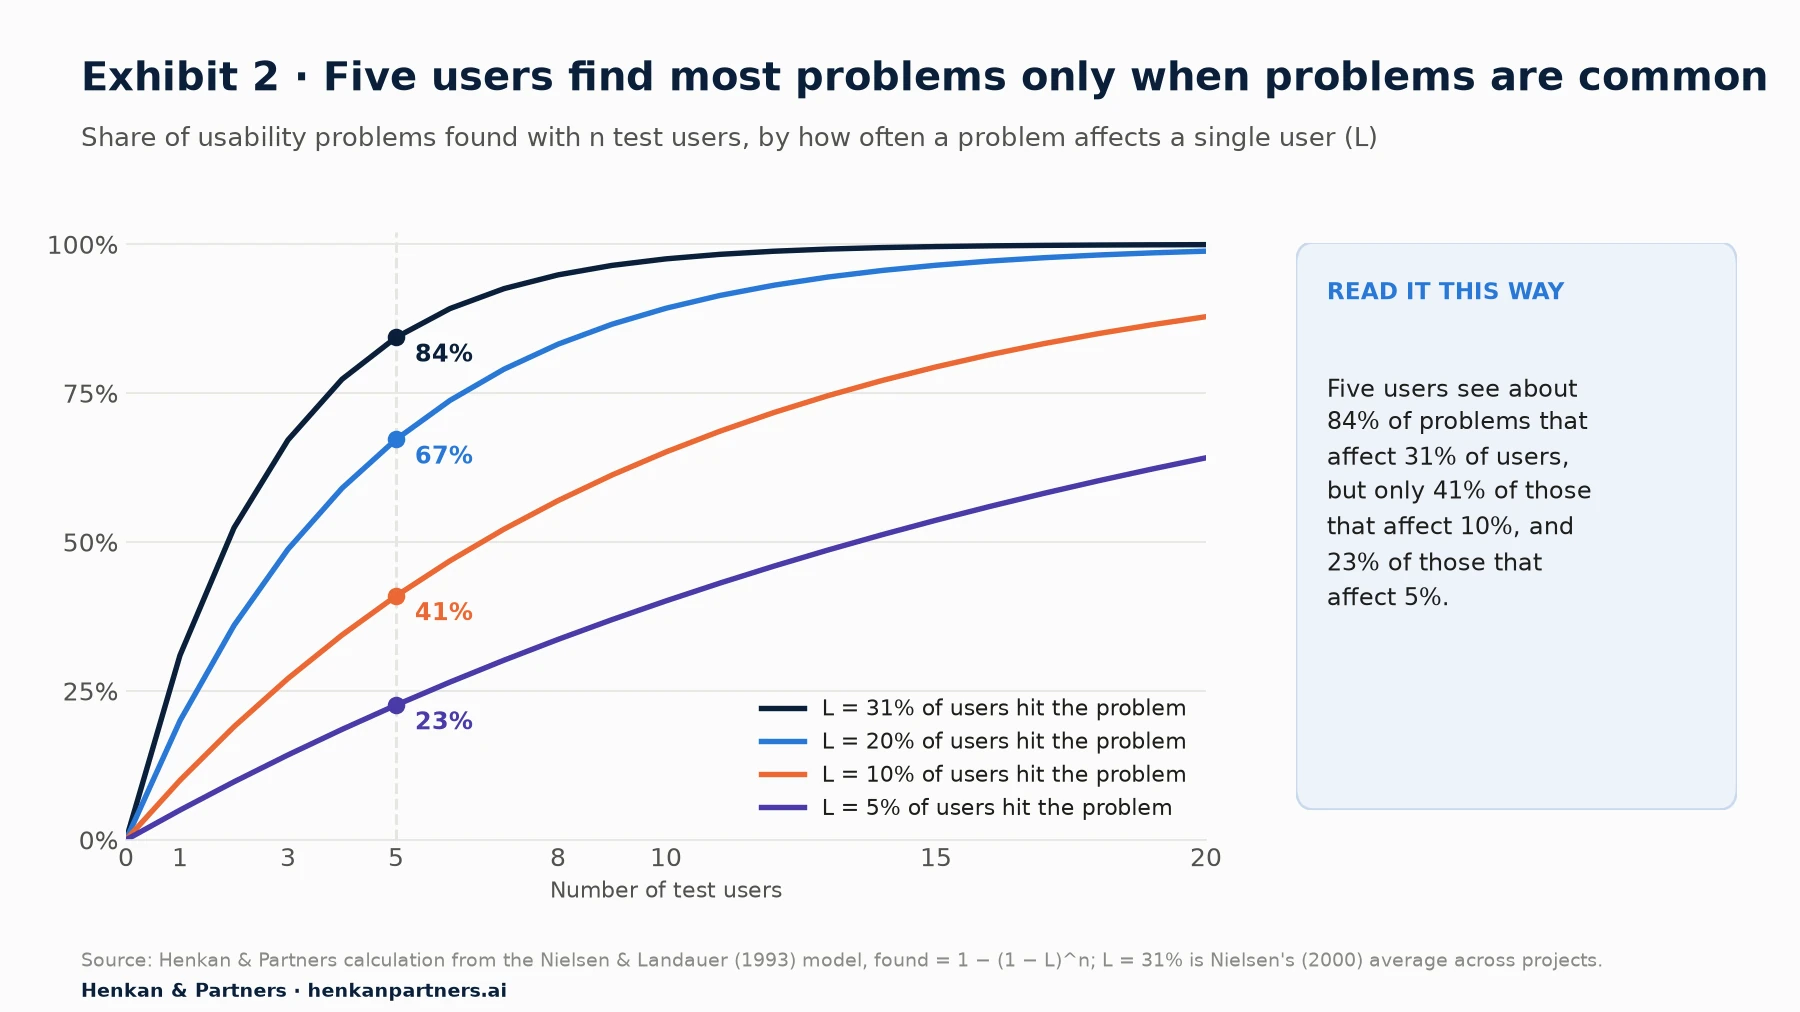
What this shows. The curve flattens fast when problems are common, which is why the first few sessions feel so productive. When problems are rarer, the same five sessions miss most of them. Mature e-commerce sites, which have already fixed their obvious issues, mostly have problems in the lower curves. NN/g makes the same point: the 31% figure comes from early-1990s projects, and if the probability is 20% you need 9 users, if it is 10% you need 18 (Budiu, NN/g, 2021).
| How often a problem affects one user (L) | Share found by 5 users | Users for about 85% | Users for 95% |
|---|---|---|---|
| 31% (Nielsen's average) | 84% | 5 | 9 |
| 20% | 67% | 9 | 14 |
| 15% | 56% | 12 | 19 |
| 10% | 41% | 18 | 29 |
| 5% | 23% | 37 | 59 |
Read the rule correctly. Five users do not find 85% of all problems. Jeff Sauro and Jim Lewis put it precisely: five users reveal about 85% of the problems that affect roughly 3 in 10 users, under the same tasks, the same kind of participants and the same method (Sauro & Lewis, MeasuringU, 2020). Change any of those and the number changes.
Section 3 · Limits and critiques
Five is a minimum per audience and per round, not a total for the study
The model is useful, and its critics do not say it is wrong. They say its assumptions rarely hold in the way teams use it. Four critiques matter in practice.
- Small samples vary a lot. Laura Faulkner tested 60 users and drew random groups of five. Some groups found nearly all known problems, others only 55%; with groups of ten, the lowest share found rose to about 80%, and with groups of twenty to 95% (Faulkner, 2003). The 85% is an expected value, not a guarantee for any single study.
- Open, realistic tasks find more problems, more slowly. Spool and Schroeder ran 49 participants on four shopping sites, asking them to buy something they actually needed. The first five participants uncovered only 35% of the problems found, and some serious problems that blocked purchases appeared only with the 13th and 15th participants (Spool & Schroeder, CHI 2001, as reported by Bastien, 2010).
- Early estimates of L are too optimistic. Estimating the problem rate from the first few sessions always overstates it, because problems no one has hit yet cannot appear in the data. In one example, three participants gave L = 59% against 37% from the full study (Sauro & Lewis, MeasuringU, 2020, citing Hertzum & Jacobsen).
- Problem rates differ widely. Published large-sample estimates of L range from about 3% to 60% (Sauro & Lewis, MeasuringU, 2020). One average cannot plan every study.
For interviews, the question is saturation, not problem discovery
Interviews are not looking for usability problems, so the five-user curve does not apply directly. The relevant concept is saturation: the point at which new interviews stop producing new themes. Three empirical studies give useful planning numbers.
- Guest, Bunce and Johnson (2006) analysed 60 in-depth interviews and found that saturation occurred within the first twelve, with the basic elements of the main themes present as early as six.
- Hennink, Kaiser and Marconi (2017) separated two kinds of saturation: the range of issues (code saturation) appeared after nine interviews, but a rich understanding of them (meaning saturation) needed 16 to 24.
- Hennink and Kaiser (2022) reviewed 23 articles that tested saturation. Studies using empirical data reached saturation at about 9 to 17 interviews, mostly with homogeneous groups; more diverse study designs needed larger samples.
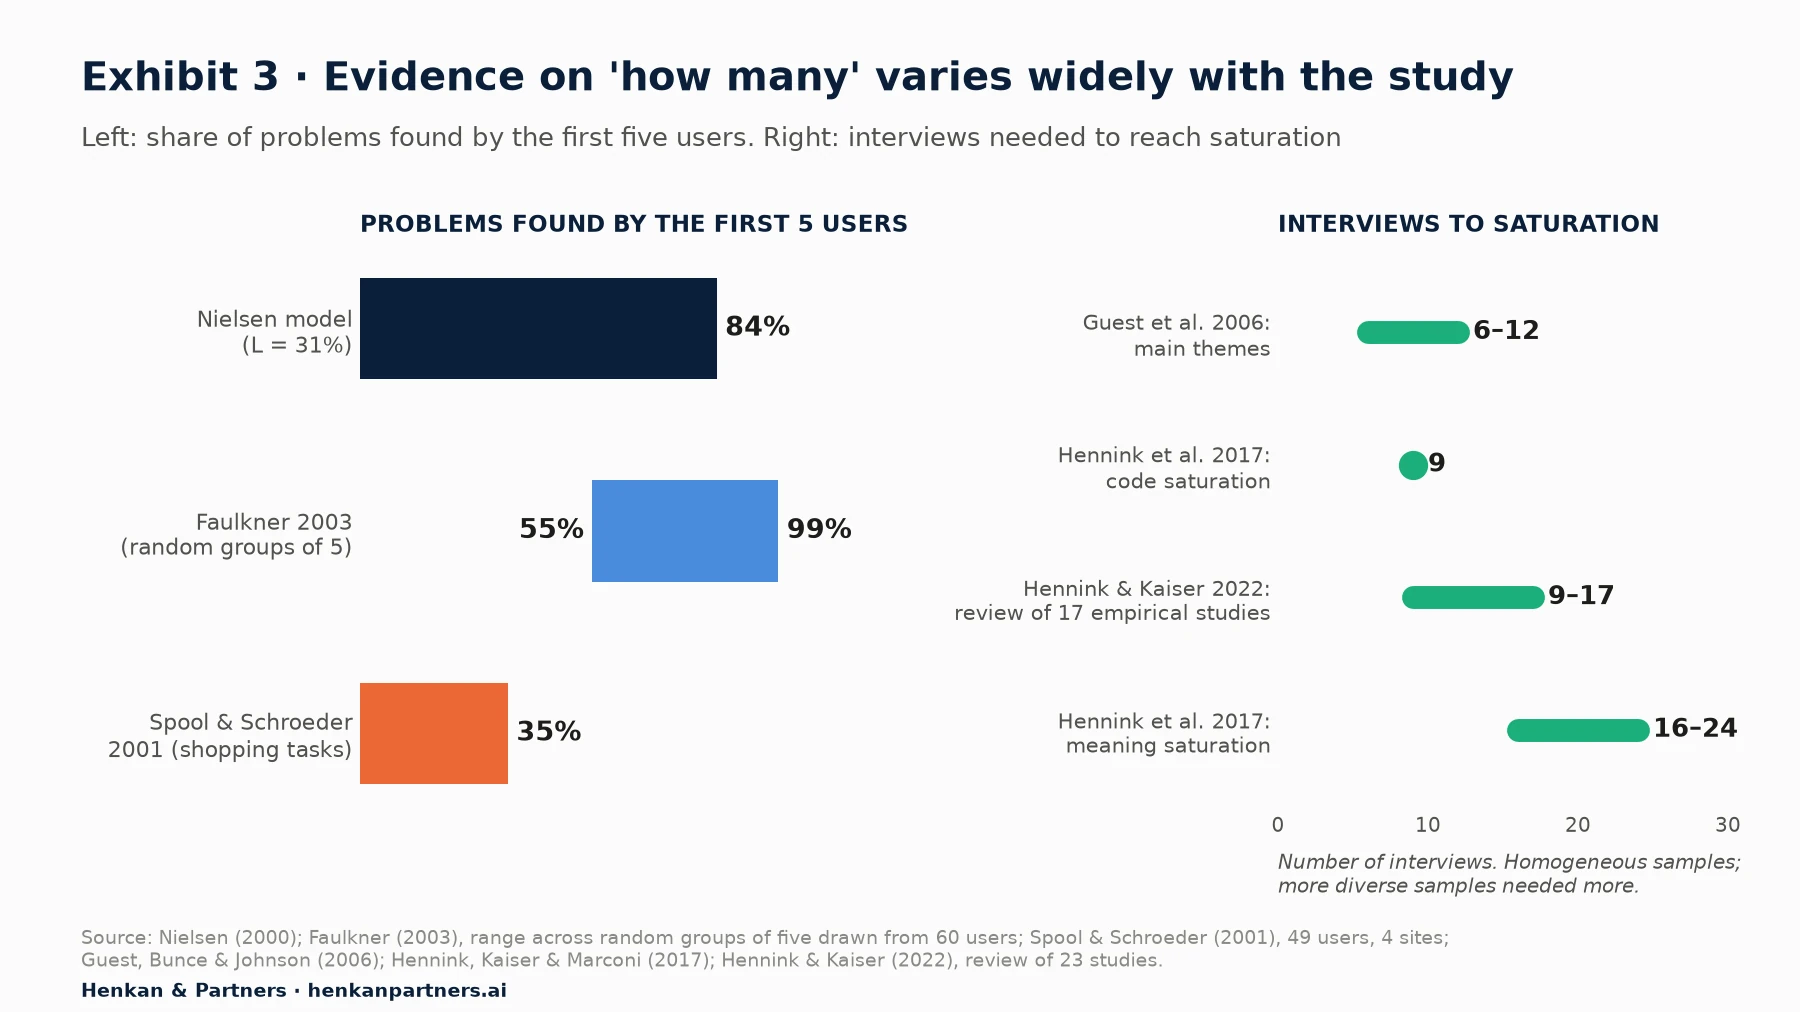
What this shows. For usability tests, five is a good first round on a narrow, well-defined task, and a poor final answer on an open shopping journey. For interviews, the evidence points to roughly 6 to 12 conversations to see the main themes in one homogeneous group, and more to understand them in depth. Both numbers are per group. Our rule of thumb: plan five to eight interviews per segment, review the notes after each batch, and stop a segment when two or three interviews in a row add nothing new.
Section 4 · Who to interview
Plan the sample by audience: every group that behaves differently needs its own interviews
The most common sampling mistake is not too few interviews. It is too few interviews per group. A team runs six interviews, two with loyal customers, two with new ones, one with a lapsed customer and one with a prospect, and then generalises about 'our customers'. Each group was heard once or twice, and a problem that only one group has is easy to miss.
The arithmetic is the same as the five-user curve. Suppose a problem affects 31% of one segment and nobody else. With one session from that segment, you have a 31% chance of seeing it at least once; with five, 84%; with six, 89%. Spreading five sessions across four segments gives you roughly one per segment, and therefore roughly a one-in-three chance of noticing each segment's own problems.
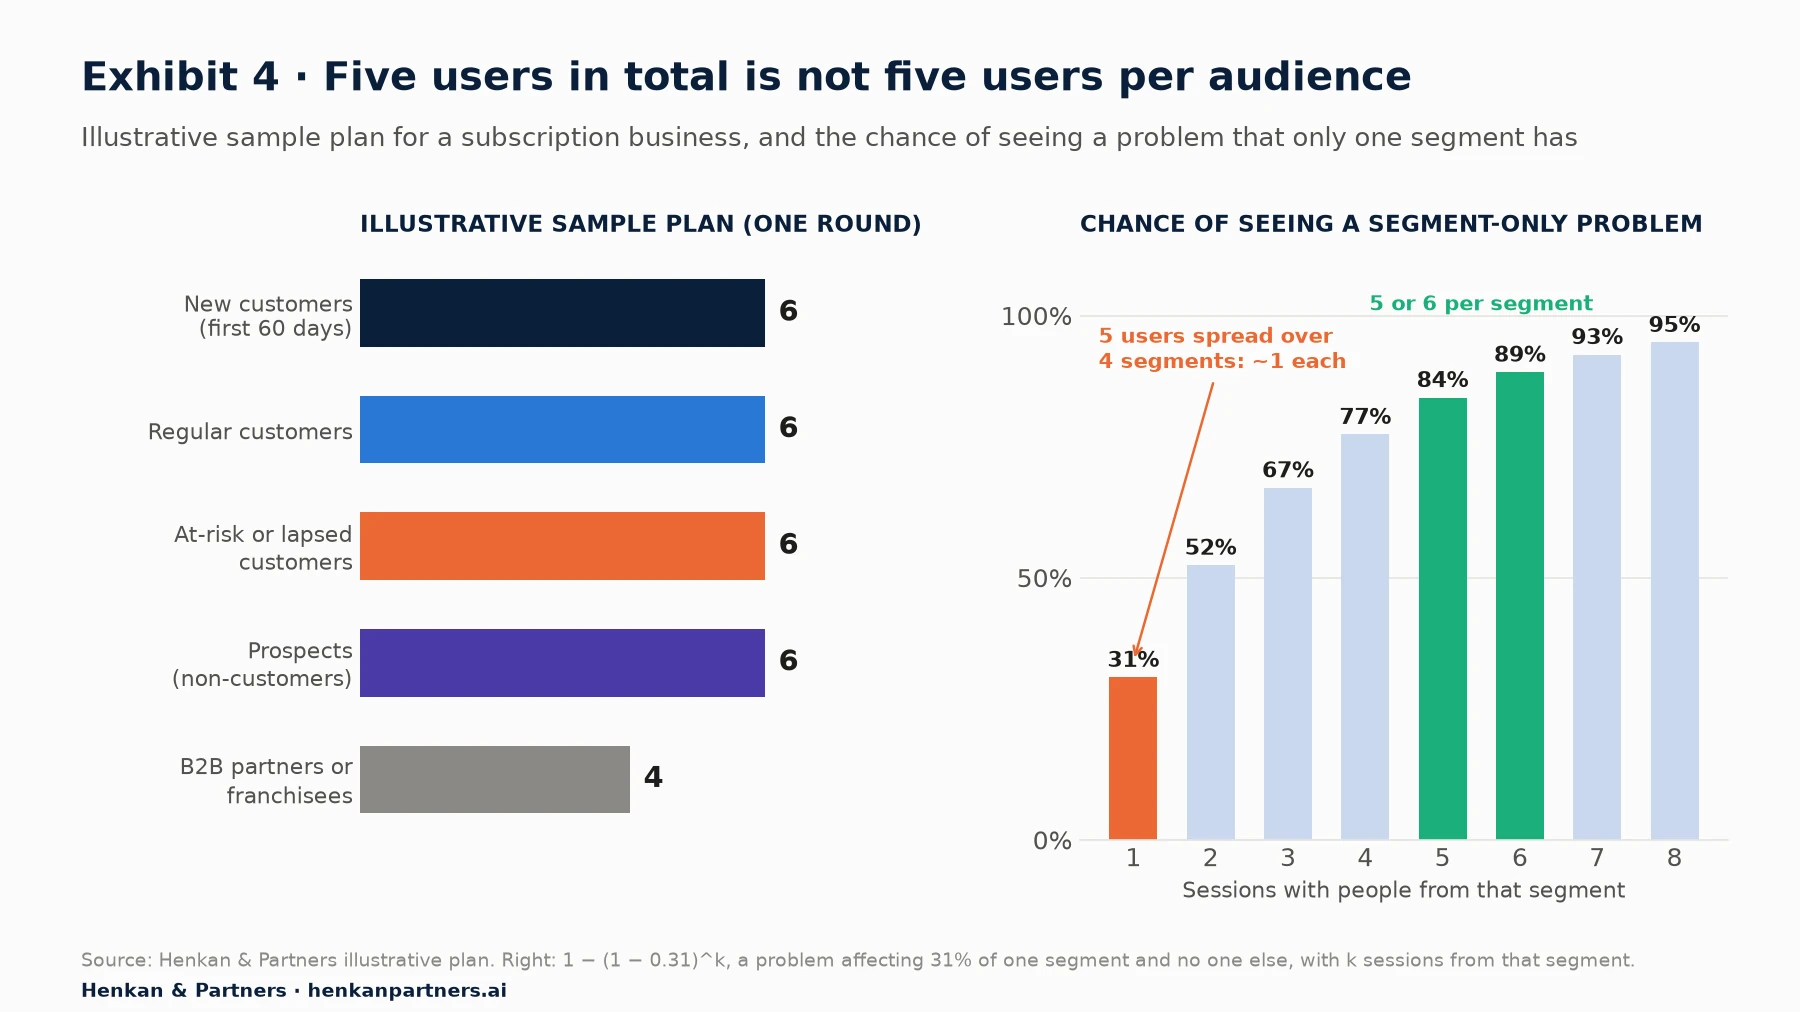
What this shows. In the illustrative subscription business, the plan gives each consumer segment six interviews and B2B partners four, 28 sessions in all. The right panel explains why: below five sessions per segment, problems specific to that segment are more likely to be missed than seen. If budget forces a choice, cut a segment from this round rather than thinning every segment.
Five audiences most e-commerce sites and apps should consider
| Segment | What you learn | Where to find them | Screener cue |
|---|---|---|---|
| New customers (first purchase or sign-up in the last 30 to 60 days) | Why they chose you, what nearly stopped them, what they expected from onboarding | Post-purchase e-mail, in-app message after the first order | Date of first order or account creation |
| Regular customers | What keeps them, how they really use the site or app, which workarounds they rely on | CRM e-mail, loyalty programme, app users | Number of orders or visits in the last 6 or 12 months |
| At-risk or lapsed customers | Why value dropped, what competitors offer, which moments triggered the decision | CRM segment of falling activity, cancellation flow, exit survey opt-in | Last order date; cancelled or downgraded plan |
| Prospects (visited, never bought) | Barriers to the first purchase, comparison criteria, missing information | On-site invitation, abandoned-basket e-mail if consented, panels | Visited or considered in the last 3 months; currently uses an alternative |
| B2B partners or franchisees | How operators use your tools, what slows them down, where head office and local teams disagree | Account managers, partner portals, regional meetings | Role, size of site or store, years as a partner |
Segment by behaviour first, demographics second. Two customers of the same age who buy weekly and yearly behave more differently than two weekly buyers of different ages. Pull the segments from your own data: recency, frequency and value from the CRM, or the behavioural segments described in our guide to GA4 segments for personalisation. For B2B networks, interview both sides: the operator who uses the tool every day and the head-office person who chose it.
Our view. Always include people who left or never bought. Interviewing only happy, available customers is the research version of survivorship bias: you learn why people stay, and nothing about why most visitors never start.
Section 5 · Recruiting
Recruit from where your customers already are, screen with open questions and over-book by 20%
Recruiting is where most interview programmes stall. The work is not difficult, but it is slow, and the channel you choose decides who you hear from. Plan it like a small marketing campaign with a funnel.
Six recruiting channels, each with its own bias
| Channel | Speed | Cost per participant | Best for | Watch out for |
|---|---|---|---|---|
| CRM e-mail | Days | Incentive only | Customers by segment: new, regular, lapsed | Over-represents engaged, e-mail-reading customers; check consent and contact rules |
| In-app or on-site invitation | Fast on busy pages | Incentive and tool cost | People in context: visitors, prospects, app users | Interrupts the journey; keep it off checkout and payment pages |
| In-store or on-site recruiting | Depends on footfall | Staff time and incentive | Customers of physical locations, partners, staff | Store teams pick 'nice' customers; give them a simple quota |
| Customer service and sales | Slow but targeted | Staff time | Customers with real problems; B2B accounts | Agents select angry or friendly extremes |
| Research panels and agencies | Fast for common profiles | Incentive plus a panel or agency fee | Prospects, competitors' customers, niche profiles | Professional participants; screen hard |
| Social media and communities | Variable | Low | Fans, enthusiasts, early adopters | Your most vocal fans, not your average customer |
Use at least two channels per round, so that no single bias dominates. For prospects and people who left, you will usually need on-site invitations or a panel, because they are not in your CRM or no longer read your e-mails. Our article on on-site survey design explains how to trigger an intercept on behaviour rather than on arrival; the same rules apply to an interview invitation.
Write a screener that does not give the answer away
A screener is the short questionnaire that decides who qualifies. It has two conflicting goals: to collect specific information about the person without revealing what the study is about (Whitenton, NN/g, 2019). NN/g's guidance is practical:
- Ask about past behaviour with open questions, such as 'Please describe the last time you ordered from a subscription service'. A description is harder to fake than a tick.
- Avoid yes/no questions, which show the respondent which answer qualifies.
- Use plausible distractors in multiple-choice questions, so the target behaviour does not stand out.
- Ask for occupation openly, rather than listing the jobs you exclude (people who work in marketing, UX or research are usually screened out).
- Screen out people who tick everything, a sign of an over-eager participant.
Pay a fair incentive and plan for no-shows
Incentives buy time and attention, not opinions. User Interviews, a US recruiting platform, recommends about $80 per hour for consumers and $85 per hour for professionals for remote one-to-one interviews, and $90 and $140 for in-person sessions, based on nearly 20,000 projects on its platform (User Interviews, Research Incentives Report, vendor data). Adapt to your market and to the profile: senior B2B participants and rare profiles cost more; your own loyal customers may accept a voucher or credit. Pay quickly, and pay people even if the session is cut short through no fault of theirs.
No-shows are smaller than most teams fear but never zero. MeasuringU estimates an average no-show rate of about 8%, typically between 5% and 10%, and over-recruited by about 19% in its own 2024 studies; it recommends planning for 20% over-recruitment (Sauro & Lewis, MeasuringU, 2025). For unmoderated studies, NN/g's Kara Pernice recruits one extra person for every three sessions (Pernice, NN/g, 2020).
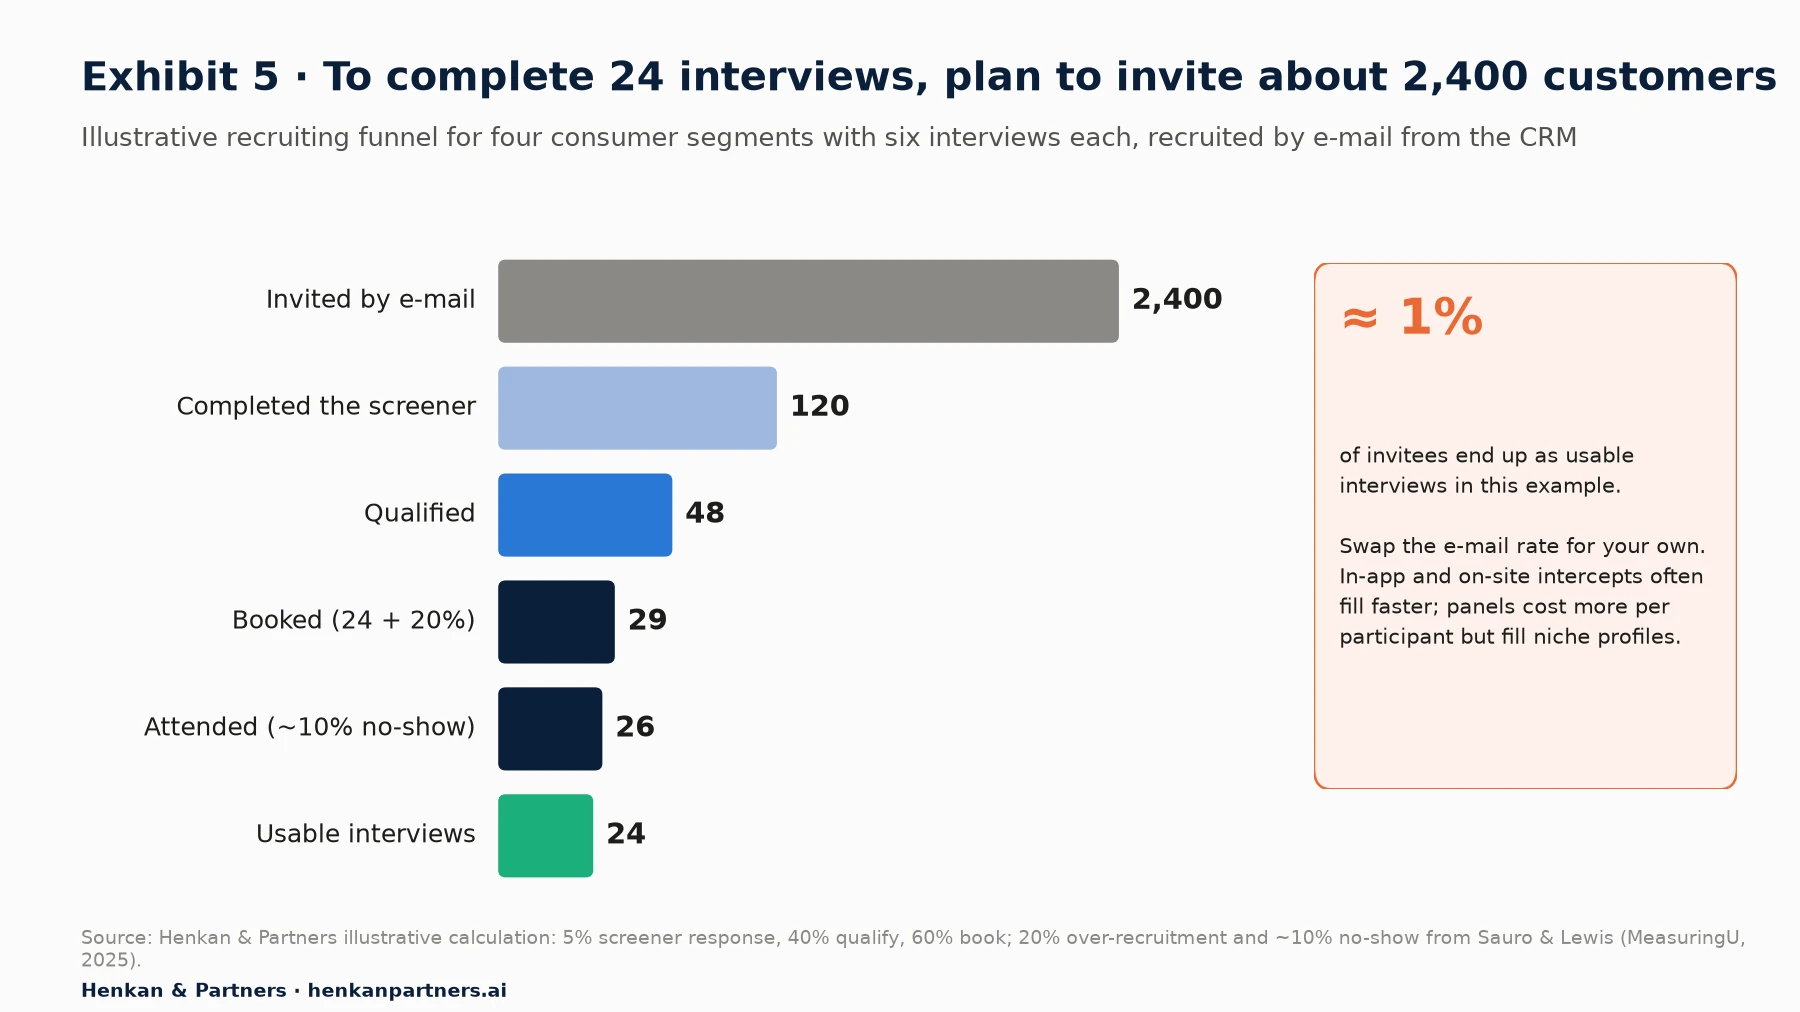
What this shows. Every step of the funnel loses people, so the invitation list is about a hundred times the number of interviews you need in this example. The response and qualification rates are assumptions; replace them with your own after the first round. The two figures to keep are the 20% over-booking and the 10% no-show allowance.
Section 6 · In person or remote
Run most interviews remotely, and go in person when the context is the subject
Video calls have made remote interviews the default, and for good reasons: no travel, a wider and more varied pool of participants, easy recording and easy observation by colleagues. In-person sessions remain better when the environment matters. NN/g notes that in person, facilitators read body language more easily and pick the right moment for follow-up questions, while remotely, 'silence on the other end of the line may mean that the user is confused' (Schade, NN/g, 2013).
| Format | Choose it when | Trade-offs |
|---|---|---|
| Remote moderated (video) | Most customer interviews; national or international samples; screen sharing of the real site or app | Harder to read body language; depends on the participant's connection and setup |
| In person, in the field | The place matters: a store, a club, a warehouse, a franchise outlet; physical products; staff tools | Travel time and cost; fewer sessions per day; smaller geographic spread |
| In person, in a lab or office | Prototypes on specific devices; observers who must watch live | Artificial setting; participants travel to you |
| Remote unmoderated | Short, well-defined usability tasks at speed | No follow-up questions; not suitable for interviews |
For a business with physical locations, a mix works well: most interviews remote, plus one day on site where customers and staff can show you how things really happen. For B2B partners or franchisees, an on-site visit often reveals the workarounds nobody mentions on a call.
Section 7 · Running the interview
A 45-minute interview spends most of its time on one real, recent story
Forty-five minutes is long enough to build rapport and go deep on one or two episodes, and short enough to fit in a lunch break or between meetings. NN/g's six steps frame the preparation: set clear research goals, prepare a guide of a few open questions with follow-ups, pilot it, start with easy questions, build rapport, and probe for specifics (Rosala & Pernice, NN/g, 2023).
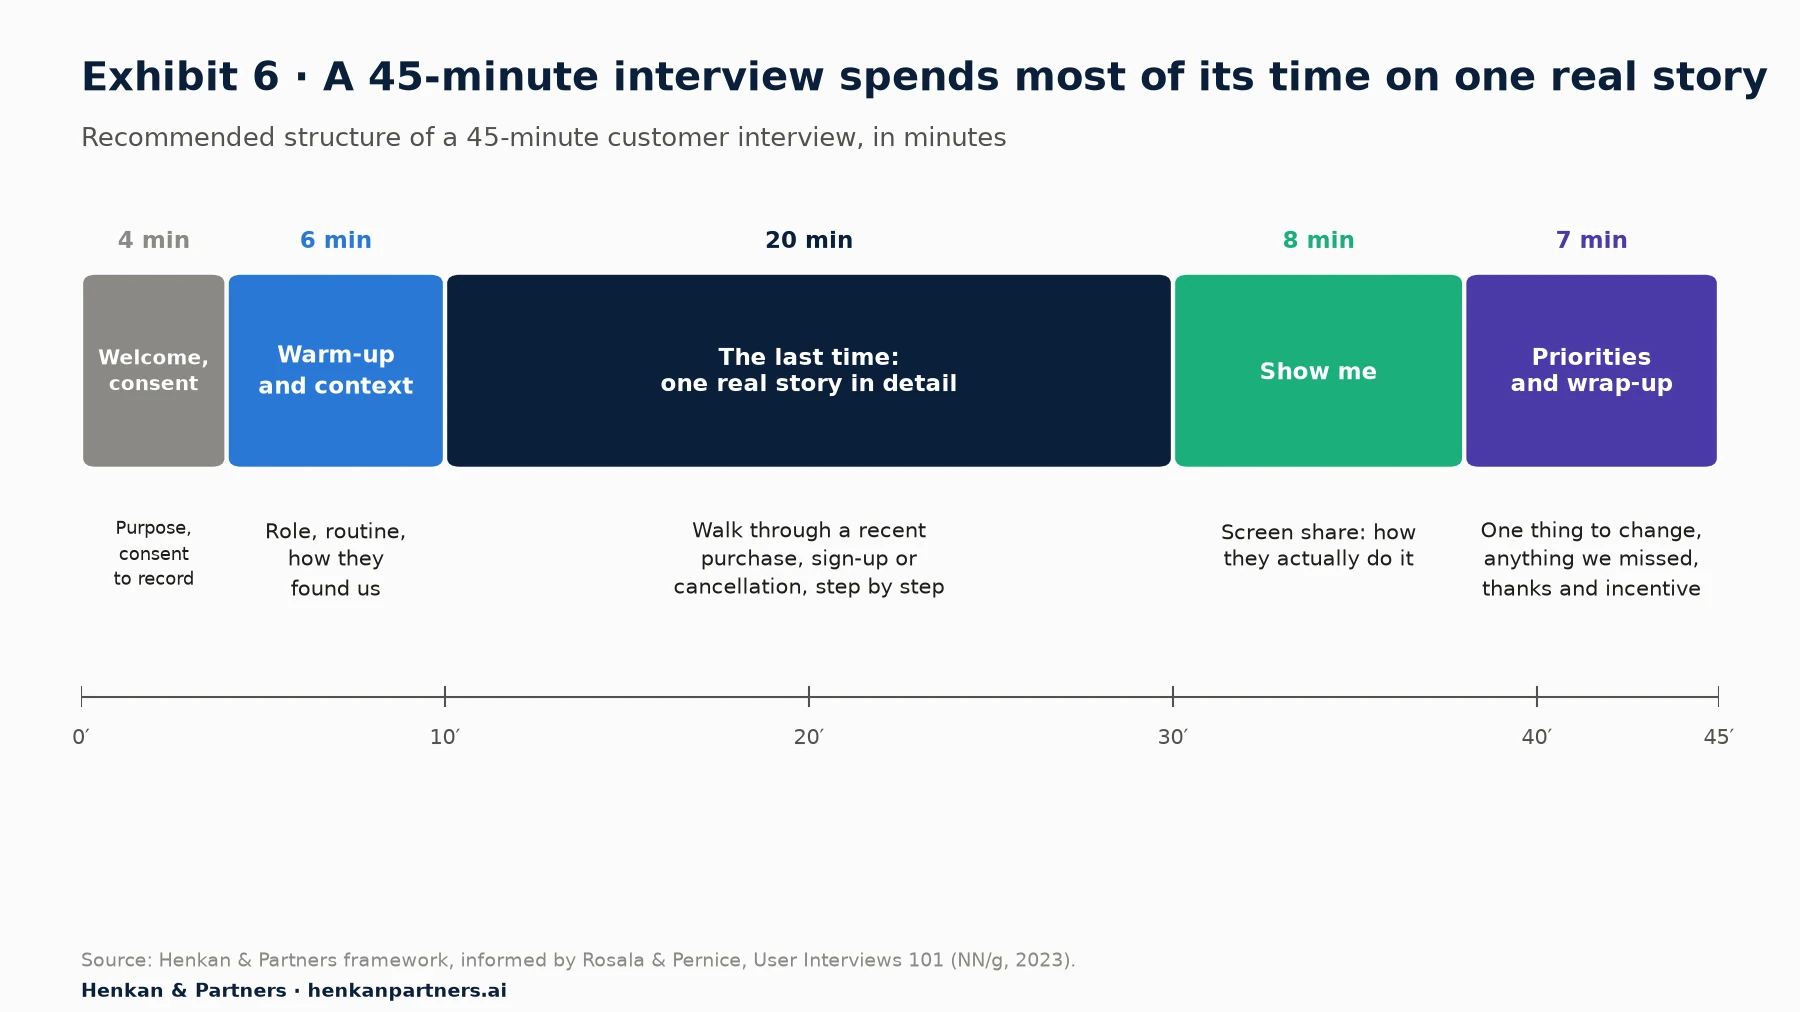
What this shows. Almost half the session goes to a single story: the last time the person bought, signed up, renewed or cancelled. That is where the evidence is. Opinions about features and predictions about the future take up very little time, because they are the least reliable part of any interview.
A sample discussion guide for a subscription business (illustrative)
The guide below is written for an illustrative membership or subscription business interviewing a customer who joined in the last two months. Adapt the core story to each segment: the first purchase for new customers, a typical week for regulars, the cancellation for lapsed customers, the comparison for prospects.
- Welcome and consent (4 minutes). 'Thanks for your time. We are trying to improve how people discover and join the service. There are no right or wrong answers, and you will not hurt anyone's feelings. May I record the session? The recording stays inside our team and is deleted after the study.'
- Warm-up (6 minutes). 'Tell me a little about yourself and how the service fits into your week.' 'Before you joined, what were you doing instead?'
- The last time: joining (20 minutes). 'Take me back to the moment you first thought about joining. What was going on?' 'What did you do next?' 'Which other options did you look at? How did you compare them?' 'Was there a moment when you nearly gave up?' 'What happened on the day you signed up?' 'What did you expect the first week to be like, and how did it compare?'
- Show me (8 minutes). 'Could you share your screen and show me how you would book or change something today?' Watch; ask 'what are you looking for here?' rather than explaining.
- Priorities and wrap-up (7 minutes). 'If you could change one thing about how you joined, what would it be?' 'Is there anything I should have asked and didn't?' Thank the person, explain how the incentive is paid, and ask whether they agree to be contacted again.
Six techniques that separate evidence from opinion
- Ask about specific past events, not general habits. NN/g advises asking 'about specific events rather than about general processes', because a concrete episode jogs memory (Rosala & Pernice, NN/g, 2023). Rob Fitzpatrick's The Mom Test makes the same point for product questions: talk about specifics in the past, not opinions about the future (Fitzpatrick, 2013).
- Never ask people to predict their behaviour. 'Would you use this?' and 'How much would you pay?' produce polite guesses. Ask what they did last time and what it cost them.
- Probe with neutral prompts. 'Tell me more about that.' 'What happened next?' 'Why was that important?' Avoid leading questions such as 'Was the checkout confusing?'
- Let silence work. Count to five before your next question; people often add the most useful detail after a pause.
- Do not sell or defend. If the participant criticises the product, write it down. The interview is a research study, not a sales call (Rosala & Pernice, NN/g, 2023).
- Pilot the guide once. Run it with a colleague or one real customer, then fix the questions that confused them.
Our view. Keep the same core guide for every segment in a round and change only the story you ask about. Comparable questions make synthesis much faster, and they let you see which needs are shared and which belong to one segment.
Section 8 · Notes and synthesis
Interviews are worth what their synthesis produces: a short list of testable changes
A round of interviews produces hours of recordings and pages of notes. Without a method, teams remember the most vivid quote and forget the pattern. Good synthesis has four steps, and each one should leave a written trace.
1. Take notes as observations, not conclusions
Have two people in every session: one moderates, one takes notes. Write one observation per line, with a timestamp, the participant's segment and, where possible, their exact words. Separate what the person said ('I didn't know the first month was free') from your interpretation ('pricing page unclear'). Clean the notes within 24 hours, while memory is fresh, and add them to a shared repository.
2. Code the notes, then cluster codes into themes
Coding means tagging each observation with short labels ('price comparison', 'fear of commitment', 'family schedule'). Braun and Clarke's thematic analysis describes six phases: familiarise yourself with the data, generate initial codes, search for themes, review them, define and name them, and write them up (Braun & Clarke, 2006). Affinity diagramming does the same visually: write observations on notes, group them by theme, label each group and rank them (Krause & Pernice, NN/g, 2024). Count how many participants, and which segments, sit behind each theme.
3. Turn each theme into a hypothesis, and 4. prioritise
A theme becomes useful when it becomes a hypothesis: evidence, change, audience, expected outcome and metric. For example: 'Because five of six new members said they could not tell what the first month included (evidence), showing the first-month content on the pricing page (change) will raise sign-ups among first-time visitors (audience and outcome), measured by sign-up conversion (metric).' Then prioritise by value, evidence and the traffic available to test it. Our guide to turning customer insights into a test backlog covers hypothesis writing and prioritisation frameworks in detail.
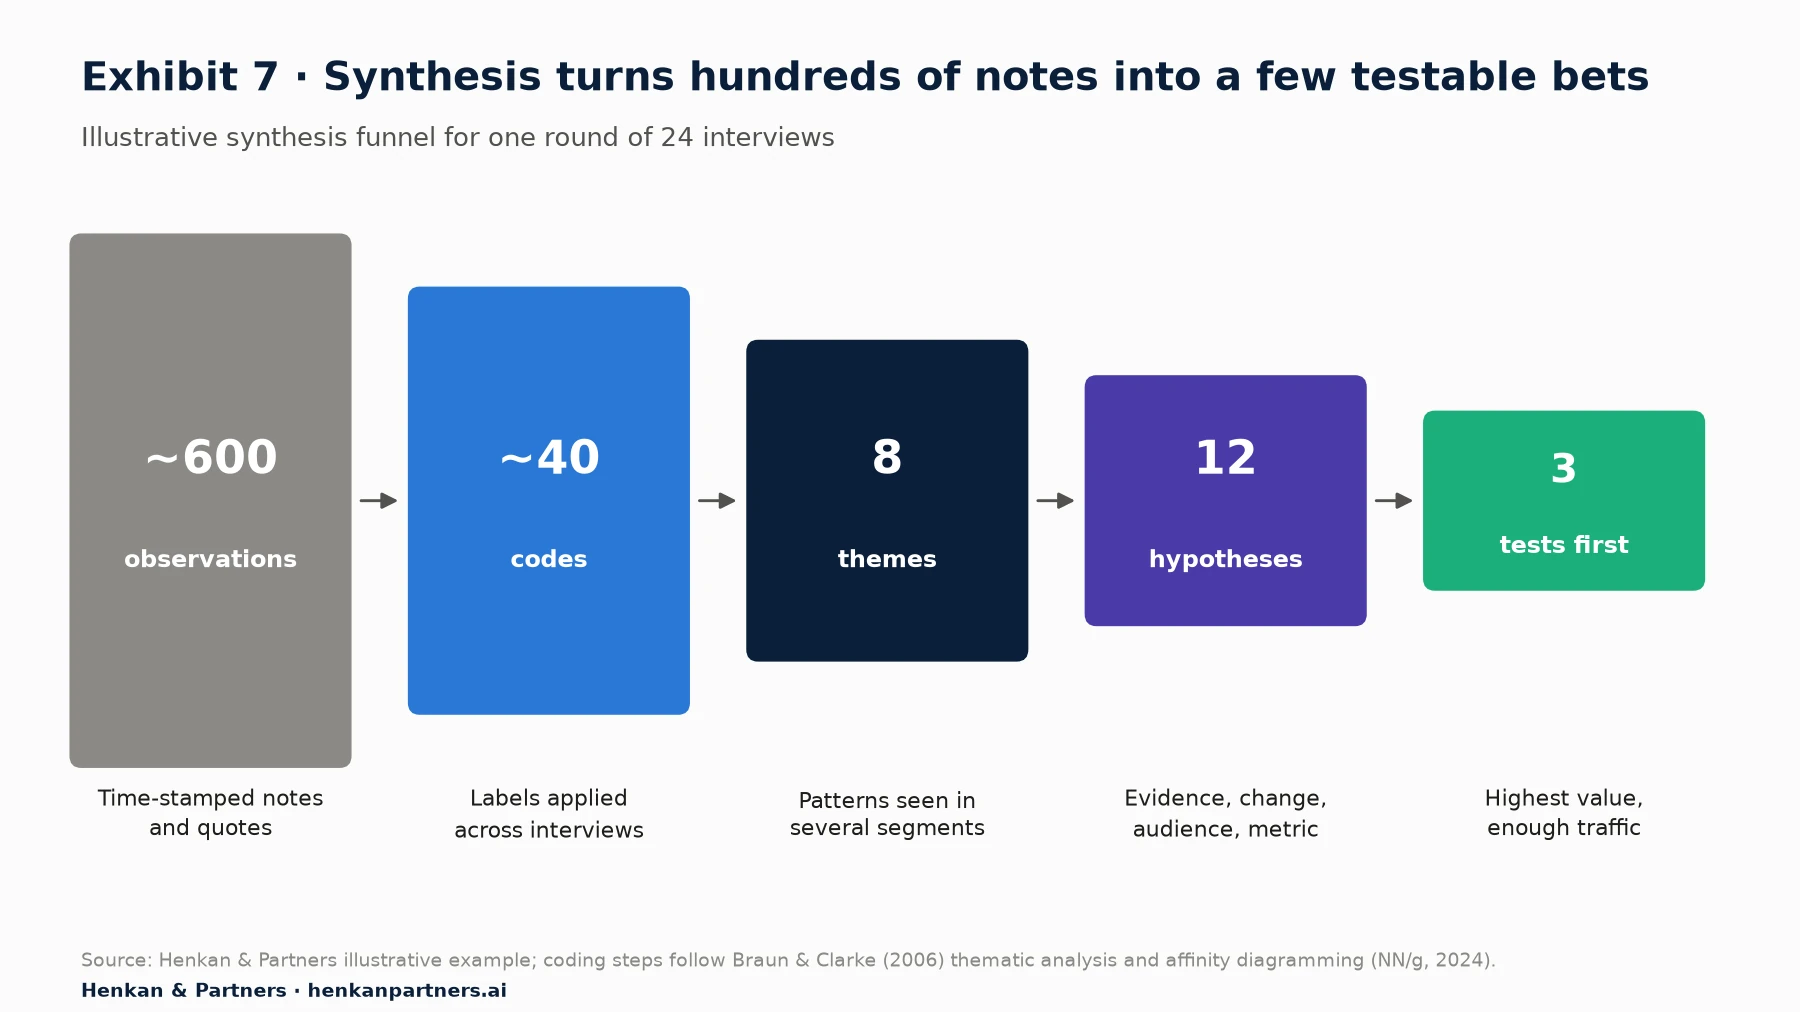
What this shows. The output of a round is not a deck of quotes. It is a short, ranked list of changes with the evidence behind each one. In this illustrative round, 24 interviews give about 25 observations each, 600 in total, which reduce to 8 themes and 12 hypotheses; three go straight into A/B tests, and the others wait for more evidence or for traffic. Interviews tell you what to test; they do not tell you the size of the effect. That is the job of the test.
AI tools now help with the mechanical parts: transcription, first-pass coding and clustering. Treat their output as a draft and check it against the transcripts, as our guide to AI survey analysis explains for open-ended answers. Synthetic personas can help you sharpen a discussion guide, but they cannot replace the interviews themselves; our article on synthetic users sets out where they help and where they mislead.
Section 9 · Cost and time
One interview costs about four hours of team time plus the incentive
The session is the smallest part of the cost. Recruiting, scheduling, note cleaning and synthesis take more time than the 45 minutes on the call. The table below is an illustrative budget for one round of 24 interviews; replace the hourly rate and incentives with your own.
| Item | Time or cost per completed interview | Notes |
|---|---|---|
| Recruiting and scheduling | 1 hour | Screener review, booking, reminders, rescheduling |
| Guide preparation and pilot | 0.25 hour | About 6 hours shared across 24 interviews |
| Session (moderator and note-taker) | 1.5 hours | 45 minutes for two people |
| Note cleaning | 0.5 hour | Within 24 hours of the session |
| Synthesis and backlog | 0.75 hour | About 18 hours shared across 24 interviews |
| Team time, total | 4 hours, about €360 | At an illustrative blended rate of €90 per hour |
| Incentive, own customers | €40 to €60 | Voucher or credit often accepted |
| Incentive, prospects via panel | €50 to €80, plus a panel fee | Panel fees vary widely by provider and profile |
| Incentive, B2B partners | €80 to €150 | Or a non-cash benefit agreed with the network |
| Total per interview | About €400 to €550 | About €10,000 to €13,000 for a round of 24 |
Calendar time matters as much as money. An illustrative round takes three to four weeks: one week to recruit, one to two weeks of sessions, and one week of synthesis. Smaller, continuous research is a good alternative: Teresa Torres defines continuous discovery as 'weekly touch points with customers by the team building the product', conducting 'small research activities in pursuit of a desired outcome' (Torres, Product Talk). Two interviews a week add up to about a hundred a year, with far less recruiting overhead per session.
Section 10 · Common mistakes
Ten mistakes cause most weak interview research, and each has a simple fix
| Mistake | Why it hurts | Fix |
|---|---|---|
| Five users in total for several audiences | Each audience is heard once or twice | Five to eight per segment; cut segments, not depth |
| Using interviews to test a design | People describe what they think they would do | Run a usability test, or a show-me task inside the interview |
| Asking about the future | 'Would you use this?' produces polite guesses | Ask about the last time it happened |
| Interviewing only happy customers | You learn why people stay, not why they leave or never start | Recruit lapsed customers and prospects every round |
| A screener that reveals the answer | Participants say what qualifies them | Open questions about past behaviour; plausible distractors |
| No note-taker | The moderator cannot listen and write at the same time | Two people per session, one observation per line |
| Leading questions | You hear your own hypothesis back | Neutral probes: 'tell me more', 'what happened next?' |
| Reporting quotes instead of patterns | The most vivid story wins the meeting | Count participants and segments behind each theme |
| Treating interview counts as percentages | '4 of 6 said' is not 67% of customers | Use a survey or analytics to size a theme |
| No link to the backlog | Insights fade within weeks | Write hypotheses and prioritise them in the same week |
Section 11 · What to do next
What to do next
1. Write down the decision the research must inform
One sentence: what will you decide differently depending on what you learn? If you cannot write it, you are not ready to recruit. Then choose the method from Table 1.
2. Define your segments from behaviour
Pick three to five segments from your CRM and analytics, with one screener cue for each. Budget five to eight interviews per segment, and more for any segment that is internally diverse.
3. Launch recruiting through two channels
Combine a CRM e-mail with an in-app or on-site invitation, write an open-ended screener, set the incentive and book 20% more sessions than you need.
4. Run the 45-minute guide and synthesise each week
Pilot the guide, run the sessions in pairs, clean notes within a day and code them as you go. Stop a segment when interviews stop adding themes.
5. Turn the themes into tests
Henkan & Partners recruits participants, runs customer interviews and usability tests, and turns the findings into prioritised A/B test backlogs for e-commerce sites and apps, in French, English, Spanish, German and Arabic. Talk to us.
FAQ
Frequently asked questions about user interviews
Frequently asked questions
How many user interviews do you need?
Plan five to eight interviews per segment that behaves differently, and stop a segment when two or three interviews in a row add no new themes. Empirical studies of homogeneous groups reached saturation at about 9 to 17 interviews, with the main themes often visible after six to twelve.
Is it true that you only need to test with 5 users?
Only under specific conditions. Nielsen and Landauer's model says five users find about 84% of the problems that affect 31% of users, for one design, one kind of user and the same tasks. For rarer problems, open tasks or several audiences, five users find much less, so run several rounds of five and test each audience separately.
What is the difference between a user interview and a usability test?
A user interview is a conversation about a person's experiences, needs and decisions; it explains why people act as they do. A usability test watches a person try to use a design and shows where and why they get stuck. Interviews should not be used to judge a design.
How do you recruit participants for user research?
Recruit from where your customers already are: CRM e-mail, in-app or on-site invitations, physical locations, customer service, and research panels for prospects or niche profiles. Use an open-ended screener about past behaviour, pay a fair incentive and book about 20% more sessions than you need.
How much should you pay user interview participants?
User Interviews, a US recruiting platform, recommends about $80 per hour for consumers and $85 per hour for professionals for remote one-to-one interviews, and more for in-person sessions. Adjust for your market, the rarity of the profile and the length of the session.
How long should a user interview be?
Forty-five minutes works well for most customer interviews: enough to build rapport and go deep on one recent story, short enough to fit into a busy day. Sessions that combine an interview with a usability test are usually longer, for example 90 minutes rather than 60.
Should user interviews be remote or in person?
Run most interviews remotely by video, which is cheaper and reaches a wider pool. Go in person when the environment is part of the subject, such as a store, a club, a franchise outlet or a physical product.
How do you analyse user interview notes?
Take notes as time-stamped observations, code them with short labels, cluster the codes into themes with thematic analysis or affinity diagramming, and count which participants and segments sit behind each theme. Then turn each theme into a hypothesis and prioritise it for testing.
Key terms
- User interview
- A one-to-one conversation in which a researcher asks open questions about a participant's experiences, needs and decisions. It matters because it explains why people behave as they do, which analytics cannot.
- Usability test
- A session in which a participant tries to complete tasks with a design while a researcher observes. It matters because it shows where and why people fail, rather than what they say.
- Five-user rule
- Nielsen's guideline that five test users find about 85% of usability problems. It matters because it holds only for problems affecting about 31% of users, one audience and the same tasks.
- Problem discovery rate (L)
- The probability that a single participant encounters a given problem. It matters because the number of users you need depends on it: about 5 at 31%, 18 at 10%.
- Saturation
- The point at which new interviews stop producing new themes. It matters because it, not a fixed number, tells you when a segment has been covered.
- Segment
- A group of users who behave differently from others, such as new, regular or lapsed customers. It matters because each segment needs its own sample.
- Screener
- A short questionnaire that decides who qualifies for a study. It matters because a screener that reveals the target answer fills the study with the wrong people.
- Over-recruitment
- Booking more sessions than needed to cover no-shows and unusable sessions. It matters because about 5% to 10% of participants do not show up.
- Discussion guide
- The list of questions and prompts used in an interview. It matters because a shared guide makes interviews comparable across segments.
- Coding
- Tagging each observation with short labels so that patterns can be counted and compared. It matters because it turns notes into evidence.
- Affinity diagram
- A visual method that groups related observations into labelled clusters. It matters because it lets a team agree on themes together.
- Continuous discovery
- Regular, small research activities, such as weekly customer interviews, run by the team building the product. It matters because it lowers the cost per interview and keeps evidence fresh.
Sources
All sources were checked in October 2026. User Interviews and MeasuringU figures are published by companies that sell research services and are vendor data. Exhibits 1 and 6 and Tables 1, 3, 4, 5 and 7 are Henkan & Partners frameworks; Exhibit 2 and Table 2 are our own calculations from the Nielsen & Landauer formula; Exhibits 4, 5 and 7 and Table 6 are illustrative.
- Nielsen, J. & Landauer, T. K. (1993). A mathematical model of the finding of usability problems. Proceedings of INTERCHI '93, 206–213.
- Nielsen, J. (2000). Why You Only Need to Test with 5 Users. Nielsen Norman Group.
- Nielsen, J. (2001). First Rule of Usability? Don't Listen to Users. Nielsen Norman Group.
- Budiu, R. (2021). Why 5 Participants Are Okay in a Qualitative Study, but Not in a Quantitative One. Nielsen Norman Group.
- Faulkner, L. (2003). Beyond the five-user assumption: Benefits of increased sample sizes in usability testing. Behavior Research Methods, Instruments, & Computers, 35(3), 379–383.
- Spool, J. & Schroeder, W. (2001). Testing web sites: five users is nowhere near enough. CHI '01 Extended Abstracts; as reported in Bastien, J. M. C. (2010), Usability testing: a review of some methodological and technical aspects of the method, International Journal of Medical Informatics.
- Sauro, J. & Lewis, J. R. (2020). Predicting the Number of Usability Problems Using Average Problem Occurrence. MeasuringU.
- Sauro, J. & Lewis, J. R. (2025). How Much Should You Over-Recruit?. MeasuringU (vendor data).
- Guest, G., Bunce, A. & Johnson, L. (2006). How Many Interviews Are Enough? An Experiment with Data Saturation and Variability. Field Methods, 18(1), 59–82.
- Hennink, M. M., Kaiser, B. N. & Marconi, V. C. (2017). Code Saturation Versus Meaning Saturation: How Many Interviews Are Enough?. Qualitative Health Research, 27(4), 591–608.
- Hennink, M. & Kaiser, B. N. (2022). Sample sizes for saturation in qualitative research: A systematic review of empirical tests. Social Science & Medicine, 292.
- Rosala, M. & Pernice, K. (2023). User Interviews 101. Nielsen Norman Group.
- Rohrer, C. (2022). When to Use Which User-Experience Research Methods. Nielsen Norman Group.
- Whitenton, K. (2019). Screening Participants for User Research. Nielsen Norman Group.
- Pernice, K. (2020). Recruit Backup Users in Research. Nielsen Norman Group.
- Schade, A. (2013). Remote Usability Tests: Moderated and Unmoderated. Nielsen Norman Group.
- Krause, R. & Pernice, K. (2024). Affinity Diagramming. Nielsen Norman Group.
- Braun, V. & Clarke, V. (2006). Using thematic analysis in psychology. Qualitative Research in Psychology, 3(2), 77–101.
- User Interviews (2025). The UX Research Incentives Report (vendor data).
- Torres, T. (n.d.). Continuous Discovery. Product Talk; from Continuous Discovery Habits (2021).
- Fitzpatrick, R. (2013). The Mom Test: How to talk to customers and learn if your business is a good idea when everyone is lying to you.
- Henkan & Partners. Discovery curves, sample sizes and segment probabilities (formulas as stated in the article); illustrative sample plan, recruiting funnel, synthesis funnel and cost table.