Focus
A/B Test Sample Size and Duration: How to Calculate Them and What to Do with Low Traffic
Alexandre Suon · 2026-09-29
Every A/B test needs two numbers before it starts: how many visitors it must see, and how long that will take. This lesson shows how to calculate A/B test sample size from four inputs, with a fully worked example, how to turn it into how long to run an A/B test, what lift your traffic can realistically detect, and what to do when you do not have enough traffic.
Executive summary
- Sample size is set by four inputs, and the effect you want to detect matters most. The inputs are your baseline conversion rate, the minimum detectable effect (MDE), the significance level and the statistical power. Halving the MDE from 10% to 5% multiplies the sample by about four (53,208 to 207,936 visitors per group at a 3% baseline).
- The standard two-proportion formula can be worked by hand in five minutes. At a 3% conversion rate, detecting a 10% relative lift (3.0% to 3.3%) with 95% significance and 80% power needs 53,208 visitors per group, 106,416 in total. Kohavi's rule of thumb, n ≈ 16σ²/δ², gives 51,733.
- Duration is the total sample divided by the traffic that actually enters the test, rounded up to whole weeks. With 6,000 eligible visitors a day the example needs 17.7 days, so you run 21. Sending only half the traffic into the test, or adding two more variants, pushes the same test to six or seven weeks.
- Run full weekly cycles: at least one week, preferably two, then multiples of a week. Kohavi and colleagues, Optimizely, Wingify (VWO), AB Tasty and Kameleoon all set the floor at one or two full weeks. In Georgiev's dataset of 1,001 tests (vendor data), the median test ran 30 days.
- Work backwards from your traffic to the lift you can afford to detect. A 4-week test at a 3% baseline can detect about 11.6% with 20,000 visitors a week, 5.1% with 100,000 and 2.3% with 500,000. The median planned MDE in Georgiev's dataset was 6%, which needs about 72,500 visitors a week for four weeks.
- With low traffic, change the test rather than the statistics. Bolder changes, metrics closer to the change, pooled pages and fewer variants save far more traffic than any engine: detecting a 20% lift instead of 10% cuts the sample by 74%. Sequential and Bayesian methods help at the margin but cannot create evidence that is not there.
Section 1 · Why sample size comes first
A test can only find the effects it was built to find, so size it before you launch
A/B test sample size is the number of visitors (or users, or sessions) each version of a test must receive so that, if the change really improves the metric by at least a chosen amount, the test has a high chance of showing a statistically significant result. Test duration is the time your traffic takes to supply that sample.
Imagine you test a new product page and after ten days the variation is up 4%, but the result is "not significant". Is the change useless, or did the test simply not see enough visitors? Without a sample size calculated in advance, nobody can tell. The test was never designed to detect a 4% lift, so its silence means nothing.
A sample size calculation answers three questions before a single visitor is exposed: can this page support a test at all, how long must it run, and what is the smallest effect it can reliably detect? It also protects the result afterwards. Evan Miller's advice, written in 2010 and still cited, is to "decide on a sample size in advance and wait until the experiment is over" before believing the numbers. If you stop when the dashboard turns green, the error rates printed by your tool no longer apply.
This article is Lesson 3 of the Henkan Academy course A/B Testing Fundamentals. It builds on our essential guide to A/B testing, which covers the full test process, and on our introduction to A/B testing statistics, which explains p-values, confidence intervals and the main statistical models. Here we stay on one practical job: sizing a test and setting its duration.
For marketers. Before any test goes live, write down four numbers: the baseline rate, the smallest lift worth detecting, the visitors needed per group and the end date. If the end date is more than about six weeks away, change the test, not the plan.
For leaders. Ask for the sample size and end date at the test review, not at the results meeting. A "flat" result from a test that could only have detected a 30% lift is not evidence that the idea failed.
Section 2 · The four inputs
Four inputs set the sample size, and the minimum detectable effect matters most
Every sample size calculator, from Evan Miller's free tool to the planners built into Optimizely, Kameleoon and Wingify, asks for some version of the same four things. Here is what each one means in plain words.
1. Baseline conversion rate: where you start
The baseline is the current value of your primary metric for the visitors who will enter the test, for example 3% of product page visitors buy. Take it from your analytics for the same page, device mix and season, over at least the last four weeks. Lower baselines need more traffic because rare events are noisy: at the same 10% relative MDE, a 1% baseline needs 163,092 visitors per group, against 53,208 at 3% and 31,231 at 5%.
2. Minimum detectable effect: the smallest lift worth finding
The minimum detectable effect (MDE) is the smallest true change your test is designed to catch reliably. It is a business decision, not a statistical one: what is the smallest lift that would justify building, shipping and maintaining this change? It can be stated in two ways, and mixing them up is one of the most common planning errors.
| Relative MDE | Absolute MDE | |
|---|---|---|
| Definition | Change as a percentage of the baseline | Change in percentage points |
| Example at a 3% baseline | 10% relative: 3.0% to 3.3% | 0.3 points: 3.0% to 3.3% |
| Same test, other reading | 1 point absolute = 33% relative | 10% relative = 0.3 points |
| Who uses it | Optimizely's MDE is relative; most e-commerce teams talk in relative lifts | Evan Miller's calculator offers both; statistics textbooks use absolute differences |
The MDE drives the sample size more than anything else because the sample grows with the inverse of its square. Halve the MDE and you need about four times the visitors; double it and you need about a quarter. At a 3% baseline, a 5% relative MDE needs 207,936 visitors per group, a 10% MDE needs 53,208 and a 20% MDE needs 13,911.
3. Significance level: how often you accept a false alarm
The significance level, written α (alpha), is the false positive rate you accept when there is no real difference. The usual choice is 5%, shown in tools as "95% significance" or "95% confidence". A stricter 99% level makes false wins rarer but needs more traffic (79,172 per group in our example); a looser 90% level needs less (41,912). Optimizely's default is 90%. In Georgiev's analysis of 1,001 tests, most thresholds sat between 80% and 95%.
4. Statistical power: how often you catch a real win
Power is the probability that the test shows a significant result when the true effect is at least the MDE. The convention is 80%, which means that one real winner in five of exactly MDE size will be missed. Raising power to 90% costs about a third more traffic (71,230 per group). Georgiev reports that most tests in his dataset were powered at 80% and roughly a third at 90%. Wingify's planning documentation explains power with a 90% example. Kohavi, Deng and Vermeer recommend that platforms discourage underpowered experiments. When such tests do reach significance, they tend to exaggerate the true effect, as our A/B testing mistakes article shows.
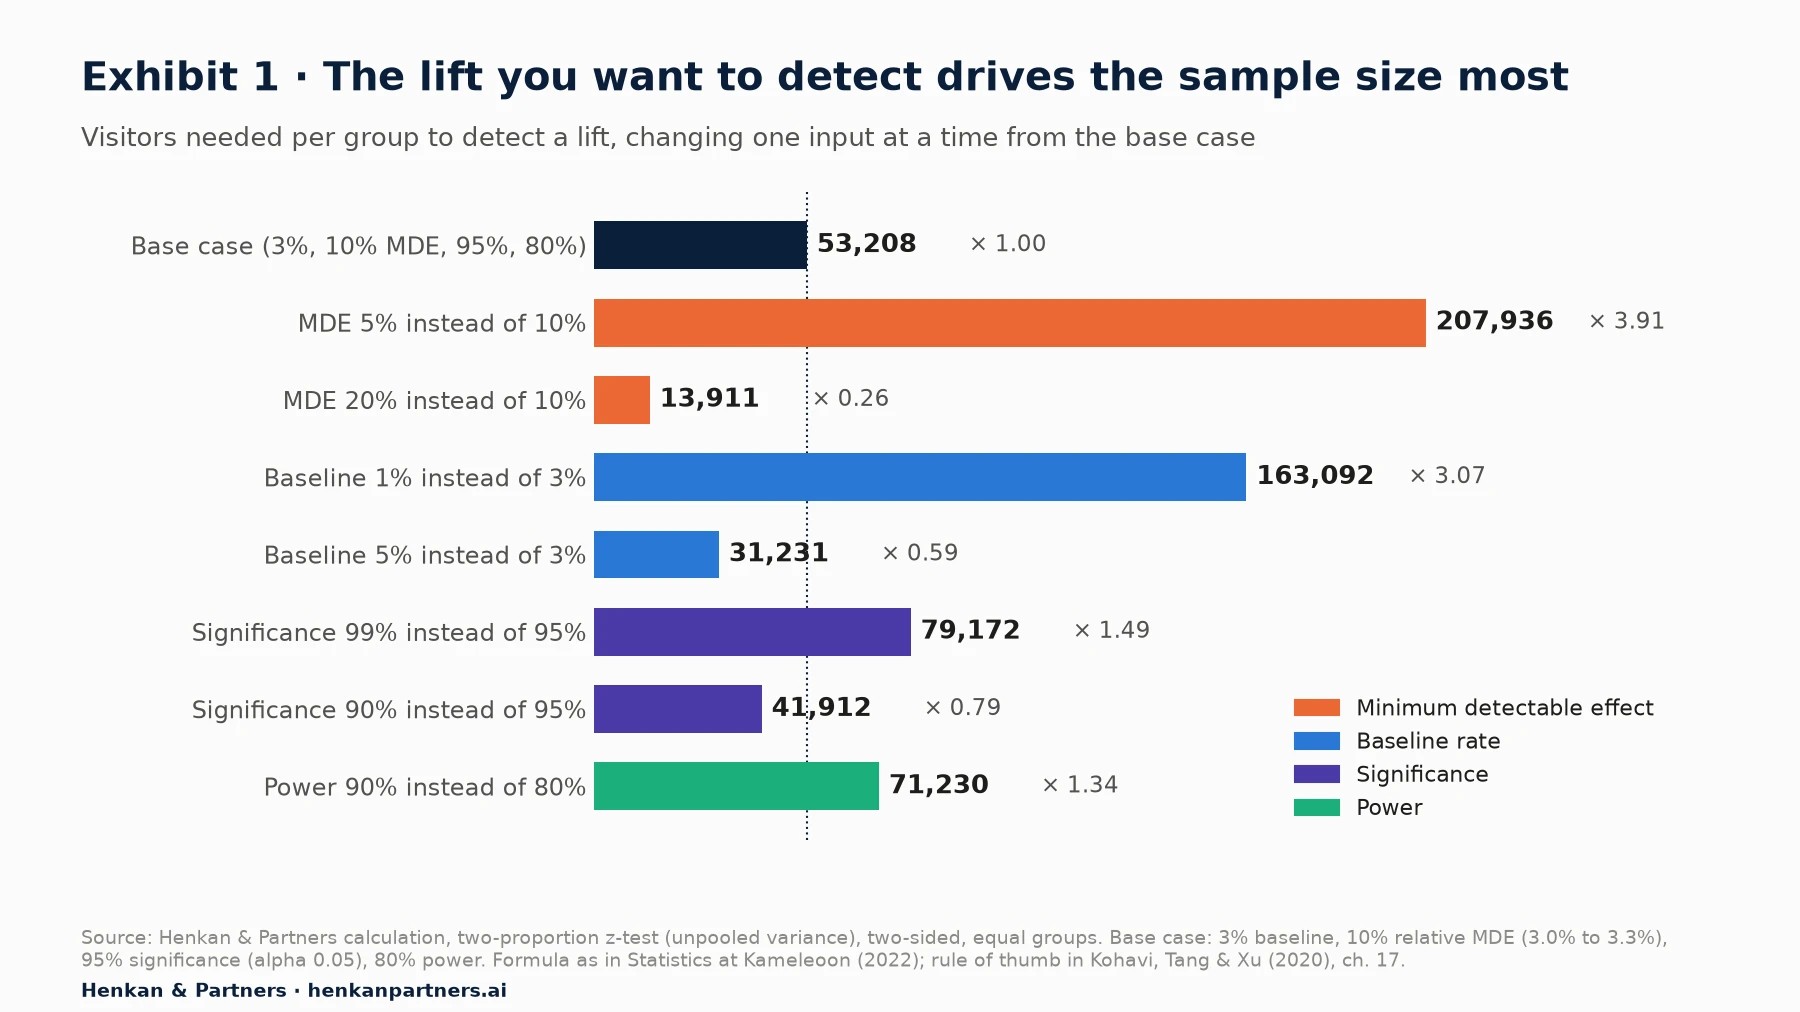
What this shows. Changing the MDE moves the sample by a factor of about four in either direction; changing significance or power moves it by a third to a half. That is why the most useful planning conversation is about the size of the change, not the confidence level. If a page cannot support the MDE you care about, lowering the significance level will not rescue it.
Section 3 · The formula
The standard formula can be worked by hand in five minutes, and your tool should give a similar answer
For a conversion rate, the most common planning formula compares two proportions. It is the version Kameleoon documents in its 2022 statistics paper, and the one behind most free calculators. For two groups of equal size:
n per group = (z₁₋α/₂ + z₁₋β)² × [p₁(1 − p₁) + p₂(1 − p₂)] ÷ (p₂ − p₁)²

p₁ = baseline conversion rate
p₂ = conversion rate you want to be able to detect = p₁ × (1 + relative MDE)
z₁₋α/₂ = 1.96 for 95% significance, two-sided
z₁₋β = 0.84 for 80% power
Worked example: a product page at 3% conversion
Your product page converts at 3%. You want to detect a 10% relative lift, so from 3.0% to 3.3%, with 95% significance and 80% power. Here is the calculation, step by step.
- Set the rates. p₁ = 0.030 and p₂ = 0.030 × 1.10 = 0.033. The absolute difference δ = 0.003 (0.3 percentage points), so δ² = 0.000009.
- Add the two z-values and square them. 1.960 + 0.842 = 2.802 (2.8016 with unrounded z-values); squared, 7.849. This factor depends only on significance and power, so it is the same for every test planned at 95% and 80%.
- Add the two variances. p₁(1 − p₁) = 0.03 × 0.97 = 0.0291 and p₂(1 − p₂) = 0.033 × 0.967 = 0.031911. The sum is 0.061011.
- Multiply and divide. 7.849 × 0.061011 ÷ 0.000009 = 53,207.6. Round up: 53,208 visitors per group, or 106,416 for control plus one variation.
Kohavi, Tang and Xu give a shortcut in Trustworthy Online Controlled Experiments (p. 189): n ≈ 16σ²/δ² per group, where σ² is the variance of the metric and δ the difference to detect. The 16 is roughly (1.96 + 0.84)² × 2 and bakes in 95% significance and 80% power; Kohavi's 2009 survey adds that replacing 16 by 21 raises power to 90%. For a conversion rate, σ² = p(1 − p), so 16 × 0.0291 ÷ 0.000009 = 51,733 per group, within 3% of the full formula. Use it for quick checks in meetings.
Different calculators can disagree by a few per cent for the same inputs because they use slightly different versions of the formula: pooled or unpooled variance, one-sided or two-sided tests, or a correction for small samples. Evan Miller's calculator, for example, lets you choose a relative or absolute MDE and defines power as the percentage of time the minimum effect is detected, "assuming it exists". Small differences do not matter. Differences of 30% or more usually mean one tool is set to a one-sided test, 90% significance, a sequential method or an absolute MDE.
Our view. Keep the calculation in a spreadsheet or a few lines of code that the whole team can read, and store it with the test plan. AI assistants are good at explaining the formula and drafting the plan, but language models can make arithmetic slips. Ask the assistant to write and run the code, or check its answer against a calculator, as we explain in our A/B testing statistics article.
Section 4 · From sample size to duration
Duration is the total sample divided by the traffic that actually enters the test
Once you know the visitors needed per group, three facts about your traffic turn it into days. Optimizely's documentation puts it simply: total sample size is the number of variations multiplied by the sample size per variation, and the number of weeks is the total sample size divided by weekly unique visitors.
Days = (visitors per group × number of groups) ÷ (daily eligible visitors × share of traffic in the test)
Then round up to whole weeks.
- Daily eligible visitors. Count only visitors who can see the change: those who reach the tested page, on the targeted devices, in the targeted markets, and who gave any required consent. A checkout test on a site with 50,000 daily sessions may have only 4,000 eligible visitors a day.
- Share of traffic in the test (allocation). If only half of eligible visitors enter the experiment, the test takes twice as long. Reduce allocation only for a genuine reason, such as a risky change you want to ramp up slowly.
- Number of groups. Every extra variation needs its own full sample. It also multiplies the number of comparisons with the control, so the significance level for each comparison should be tightened, which raises the sample per group again.
Back to the example. With 6,000 eligible visitors a day, all of them in the test, control plus one variation needs 106,416 visitors: 17.7 days, rounded up to 21 days. Put only 50% of traffic into the test and it takes 35.5 days, or 42. Test two variations against the control, splitting the 5% significance level across two comparisons (a Bonferroni correction), and you need 64,435 visitors per group, 193,305 in total: 32.2 days, or 35. Three variations need 70,971 per group and 283,884 in total: 47.3 days, or 49.
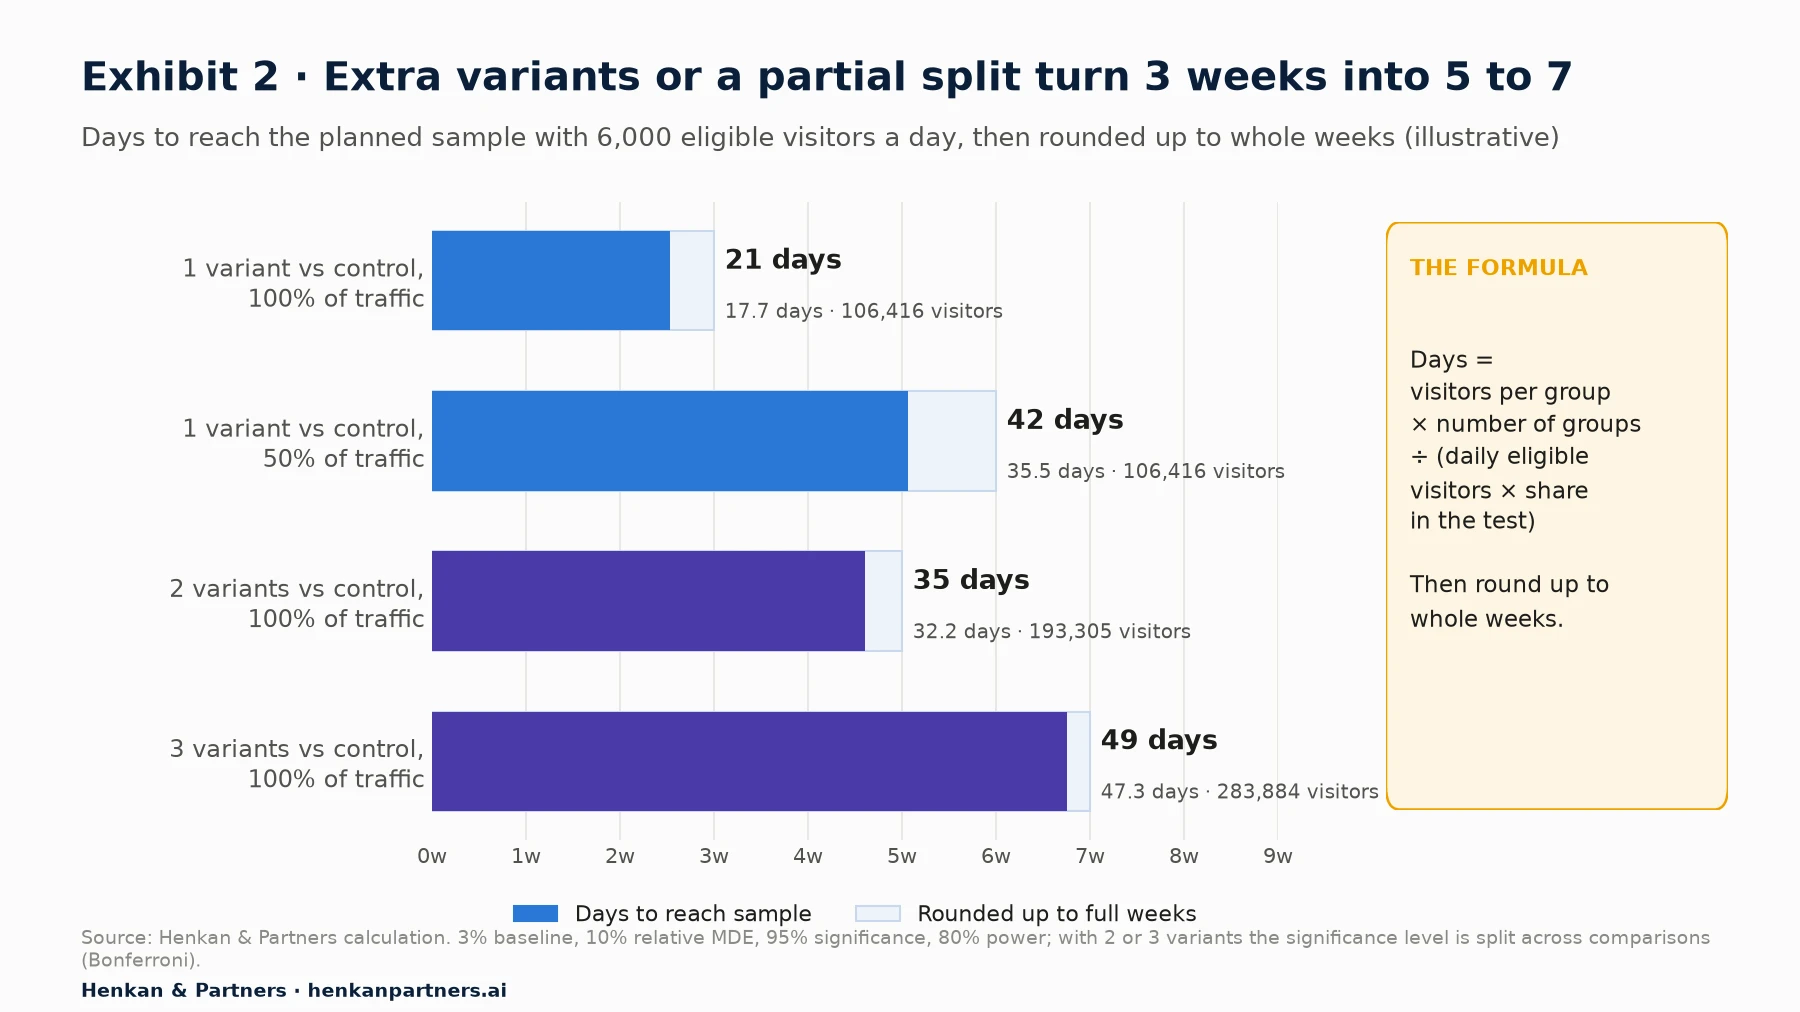
What this shows. The same idea can take three weeks or seven depending on two set-up choices. Most of the extra time comes from the extra groups, not from the stricter significance level. When traffic is tight, test one strong variation and keep the others for the next round.
Section 5 · How long to run an A/B test
How long to run an A/B test: whole weeks, at least one and preferably two, with a planned end date
Reaching the sample size is necessary but not enough. Shoppers behave differently on a Monday lunchtime and a Saturday evening, at the start and end of the month, and in the week after payday. A test that reaches its sample in five days has only seen part of that cycle, and its result may not hold across a whole week.
The main sources agree on the floor, if not the exact number. Kohavi and colleagues' 2009 survey of controlled experiments recommends "running experiments for at least a week or two, then continuing by multiples of a week so that day-of-week effects can be analyzed". Optimizely tells customers to run "a minimum of one business cycle (seven days)". Wingify's help centre calls 7 days "a common recommendation". An AB Tasty guide from 2023 says the average recommended duration is two weeks, over one and ideally two business cycles. Kameleoon's 2026 guidance is at least two business cycles, usually two to four weeks.
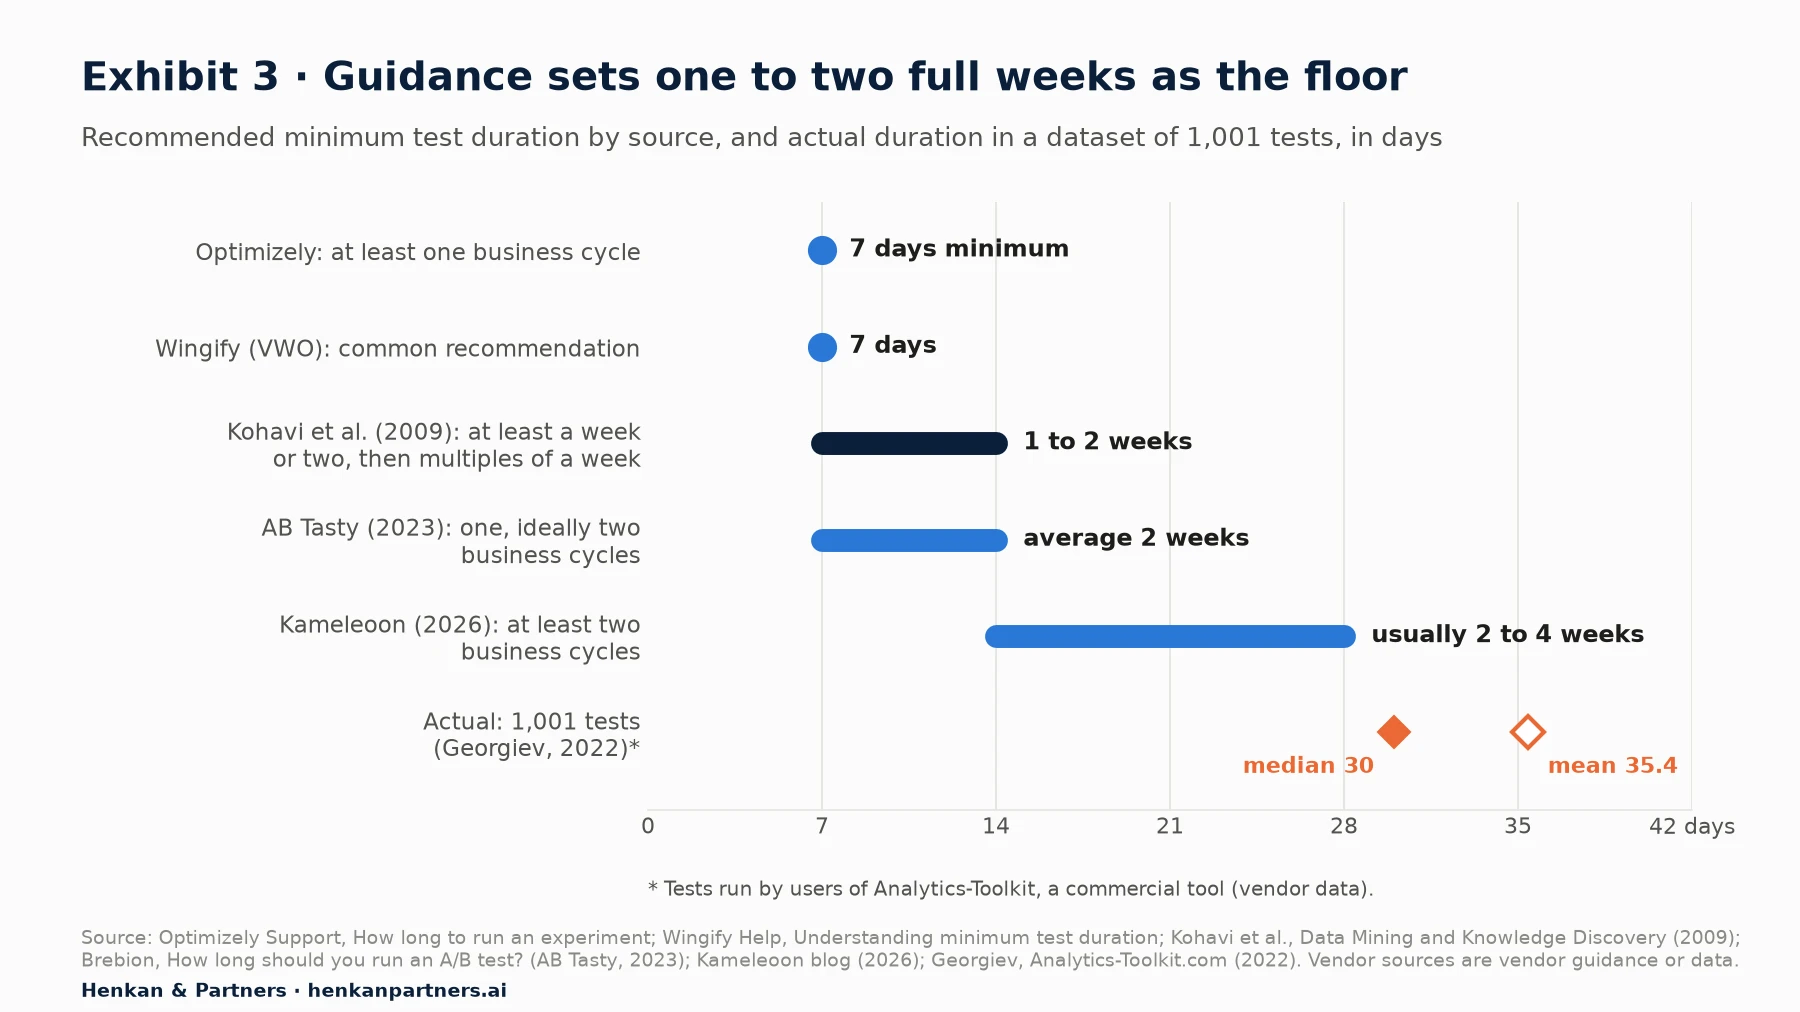
What this shows. Every source sets the floor at one or two full weeks, and none recommends stopping mid-week. In practice tests run longer: in Georgiev's dataset of tests planned with Analytics-Toolkit, the median ran 30 days and the mean 35.4. A test that needs less than a week of traffic should still run a full week; a test that needs ten weeks is usually a sign the MDE is unrealistic.
Why tests should not run too long either
Long tests carry their own risks. Visitors clear cookies or switch devices and come back as new visitors, possibly in the other group. Since 2019, Safari's Intelligent Tracking Prevention has capped cookies created by JavaScript through document.cookie at seven days, which affects client-side tools that store the assignment that way. Promotions, stock-outs, competitor moves and seasonal peaks accumulate. And every extra week delays the next test.
Our view. In our experience, a planned duration of two to six whole weeks is the practical window for most e-commerce tests. Plan the end date before launch, write it in the test plan and do not move it because the result looks promising or disappointing. Avoid starting or ending inside a major promotion such as Black Friday unless the test is about that promotion.
A novelty effect is a second reason for full weeks. Returning visitors may click on a new design because it is new, not because it is better, and the lift fades. The first days of a test also contain the most noise, as our A/B testing statistics article shows with simulated tests of identical pages. Two full weeks let you check whether the effect is stable from the first week to the second.
Section 6 · The MDE you can afford
Work backwards from your traffic to the smallest lift you can afford to detect
The textbook order is: choose the MDE, calculate the sample, derive the duration. In practice most teams have a fixed amount of traffic and a maximum duration, so it is more useful to run the calculation in reverse: given my weekly traffic and a four-week test, what is the smallest lift I can detect? If that number is larger than any lift your idea could plausibly deliver, the test is not worth running in that form.
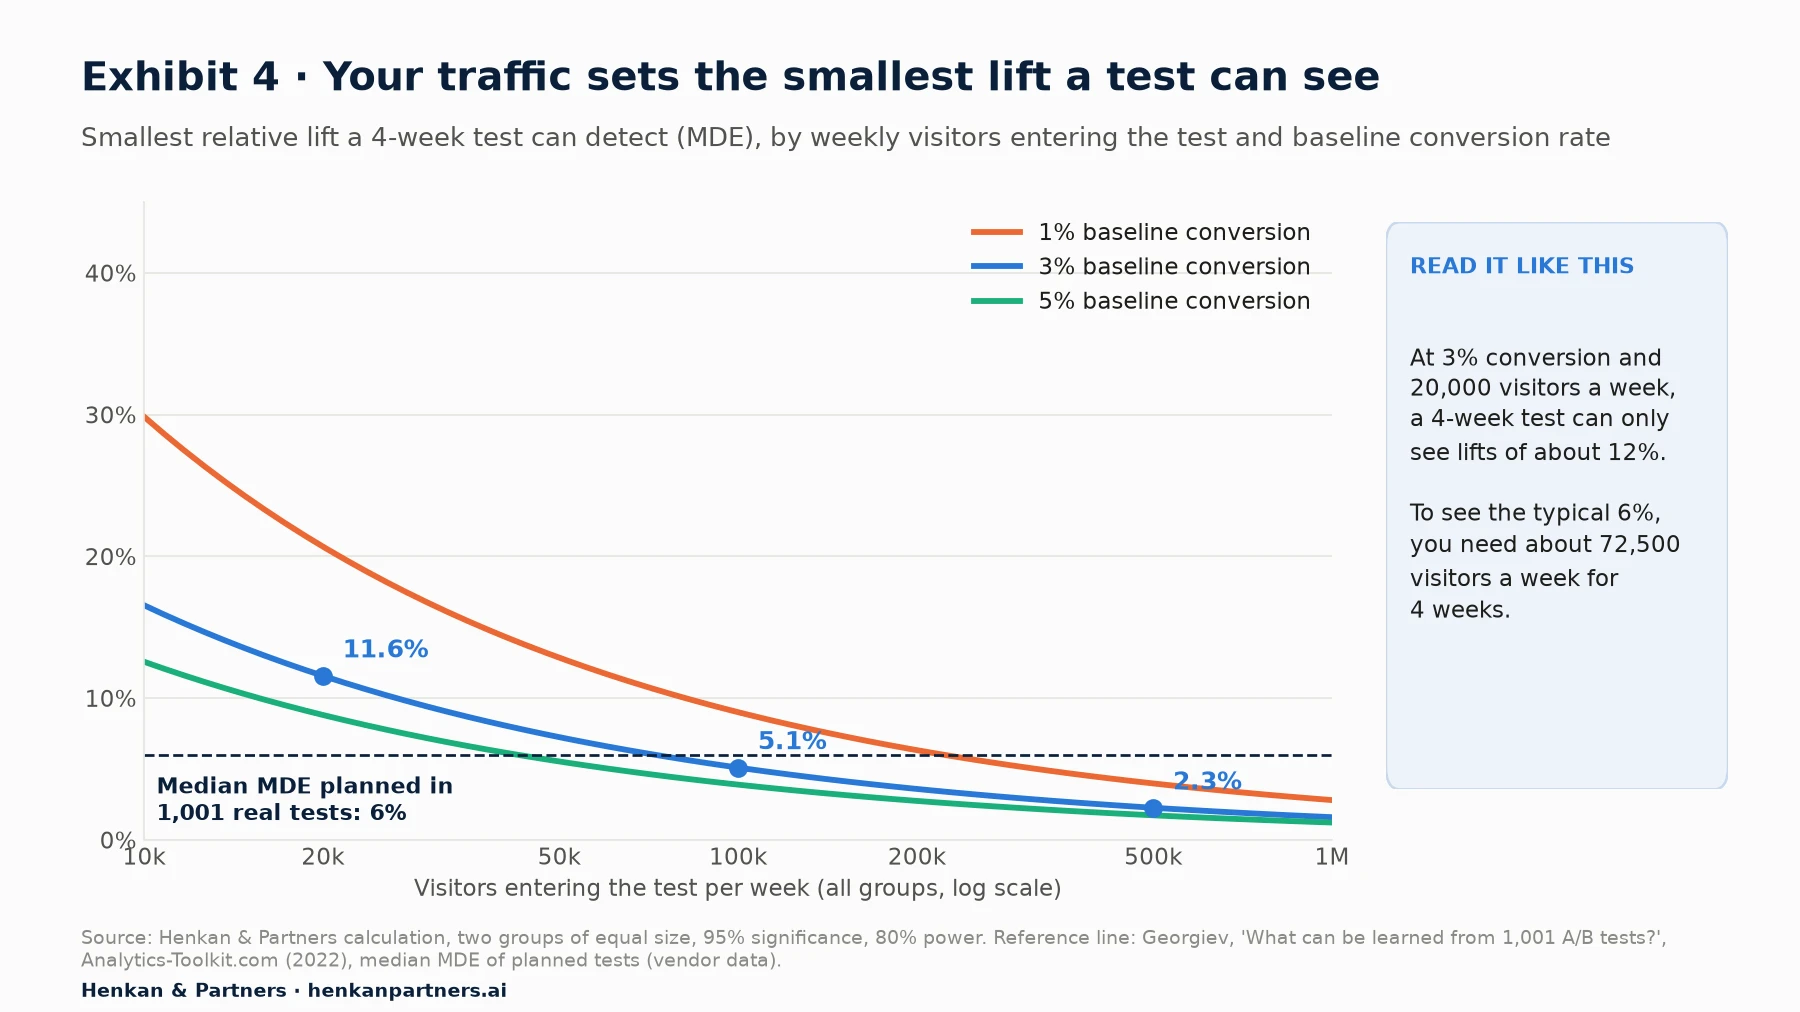
What this shows. MDE falls slowly with traffic: to halve it you need four times the visitors. At a 3% baseline, a page with 20,000 visitors a week can only detect lifts of about 12% in four weeks. Reaching the 6% median planned MDE in Georgiev's dataset takes about 72,500 visitors a week. At a 1% baseline, even 100,000 visitors a week only gets you to 9.0%.
| Visitors entering the test per week | 3% baseline, 2 weeks | 3% baseline, 4 weeks | 1% baseline, 4 weeks | 5% baseline, 4 weeks |
|---|---|---|---|---|
| 10,000 | 23.8% | 16.6% | 29.9% | 12.6% |
| 20,000 | 16.6% | 11.6% | 20.7% | 8.8% |
| 50,000 | 10.3% | 7.2% | 12.9% | 5.5% |
| 100,000 | 7.2% | 5.1% | 9.0% | 3.9% |
| 200,000 | 5.1% | 3.6% | 6.3% | 2.7% |
| 500,000 | 3.2% | 2.3% | 4.0% | 1.7% |
| 1,000,000 | 2.3% | 1.6% | 2.8% | 1.2% |
What lift is realistic?
Choosing an MDE means guessing how big real effects tend to be, and the honest answer is: smaller than most people hope. Georgiev's analysis of 1,001 tests run with Analytics-Toolkit (vendor data) found a median planned MDE of 6% and a mean of 11.3%, while the lifts actually observed were far smaller: a median of 0.08% across all tests, and 7.5% among the 33.5% of tests that produced a significant winner. Our A/B testing mistakes article explains why winning lifts overstate the truth. Kohavi, Deng and Vermeer's general guidance is that A/B tests are useful to detect effects of reasonable size when you have "at least, thousands of active users, preferably tens of thousands".
Two practical rules follow. First, set the MDE from the business case: if the change costs €40,000 to build and run, what lift pays that back within a year? Second, match the MDE to the size of the change. A new headline rarely moves purchases by 10%; a redesigned checkout or a new delivery promise might. Our test backlog guide explains how to use research to find the bigger levers.
For leaders. If your key pages have tens of thousands of visitors a week, not hundreds of thousands, the test programme should be built around fewer, bolder tests. Measuring a test programme by the number of tests launched rewards exactly the small, undetectable changes your traffic cannot support.
Section 7 · Revenue and other continuous metrics
Revenue metrics need about three times the traffic, because variance sets the sample
Conversion rate is a yes-or-no metric, and its variance is fixed by the rate itself: p(1 − p). Revenue per visitor (RPV), average order value or items per order are continuous metrics, and their variance must be estimated from your own data. The formula keeps the same shape:
n per group = 2 × (z₁₋α/₂ + z₁₋β)² × σ² ÷ δ²

σ = standard deviation of the metric per visitor (from historical data)
δ = absolute difference to detect (e.g. 10% of the current RPV)
Revenue per visitor is very noisy. Most visitors spend nothing and a few spend a lot, so the standard deviation is typically many times the mean. In an illustrative simulation of 2 million visitors, 3% of whom buy with a log-normal order value (median 54 euros, mean 100 euros), RPV averaged 2.99 euros with a standard deviation of 31.5 euros. Detecting a 10% lift in RPV needs 174,631 visitors per group, 3.3 times the 53,208 needed for the same relative lift in conversion. Kohavi and colleagues' 2009 survey gives a similar example: switching the metric from revenue to conversion rate cut the users needed from over 409,000 to under 122,000, a factor of about 3.4.
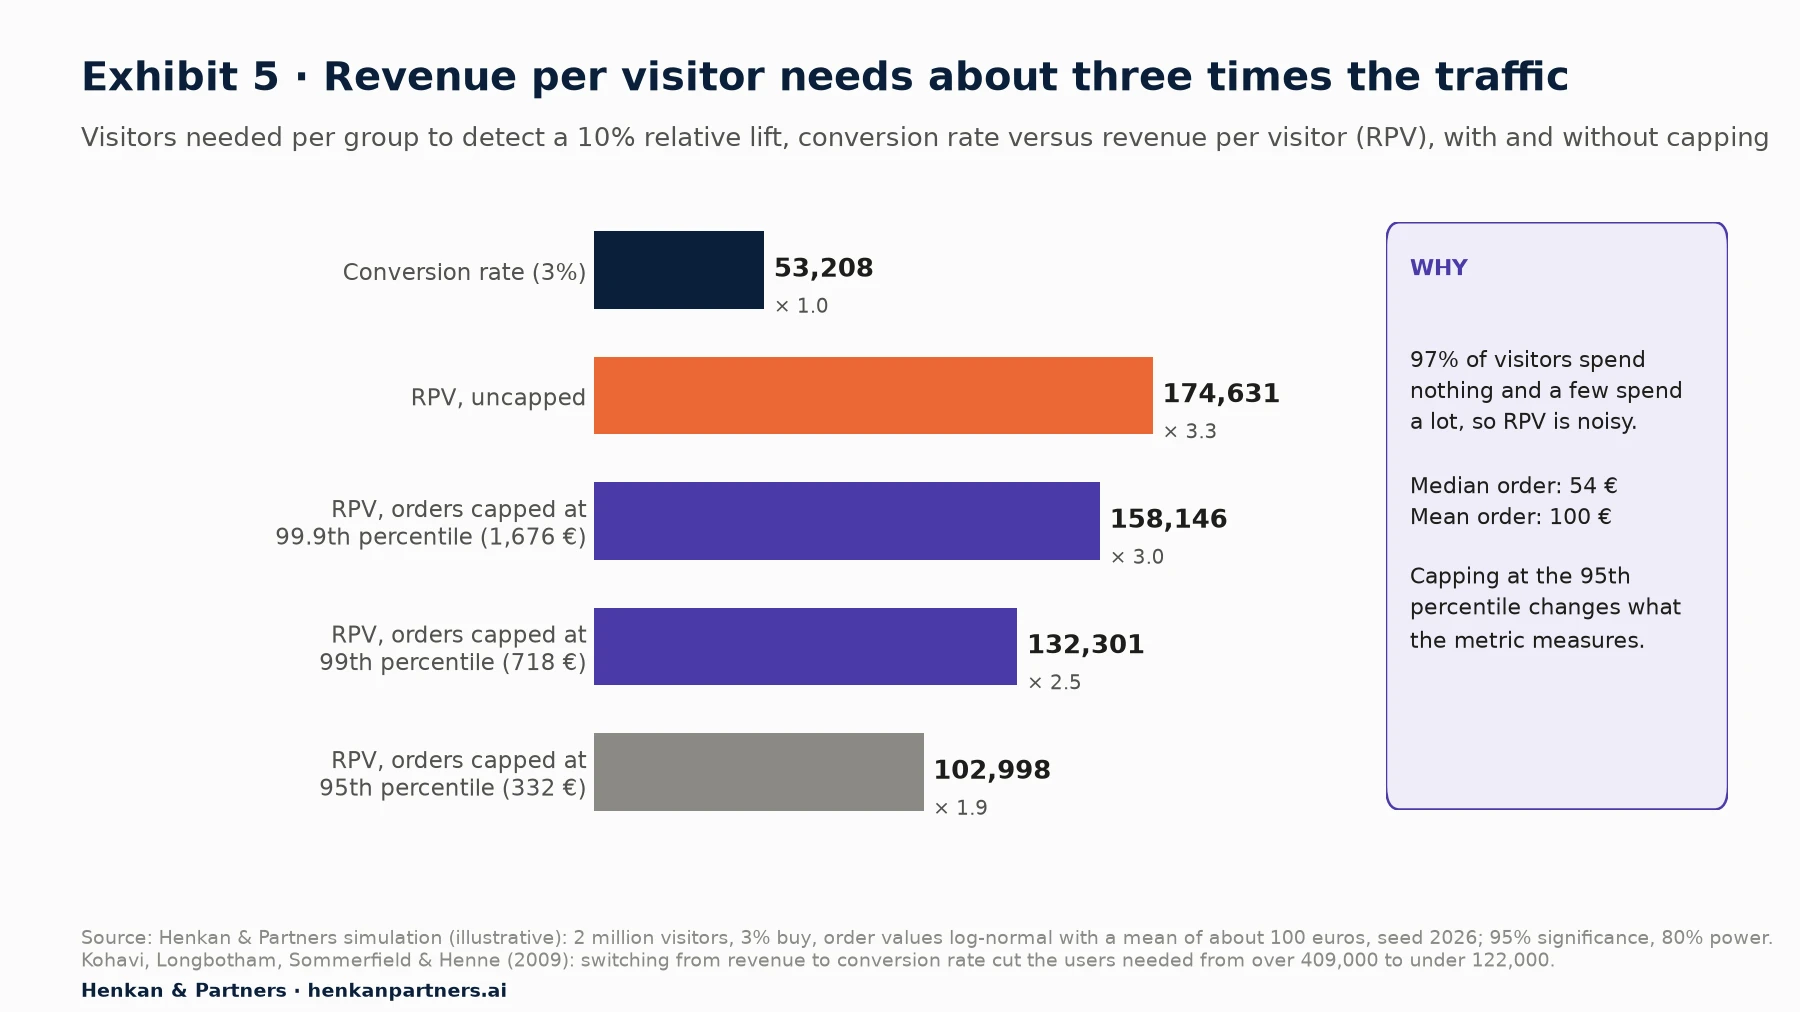
What this shows. Revenue needs roughly three times the traffic of conversion rate for the same relative lift. Capping large orders helps: capping at the 99th percentile of order value (718 euros in the simulation) cuts the sample from 174,631 to 132,301, a 24% saving. Capping harder saves more but starts to change what the metric measures, which is why the cap must be fixed before the test starts.
Outliers and capping, briefly
A handful of very large orders, often from business buyers or resellers, can decide a revenue test on their own. The usual fix is to cap (winsorise) each visitor's revenue at a high percentile, such as the 99th, calculated from pre-test data and written into the test plan. Kohavi, Tang and Xu list capping among the ways to reduce a metric's variance and make tests more sensitive. Some tools use different methods: AB Tasty's documentation says it uses the Mann-Whitney U test for transaction data because it is robust to extreme values. Our A/B testing mistakes article covers how to cap without faking a result.
For marketers. If your test is about conversion (a new call to action, a simpler form), make conversion rate the primary metric and track revenue per visitor as a guardrail. If it is about basket size or pricing, revenue is the right primary metric, but plan for about three times the traffic and fix the cap before launch. See our article on guardrail metrics for how to set the others.
Section 8 · Low traffic
With low traffic, change the test, not the statistics
Limited traffic is the constraint most teams cite when A/B testing disappoints. The good news is that most of the traffic you need is decided by the design of the test, which you control. Exhibit 6 compares the main levers against the base case.
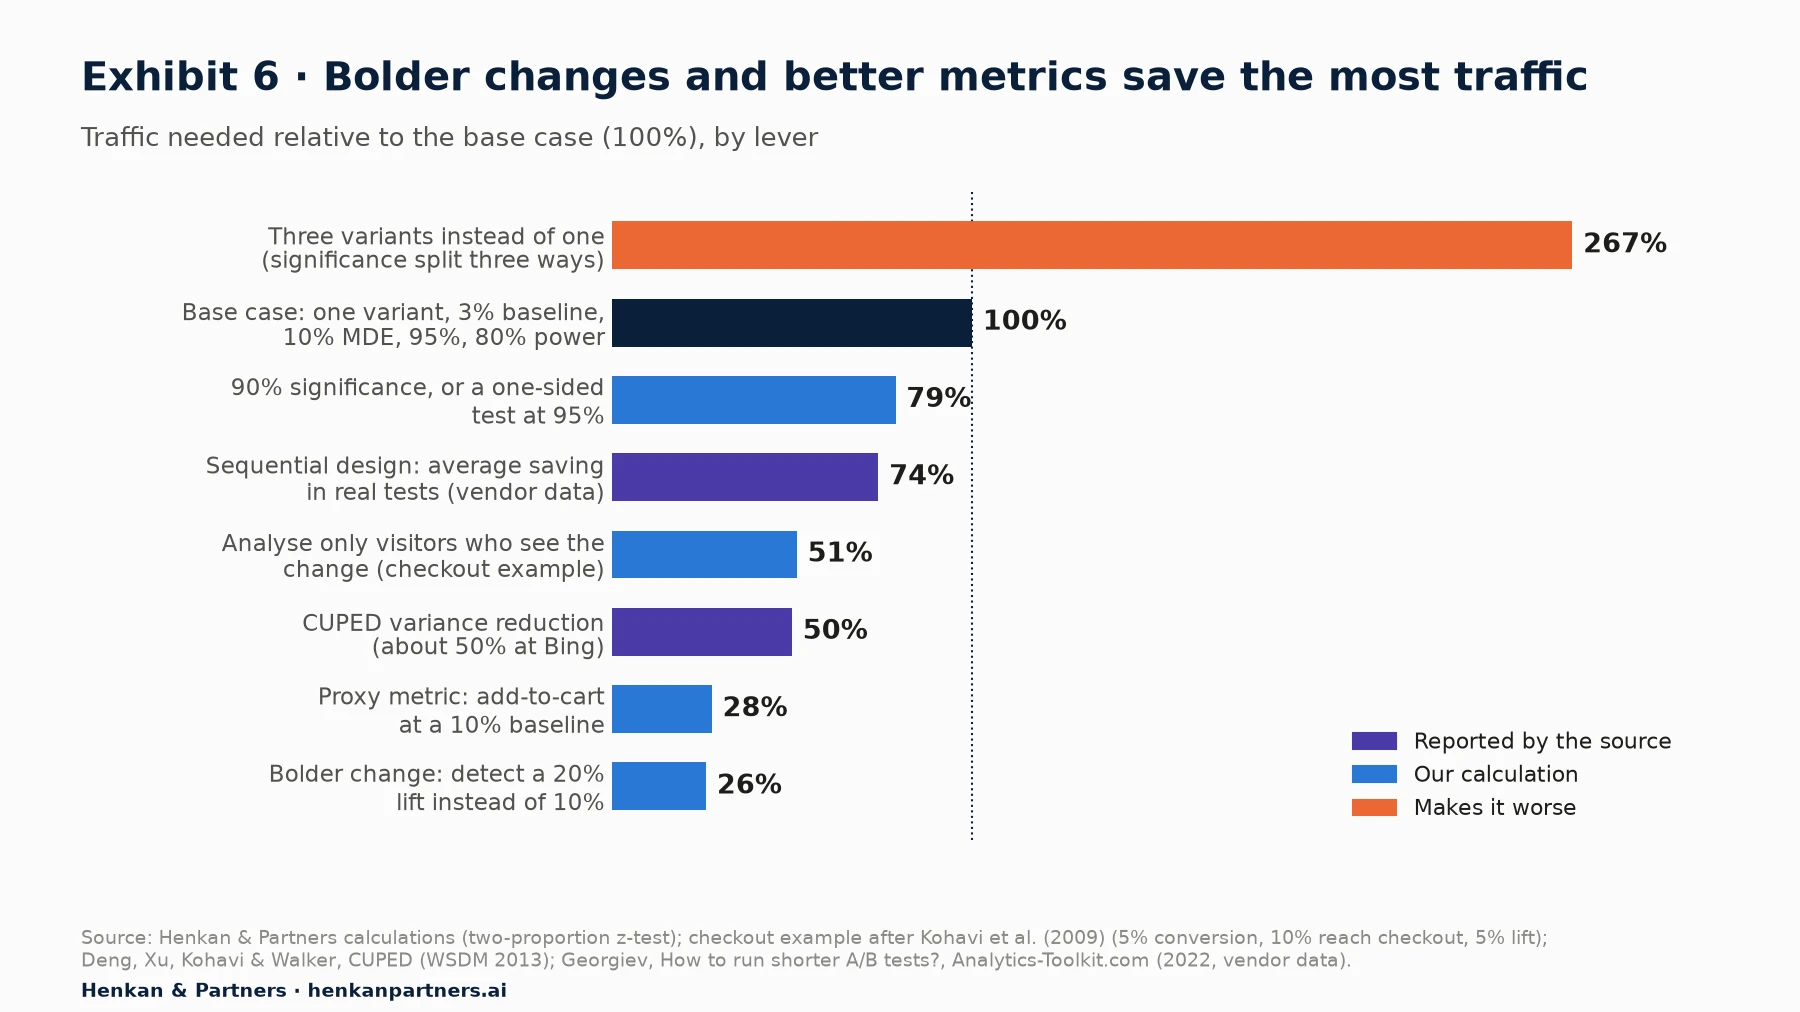
What this shows. The biggest savings come from the design of the test: a bolder change (26% of the traffic) or a metric closer to the change (28%). Variance reduction and analysing only exposed visitors roughly halve the need. Changing the statistics saves a fifth to a quarter. Adding variants goes the wrong way: three variants need 267% of the traffic of one.
Test bigger changes
A change that could lift conversion by 20% needs about a quarter of the traffic of one aimed at 10% (13,911 against 53,208 per group at 3%). On low-traffic sites, combine related improvements into one bold variation, such as a redesigned product page rather than a new button colour. You learn less about which element worked, but you get an answer. Use customer research, not guesswork, to choose what to combine.
Measure where the change happens, and only who sees it
If the change is on the checkout, analyse only visitors who reach the checkout, a technique Kohavi, Tang and Xu call triggering. In an example from Kohavi and colleagues' 2009 survey, 5% of visitors buy, 10% start checkout and half of those complete it. Detecting a 5% relative lift across all visitors needs 122,121 per group by our calculation; among checkout starters it needs 6,272, which takes 62,720 visitors to produce, about half the traffic. The same logic applies to tests below the fold or in a menu: count only visitors who were actually exposed.
Use a proxy metric, carefully
A metric higher up the funnel happens more often and so needs fewer visitors. At a 10% add-to-cart rate, detecting a 10% relative lift needs 14,749 visitors per group, 28% of what purchases need at 3%. Kohavi, Tang and Xu call these driver or surrogate metrics: "shorter-term, faster-moving, and more-sensitive" than goal metrics. The risk is that a lift in add-to-cart does not turn into purchases, for example when a variation pushes people to add items they later abandon. Use a proxy only when the change is designed to move that step, keep purchases as a guardrail, and check from past tests that the proxy and the goal move together.
Pool similar pages
Instead of testing one product page, test the same change on the product page template across a whole category or the whole catalogue. Pooling adds traffic without adding time. It works when the change and the audience are comparable across pages; it fails when one high-traffic page dominates the result or when the change interacts with page content.
Accept a larger MDE, lower significance, or a one-sided test, knowingly
Moving from 95% to 90% significance, or using a one-sided test at 95%, cuts the sample by about a fifth (41,912 instead of 53,208 per group). Georgiev argues that one-sided tests better match the question most teams ask ("is the variation better?") and that thresholds should be set from the cost of being wrong. This is a reasonable choice for low-risk, easily reversed changes. It doubles the rate of false wins you accept, so do not use it for costly or irreversible decisions.
Use fewer variants
Each extra variant needs its own full sample and tightens the significance level for every comparison. In Exhibit 2, moving from one variant to three took the test from 21 to 49 days. Georgiev's dataset suggests most practitioners already know this: 88% of the 1,001 tests had a single variant.
Reduce variance with pre-test data (CUPED)
CUPED (Controlled-experiment Using Pre-Experiment Data) adjusts each visitor's result using their behaviour before the test. At Bing, Deng, Xu, Kohavi and Walker (2013) reported that it could "reduce variance by about 50%, effectively achieving the same statistical power with only half of the users, or half the duration". Kameleoon reports, from over 200 experiments, a potential sample size reduction of up to 60% (vendor data). The limit is important: CUPED needs returning, identifiable visitors whose past behaviour predicts their future behaviour. On a site where most visitors are new, the gain is small.
Bayesian and sequential designs: useful, but not magic
Sequential tests let you look at results at planned points and stop early when the evidence is strong, without inflating false positives. Georgiev reports an average real-world saving of 26% in test duration for his group sequential method (vendor data), and Evan Miller's simple sequential test for conversion rates stops early when the difference in conversions passes a threshold. The savings are largest when the true effect is much larger than the MDE. Miller notes that the worst-case sample of a sequential test is larger than the fixed sample, so budget for the maximum.
Bayesian tests report a "chance to win" that people find easier to read. They do not make evidence appear from fewer visitors. In our experience, with the weak priors most tools use, a Bayesian test needs a similar amount of data to reach a confident answer, and stopping as soon as the chance to win crosses 95% has the same peeking problem as a frequentist test: Georgiev, citing Armitage and colleagues, notes that 10 outcome-based looks can multiply the real error rate about four times. Use a Bayesian engine for its clearer reporting, but still plan a sample size and a minimum duration.
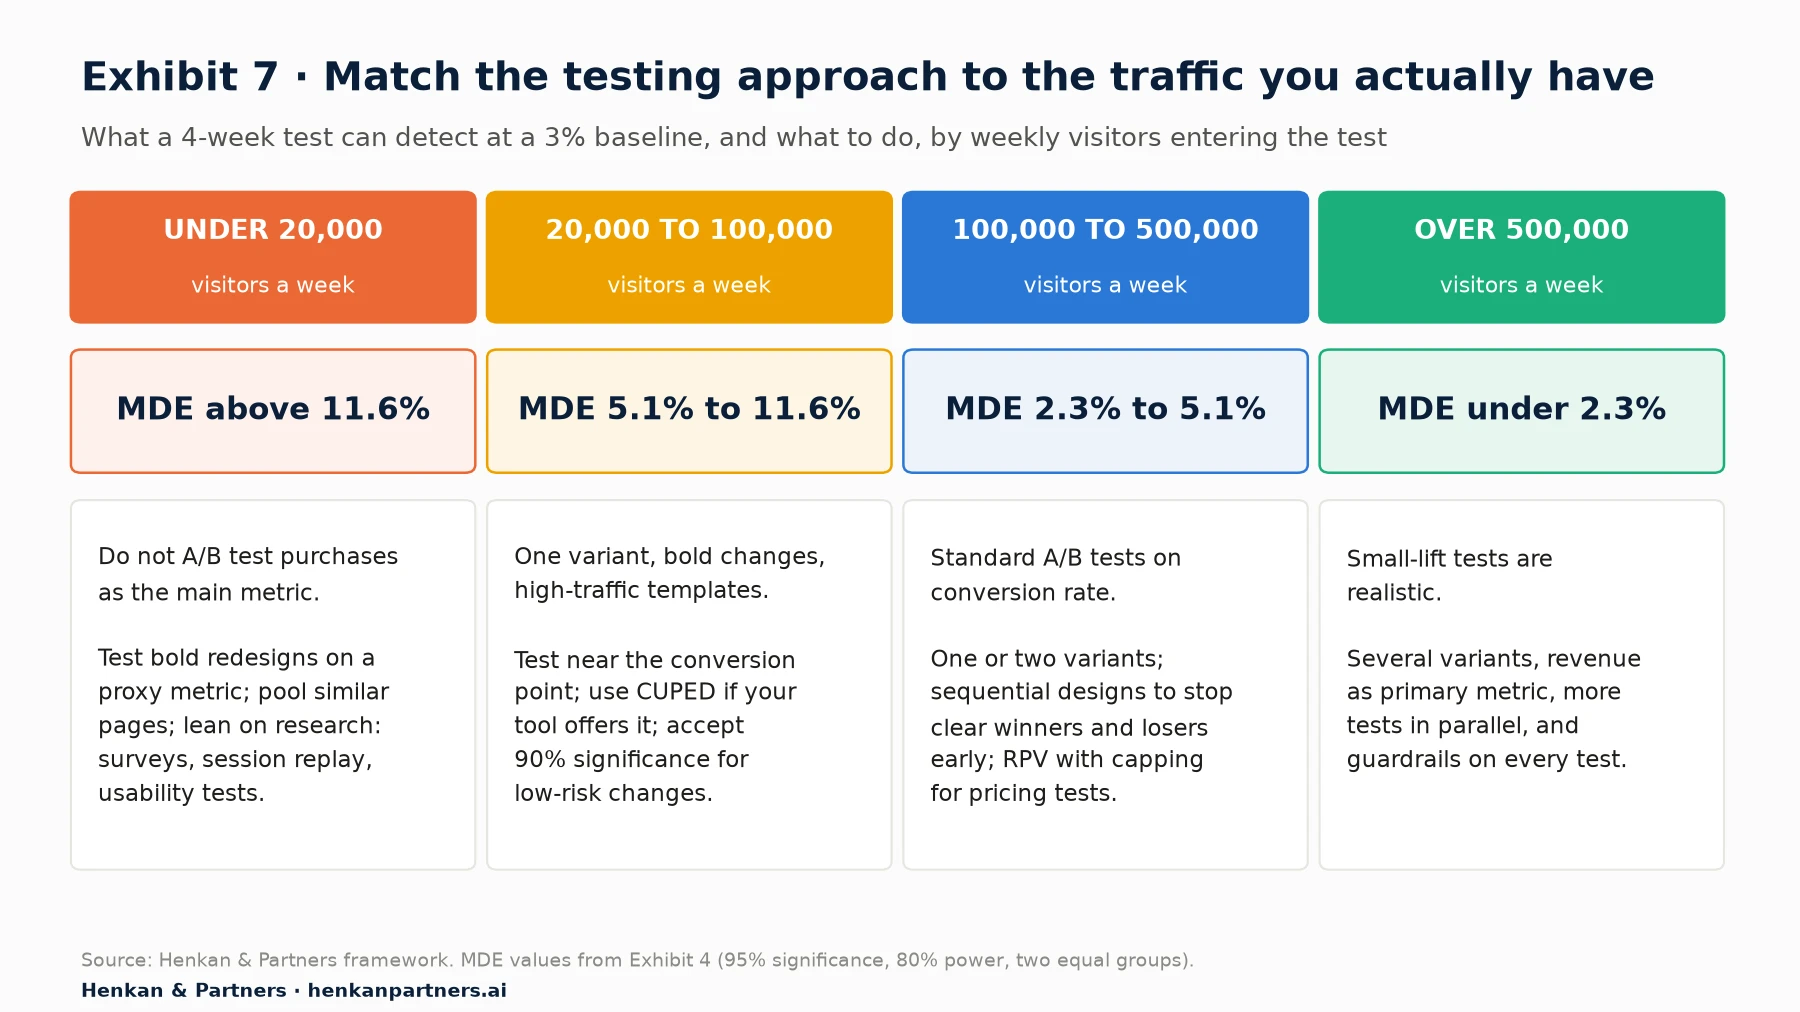
What this shows. The right testing approach depends on traffic more than on the tool. Below about 20,000 visitors a week on the tested page, A/B tests on purchases rarely give answers, and research methods such as surveys, session replay and usability tests should carry more of the load. Above 500,000, small optimisations become measurable and the constraint shifts to ideas and development capacity.
Our view. When a page genuinely cannot support a test, say so and decide with other evidence: customer research, usability testing, a careful before-and-after comparison with a control period, or a test on a higher-traffic page. A test that was never able to detect the effect is not cheaper than no test. It costs the same development time and produces a false sense of evidence.
Section 9 · How testing tools handle sample size
Testing tools handle sample size differently, so check what yours assumes
Every major testing platform includes a sample size or duration planner, but they rest on different statistical engines. The same test can show "significant" earlier in one tool than another because the rules differ, not the data. This is what the vendors' own documentation says.
| Tool | Default engine | Sample size in advance? | Duration guidance | Worth knowing |
|---|---|---|---|---|
| Optimizely | Stats Engine, a sequential method; default significance 90% | Not required: Stats Engine "removes the requirement"; a calculator helps with planning | At least one business cycle (seven days) | MDE is relative; weeks = total sample ÷ weekly unique visitors |
| Kameleoon | Frequentist, Bayesian or sequential methods; CUPED available | Required for fixed frequentist tests; not for sequential | At least two business cycles, usually two to four weeks (blog, 2026) | Documents its two-proportion sample size and duration formulas |
| AB Tasty (Wingify) | Bayesian for conversions; Mann-Whitney U for transaction data | Recommends at least 5,000 visitors per variation before calling a test ready | One, ideally two business cycles; average two weeks (2023 guide) | Implement only at a chance to win of 95% or more |
| VWO (Wingify) | SmartStats, a Bayesian engine (newer Data Platform accounts use an upgraded engine) | Planner uses baseline, daily visitors, MDE, a region of practical equivalence and a false positive rate | Seven days "a common recommendation" | Help article explains power with a 90% example |
Disclosure: Henkan & Partners is a Kameleoon Platinum partner and works with several of the tools above for clients. The table is based only on each vendor's public documentation.
Three practical checks follow. First, find out which engine your tests use by default, and whether someone changed it. Second, if the tool is sequential or Bayesian, still plan a maximum sample and a minimum duration of one or two full weeks: the tool may let you stop earlier, but it cannot see the weekly cycle. Third, if you switch tools, re-run the planning for your main pages, because the same traffic may support different MDEs.
Where AI helps, and where it does not
Testing platforms are adding AI assistants, and general assistants such as ChatGPT or Claude can explain the four inputs, draft a test plan and flag an MDE that looks unrealistic. Connected to your analytics through tools such as MCP servers, an agent can pull the baseline rate and daily eligible traffic for a page and produce a first estimate of duration. Two rules keep this safe: the sample size itself should come from code or a calculator, not from the model's head, and the MDE and end date should be decided by a person who owns the business case.
Section 10 · Common mistakes
Three mistakes undo a well-sized test: stopping on significance, too many variants and ignoring the calendar
A correct sample size calculation is only useful if the test is run as planned. These are the mistakes we see most often in audits of testing programmes. Our A/B testing mistakes article covers the wider list.
- Stopping when the result turns significant. Checking a standard fixed-horizon test every day and stopping at the first significant reading multiplies false wins: about 19% instead of 5% after ten looks, as our statistics article shows. If you need to monitor, use a sequential method designed for it and declare it in the plan.
- Stopping because the sample is reached mid-week. Reaching the sample on a Wednesday is not a reason to stop on Wednesday. Complete the week.
- Running too many variants. Four or five variations on a page that could support one turn a three-week test into a two-month test, or into an underpowered one. In our example, three variants need 267% of the traffic of one.
- Ignoring seasonality and promotions. A test that runs entirely during a sale measures behaviour during the sale. Check the calendar before launch, and avoid starting or ending in the middle of an event.
- Using the wrong baseline. A site-wide conversion rate of 3% may hide a 1% rate on the tested page. Use the baseline of the visitors who will actually enter the test.
- Changing the plan mid-test. Changing the traffic split, adding a variant or editing the variation resets the clock. Treat it as a new test.
- Declaring "no difference" from an underpowered test. A flat result means only that the effect was probably smaller than the MDE. Report the confidence interval, not just "not significant".
Before launch, run the quality checks in our A/B test QA checklist, including a sample ratio check on day one. A split that drifts from 50/50 means the test is broken, whatever the sample size.
Section 11 · What to do next
Five steps to size every test before it launches
1. Build a traffic map of your key pages
List your ten most tested pages or templates with weekly eligible visitors, device split and baseline conversion rate for the last four weeks. Add the MDE a 4-week test could detect on each, using Table 2. This single sheet tells you where A/B testing works on your site and where it does not.
2. Add a sample size block to the test plan template
Every test plan should record the baseline, the MDE (and whether it is relative or absolute), the significance level, the power, the visitors per group, the number of groups, the daily eligible traffic, the allocation and the planned end date. It takes five minutes and prevents most of the problems in Section 10.
3. Choose your MDE from the business case
For each test, ask what lift would pay back the cost of building and maintaining the change, and whether the idea could plausibly deliver it. If the answer is below what the page can detect, make the change bolder, move the test to a higher-traffic template or pick another idea from your test backlog.
4. Check your tool's defaults
Confirm the statistical engine, significance level and any sequential or CUPED settings in your testing tool, and make sure the planning calculator uses the same ones. Write them down so everyone reads results the same way.
5. Get a second opinion on your low-traffic pages
If most of your pages sit below 100,000 visitors a week, the testing strategy matters more than the tool. Henkan & Partners helps e-commerce teams design programmes that match their traffic, combining A/B tests with customer research and analytics. Talk to us.
FAQ
Frequently asked questions about A/B test sample size and duration
Frequently asked questions
What is A/B test sample size?
It is the number of visitors each version of a test must receive so that, if the change truly improves the metric by at least the minimum detectable effect, the test has a high chance (usually 80%) of showing a significant result. It is calculated before launch from the baseline rate, the MDE, the significance level and the power.
How do you calculate sample size for an A/B test?
For a conversion rate, use n per group = (z₁₋α/₂ + z₁₋β)² × [p₁(1 − p₁) + p₂(1 − p₂)] ÷ (p₂ − p₁)². At a 3% baseline, a 10% relative MDE, 95% significance and 80% power, that gives 53,208 visitors per group. The rule of thumb 16 × p(1 − p) ÷ δ² gives a close estimate (51,733).
How long should you run an A/B test?
Until it reaches the planned sample size, rounded up to whole weeks, and never less than one full week; two weeks is safer. Kohavi and colleagues recommend at least a week or two, then multiples of a week. In our experience, two to six weeks is the practical window for most e-commerce tests.
What is a good minimum detectable effect?
The smallest lift that would justify the change commercially and that your traffic can detect. In Georgiev's dataset of 1,001 tests the median planned MDE was 6%. On pages with tens of thousands of weekly visitors, realistic MDEs are often 10% or more, which means testing bolder changes.
What is the difference between relative and absolute MDE?
A relative MDE is a percentage of the baseline (10% of 3% is 0.3 points); an absolute MDE is in percentage points (0.3 points). Entering a relative value into a field that expects an absolute one, or the reverse, can change the required sample by orders of magnitude.
How many visitors do you need for an A/B test?
It depends on the baseline and the lift. At a 3% conversion rate you need about 13,911 visitors per group to detect a 20% lift, 53,208 for 10% and 207,936 for 5%. Kohavi, Deng and Vermeer suggest A/B tests are useful with at least thousands of active users, preferably tens of thousands.
Can you A/B test with low traffic?
Yes, within limits. Test bolder changes, measure closer to the change, analyse only exposed visitors, pool similar pages, use one variant, and consider CUPED or sequential designs. Below about 20,000 visitors a week on the tested page, rely more on customer research and use tests only for large changes.
Do Bayesian A/B tests need a smaller sample size?
Not in any meaningful way. Bayesian tests report results as a chance to win, which is easier to read, but they still need enough data to be confident, and stopping as soon as the chance to win crosses a threshold inflates errors just like peeking at a frequentist test. Plan a sample and a minimum duration either way.
Why should an A/B test run for full weeks?
Because behaviour varies by day of the week, and a test that stops mid-week over-represents some days. Full weeks also help you spot novelty effects by comparing the first and second week. Optimizely, Wingify, AB Tasty and Kameleoon all recommend at least one full business cycle.
Key terms
- Sample size
- The number of visitors each group in a test must receive, calculated before launch. It matters because it decides whether the test can detect the effect you care about.
- Baseline conversion rate
- The current rate of the primary metric for the visitors who will enter the test. It matters because lower baselines need more traffic.
- Minimum detectable effect (MDE)
- The smallest true change a test is designed to detect with the chosen power. It matters because halving it roughly quadruples the sample.
- Relative lift
- A change expressed as a percentage of the baseline, such as 3.0% to 3.3% being a 10% lift. It matters because tools differ in whether they expect relative or absolute values.
- Significance level (alpha)
- The false positive rate accepted when there is no real difference, usually 5% (shown as 95%). It matters because a stricter level needs more traffic and a looser one produces more false wins.
- Statistical power
- The probability that a test detects an effect at least as large as the MDE, usually 80%. It matters because underpowered tests miss real wins and exaggerate the ones they find.
- Variance
- A measure of how spread out a metric is across visitors. It matters because the sample needed grows in direct proportion to it.
- Revenue per visitor (RPV)
- Total revenue divided by visitors in each group. It matters because it reflects business value but is noisy and needs roughly three times the traffic of conversion rate.
- Capping (winsorising)
- Limiting each visitor's value to a threshold, such as the 99th percentile of order value, fixed before the test. It matters because it reduces variance and stops a few large orders deciding the result.
- Traffic allocation
- The share of eligible visitors who enter the experiment. It matters because halving it doubles the test duration.
- Bonferroni correction
- Dividing the significance level by the number of comparisons, for example 5% ÷ 3 with three variants. It matters because it keeps false wins under control when several variants are tested.
- Triggering
- Analysing only the visitors who were actually exposed to the change, such as checkout starters for a checkout test. It matters because it removes noise from unaffected visitors and can halve the traffic needed.
- Proxy (surrogate) metric
- A faster, more frequent metric, such as add-to-cart, used in place of the goal metric. It matters because it needs less traffic, but only helps if it reliably predicts the goal.
- CUPED
- Controlled-experiment Using Pre-Experiment Data, a method that uses visitors' past behaviour to reduce variance. It matters because it can cut the sample needed by about half when returning visitors dominate.
- Sequential test
- A test designed for repeated looks at the data, with stopping rules that keep error rates valid. It matters because it can end clear tests early, though its worst-case sample is larger than a fixed test's.
Sources
All sources were checked in September 2026. Optimizely, Kameleoon, AB Tasty and Wingify (VWO) features and guidance come from their own documentation and blogs and are vendor information; Kameleoon's CUPED figure and Georgiev's analyses of tests run with Analytics-Toolkit, a commercial tool he develops, are vendor data. All sample sizes, durations and MDE values in the text, Tables 1 and 2 and Exhibits 1, 2, 4 and 6 are Henkan & Partners calculations using the two-proportion formula shown in Section 3. Exhibit 5 is an illustrative Henkan & Partners simulation; Exhibit 7 is a Henkan & Partners framework.
- Kohavi, R., Tang, D. & Xu, Y. (2020). Trustworthy Online Controlled Experiments: A Practical Guide to A/B Testing. Cambridge University Press (ch. 6, 17, 18 and 20).
- Kohavi, R., Longbotham, R., Sommerfield, D. & Henne, R. M. (2009). Controlled experiments on the web: survey and practical guide. Data Mining and Knowledge Discovery, 18, 140–181.
- Kohavi, R., Deng, A. & Vermeer, L. (2022). A/B Testing Intuition Busters: Common Misunderstandings in Online Controlled Experiments. KDD 2022.
- Deng, A., Xu, Y., Kohavi, R. & Walker, T. (2013). Improving the Sensitivity of Online Controlled Experiments by Utilizing Pre-Experiment Data. WSDM 2013.
- Miller, E. (2010). How Not To Run an A/B Test.
- Miller, E. (n.d.). Sample Size Calculator.
- Miller, E. (2015). Simple Sequential A/B Testing.
- Georgiev, G. (2022). What can be learned from 1,001 A/B tests? Analytics-Toolkit.com (vendor data).
- Georgiev, G. (2022). How to Run Shorter A/B Tests? Analytics-Toolkit.com (vendor data).
- Georgiev, G. (2017). Bayesian AB Testing is Not Immune to Optional Stopping Issues. Analytics-Toolkit.com.
- Optimizely (n.d.). How long to run an experiment (vendor documentation).
- Optimizely (n.d.). Use minimum detectable effect to prioritize experiments (vendor documentation).
- Kameleoon (n.d.). Choosing the right statistical method for A/B testing (vendor documentation).
- Kameleoon (2022). Statistics at Kameleoon (vendor documentation).
- Kameleoon (2023). What we learned from running 200+ experiments on CUPED (vendor data).
- Kameleoon (2026). Are you stopping your A/B tests too early? (vendor guidance).
- AB Tasty (n.d.). Statistics for the reporting (vendor documentation).
- Brebion, A. (2023). How Long Should You Run an A/B Test? AB Tasty blog, now published by Wingify (vendor guidance).
- Wingify (n.d.). Understanding Minimum Test Duration (vendor documentation).
- Wingify (n.d.). Estimating Your Campaign Duration and Sample Size (vendor documentation).
- Wingify (2026). AB Tasty and VWO Unite Under Wingify, Launching a Unified Platform, New Brand Identity, and a Website. PR Newswire.
- WebKit (2019). Intelligent Tracking Prevention 2.1.
- Henkan & Partners. Sample size, duration and MDE calculations (two-proportion z-test, unpooled variance) and revenue-per-visitor simulation (seed 2026), September 2026.