Focus
A/B Test QA Checklist: What to Check Before, During and After Launch
Alexandre Suon · 2026-09-29
Most A/B tests that go wrong do not fail on statistics. They fail on a variation that breaks in Safari, a goal that never fires, a traffic split that drifts, or a result read too early. This A/B test QA checklist covers what marketers and developers should check before, at, during and after launch in tools such as Kameleoon, Optimizely, AB Tasty and VWO, with the sources behind each check.
Executive summary
- Quality assurance is the cheapest part of an experiment and the most often skipped. Speero's 2025 maturity benchmark (154 programmes assessed in 2024, agency data) found that 52% of businesses admit they do not QA tests before launch. A broken test costs twice: in lost orders while it runs, and in a decision you can no longer trust.
- Fix the plan before you touch the tool. Write the hypothesis, pick one primary metric and two to four guardrails, and calculate sample size, minimum detectable effect (MDE) and duration. In our illustrative example, a 3% conversion rate needs about 53,000 visitors per variation to detect a 10% relative lift.
- QA the variation where your traffic actually is. Using StatCounter's August 2026 data for Europe, six browser-device pairs make up about 90% of page views, with Safari on iPhone alone at about 14%. Use every vendor's preview, simulation or QA mode, and force each variation on real devices, not only in the editor.
- Check speed, tracking and consent as carefully as the design. Default loading timeouts range from 1 second (Kameleoon's anti-flicker) to 2 and 2.5 seconds (VWO SmartCode), against Google's 2.5-second 'good' threshold for Largest Contentful Paint. Confirm every goal fires once, the experiment ID reaches your analytics, and consent settings behave as intended.
- Launch in steps and check the split on day one. About 6% of experiments at Microsoft showed a sample ratio mismatch (SRM), in which the traffic split differs from the one configured. A chi-square test at p < 0.001, the threshold Kameleoon and Eppo use, run from day one, flags a broken assignment before it wastes weeks of traffic.
- Do not peek, stop only for harm, and close the loop. In our simulation, checking an A/A test 20 times pushes the false positive rate from 5% to 25%. Stop early only for SRM, bugs or a guardrail breach; afterwards, record the result in a test repository, switch the test off and hard-code the winner.
Section 1 · Why it matters
A broken test costs twice: in revenue while it runs and in a decision you cannot trust
An A/B test QA checklist is a structured list of checks that a team completes before, at, during and after the launch of an online controlled experiment. It confirms that the hypothesis and metrics are fixed in advance, that each variation renders and works on the browsers and devices that matter, that tracking and traffic allocation are correct, and that the result is analysed, documented and acted on as planned.
An A/B test has two jobs. It must not damage the experience of the customers who see it, and it must produce a number you can base a decision on. Quality assurance (QA) protects both. Yet it is the step teams skip most when the roadmap is under pressure. In Speero's 2025 Experimentation Maturity Benchmark, based on 154 programmes that completed its audit in 2024, 52% of businesses admitted they do not QA tests before launch (agency data, self-assessment).
Even mature platforms get it wrong. Fabijan and colleagues at Microsoft reported at KDD 2019 that about 6% of experiments at Microsoft exhibit a sample ratio mismatch, a sign that the users in each group are not the ones the randomisation intended. The same paper cites a rate of about 10% for triggered analyses at LinkedIn. At Microsoft's scale, a product running 10,000 experiments a year can expect at least one SRM a day. If it happens there, with dedicated platform teams, it happens in a mid-sized e-commerce programme running a client-side tool.
The textbook on the subject, Kohavi, Tang and Xu's Trustworthy Online Controlled Experiments (Cambridge University Press, 2020), dedicates whole chapters to this: Twyman's law (any figure that looks interesting or different is usually wrong), the A/A test, and SRM and other trust-related guardrail metrics. The message is consistent. The statistics are rarely the weak point. The plumbing is.
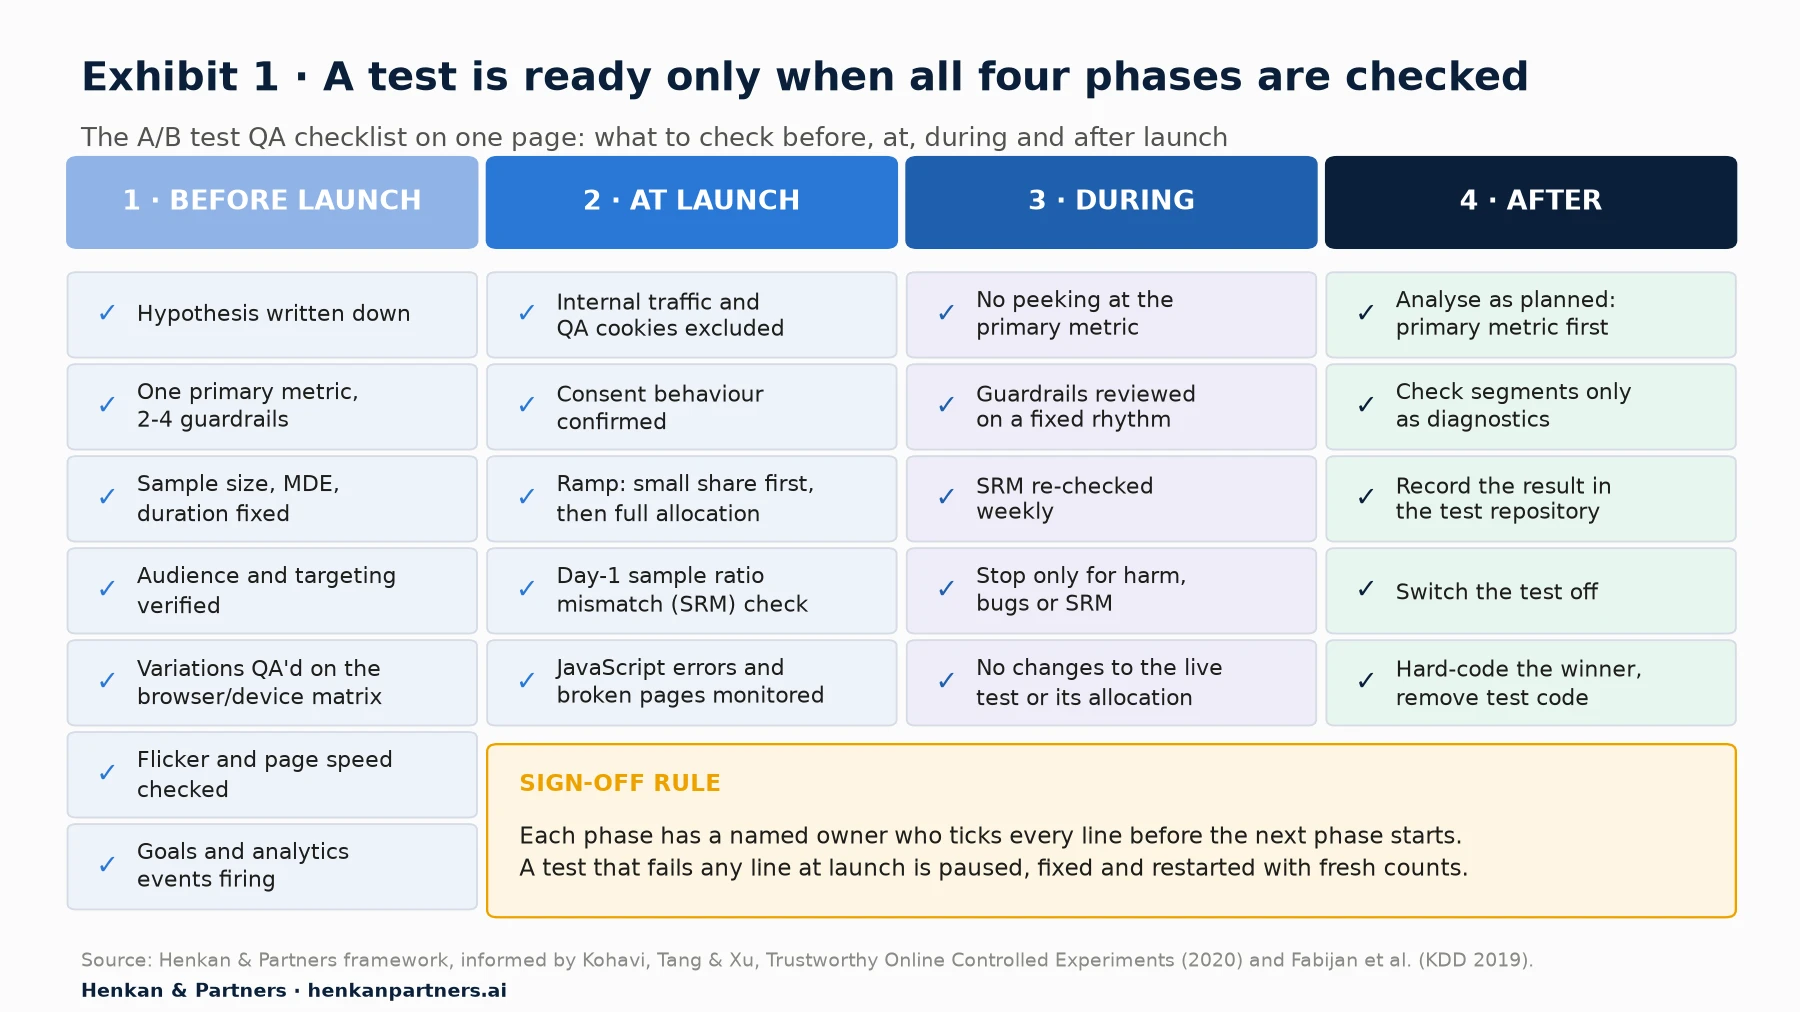
What this shows. The checklist is split by phase because each phase has a different owner and a different failure mode. Most teams only do the first column, and only part of it: they look at the variation in the editor and press launch. The later columns are where trust in the result is won or lost, and they take minutes, not days.
The table below turns the exhibit into a printable, one-page version with an owner and a pass criterion for each line. Adapt the owners to your team. In a small team, one person may hold several roles, but the analyst and the developer should never sign off their own work without a second pair of eyes.
| Phase | Check | Owner | Pass criterion |
|---|---|---|---|
| Before | Hypothesis, primary metric, guardrails | Test owner | Written in the test plan and agreed before build starts |
| Before | Sample size, MDE, duration | Analyst | Calculated from baseline data; duration in full weeks |
| Before | Audience, targeting, exclusions | Test owner | Tested with the tool's simulation or QA mode, in and out of the audience |
| Before | Variation rendering and function | Developer and QA | Every variation passes on Tier 1 and Tier 2 browser-device pairs |
| Before | Flicker and page speed | Developer | No visible flash of original content; LCP and CLS not worse than control |
| Before | Goals and analytics events | Analyst | Each goal fires once per action, in each variation; experiment ID reaches analytics |
| Launch | Internal traffic, QA cookies, consent | Analyst | Excluded or flagged; consent mode confirmed in the tool and in analytics |
| Launch | Ramp and day-1 SRM check | Analyst | Split within expectation (SRM p ≥ 0.001); no error spike |
| During | Guardrails and SRM | Analyst | Reviewed on the planned dates only; no changes to the live test |
| After | Analysis, documentation, clean-up | Test owner and developer | Decision recorded in the repository; test switched off; winner hard-coded |
For marketers. You do not need to write code to own QA. You own the plan, the audience and the sign-off: if a line has no tick, the test does not launch.
For leaders. Ask for the checklist, not only the result. A programme that cannot show a completed QA record for each test cannot show that its wins are real. Our first 90 days guide explains how to introduce this without slowing the team down.
Section 2 · Hypothesis and metrics
Fix one primary metric and a few guardrails before you build anything
QA starts with the test plan, not with the browser. A test without a written hypothesis and a single primary metric cannot be checked, because you do not know what 'working' means. Write the plan before the build starts and do not change it once the test is live. Our A/B testing guide covers hypotheses in depth; the checklist only needs four things.
- A hypothesis in one sentence. 'Because we saw X in research, we believe that changing Y for audience Z will improve metric M.' If you cannot fill the blanks, the test is not ready.
- One primary metric. The metric that decides the test, for example orders per visitor or revenue per visitor. One metric avoids the temptation to pick whichever one looks best at the end.
- Two to four guardrails. Metrics that must not get worse: for example average order value, page load time, error rate, returns or unsubscribes. Kohavi, Tang and Xu recommend treating latency as a guardrail, and note that in 2017 every tenth of a second of improvement at Bing was worth $18 million in incremental annual revenue.
- A decision rule. What you will do if the primary metric wins, loses or is flat, and how much harm on a guardrail would stop the test. Writing this down before launch is the simplest defence against post-hoc storytelling.
Guardrails come in two kinds. Business guardrails protect the customer and the P&L (revenue, errors, speed). Trust guardrails protect the result itself: the sample ratio, the share of visitors with tracking, and in some set-ups the share of visitors who saw the variation they were assigned. Chapter 21 of Kohavi, Tang and Xu is devoted to the second kind, and they are the ones teams forget.
Our view. If the primary metric is a micro-conversion such as clicks on a button, add a guardrail further down the funnel. A variation that gets more clicks and fewer orders is not a winner, and the checklist should force the team to look.
Section 3 · Sample size and duration
Decide sample size, minimum detectable effect and duration before launch, not when results look good
The second pre-launch check is arithmetic. You need to know how many visitors each variation needs, which depends on the baseline conversion rate, the smallest lift worth detecting (the minimum detectable effect, or MDE), the significance level and the statistical power. Without this, you cannot tell whether a flat result means 'no effect' or 'not enough data', and you have no stopping rule. The detail of frequentist, Bayesian and sequential approaches is in our guide to A/B test statistical models.
n per variation ≈ (z₁₋α/₂ + z₁₋β)² × [p₁(1 − p₁) + p₂(1 − p₂)] / (p₂ − p₁)²

p₁ = baseline conversion rate; p₂ = p₁ × (1 + relative MDE)
z₁₋α/₂ = 1.96 for α = 0.05 two-sided; z₁₋β = 0.84 for 80% power
Duration (weeks) = n × number of variations / eligible visitors per week, rounded up to full weeks
Take an illustrative product page with a 3% conversion rate and 40,000 eligible visitors a week, split 50/50 between control and one variation. The table shows how the MDE drives everything else. The table uses the pooled-variance version of this formula with unrounded z-values; the simpler version above gives almost identical figures.
| Relative MDE | Target rate | Visitors per variation | Weeks at 40,000 visitors/week | Verdict |
|---|---|---|---|---|
| 15% | 3.45% | 24,193 | 1.2 → run 2 full weeks | Feasible; only detects large effects |
| 10% | 3.30% | 53,211 | 2.7 → run 3 full weeks | A sensible default for this page |
| 5% | 3.15% | 207,938 | 10.4 → run 11 weeks | Too long; pick a bolder change or a higher-traffic page |
Three rules of thumb follow. First, run in full weeks, so every day of the week is represented equally; a test that starts on a Monday and ends on a Thursday over-weights some days. Second, set a minimum of one to two weeks even when the sample is reached sooner, because, in our experience, the first visitors to a test are often not typical (frequent, loyal customers tend to arrive first). Third, write the end date in the test plan and treat it as fixed: the sample size is the stopping rule, not the p-value.
For marketers. If the calculator says eleven weeks, do not launch and hope. Make the change bolder, test on a page with more traffic, or choose a metric closer to the change.
For developers. Ask for the sample size before you build. A test that cannot reach its sample in a reasonable time is not worth a sprint.
Section 4 · Audience and targeting
Test the targeting from both sides, and keep your own team out of the data
Targeting errors are silent. The test launches, the numbers come in, and nobody notices that half the intended audience never qualified, or that visitors outside it were bucketed. Check targeting with a visitor who should see the test and with one who should not, on each page type and entry path in scope.
- URLs and page types. Does the test run on every product page it should, including those with query parameters, trailing slashes, locale folders and pages reached from search or email? Does it stay off the pages it should not touch?
- Audience conditions. New versus returning, device, country, logged-in state, traffic source. Simulate each condition with the tool's simulation or QA mode rather than guessing.
- Trigger point. Is the visitor counted when they land on the page, or only when they reach the element that changes (for example the basket drawer)? Counting visitors who never saw the change dilutes the effect; counting them only in one variation creates an SRM.
- Interaction with other tests. Which tests run on the same pages or audience? Decide whether they must be mutually exclusive, and document the decision.
- Single-page applications. On sites that change content without a full page load, check that the test re-applies after each route change and that the visitor is not counted again.
Exclude internal traffic, QA sessions and bots
Your team, your agency and your QA sessions should never be in the result. Two layers matter. In the testing tool, Kameleoon for example can exclude IP addresses from the results pages of tests; its documentation notes that the exclusion is done client-side and applies only to Kameleoon events and results, so excluded visitors' events can still reach Google Analytics 4 and other integrations. In GA4, internal traffic is identified with a `traffic_type` parameter set by IP rules, then removed with a data filter. Google's documentation warns that an active data filter permanently excludes data, recommends checking it first in the 'Testing' state, and allows up to 10 data filters per property.
IP rules do not catch everyone who works from home or on mobile data. Add a second signal, such as a QA cookie or a URL parameter your team uses when testing, and exclude it in both the tool and analytics. Bot traffic is a third source of noise; Fabijan et al. list bot filtering among the causes of SRM, so check how your tool and your analytics treat known bots.
Section 5 · Variation QA
QA every variation on the browser-device pairs that carry your revenue, using the tool's own QA modes
This is the check everyone knows and most do too lightly. Looking at the variation in the visual editor proves only that it renders in the editor. The variation must be checked on the real site, forced through the tool as a visitor would receive it, on the browsers and devices your customers use, through the full journey to the conversion.
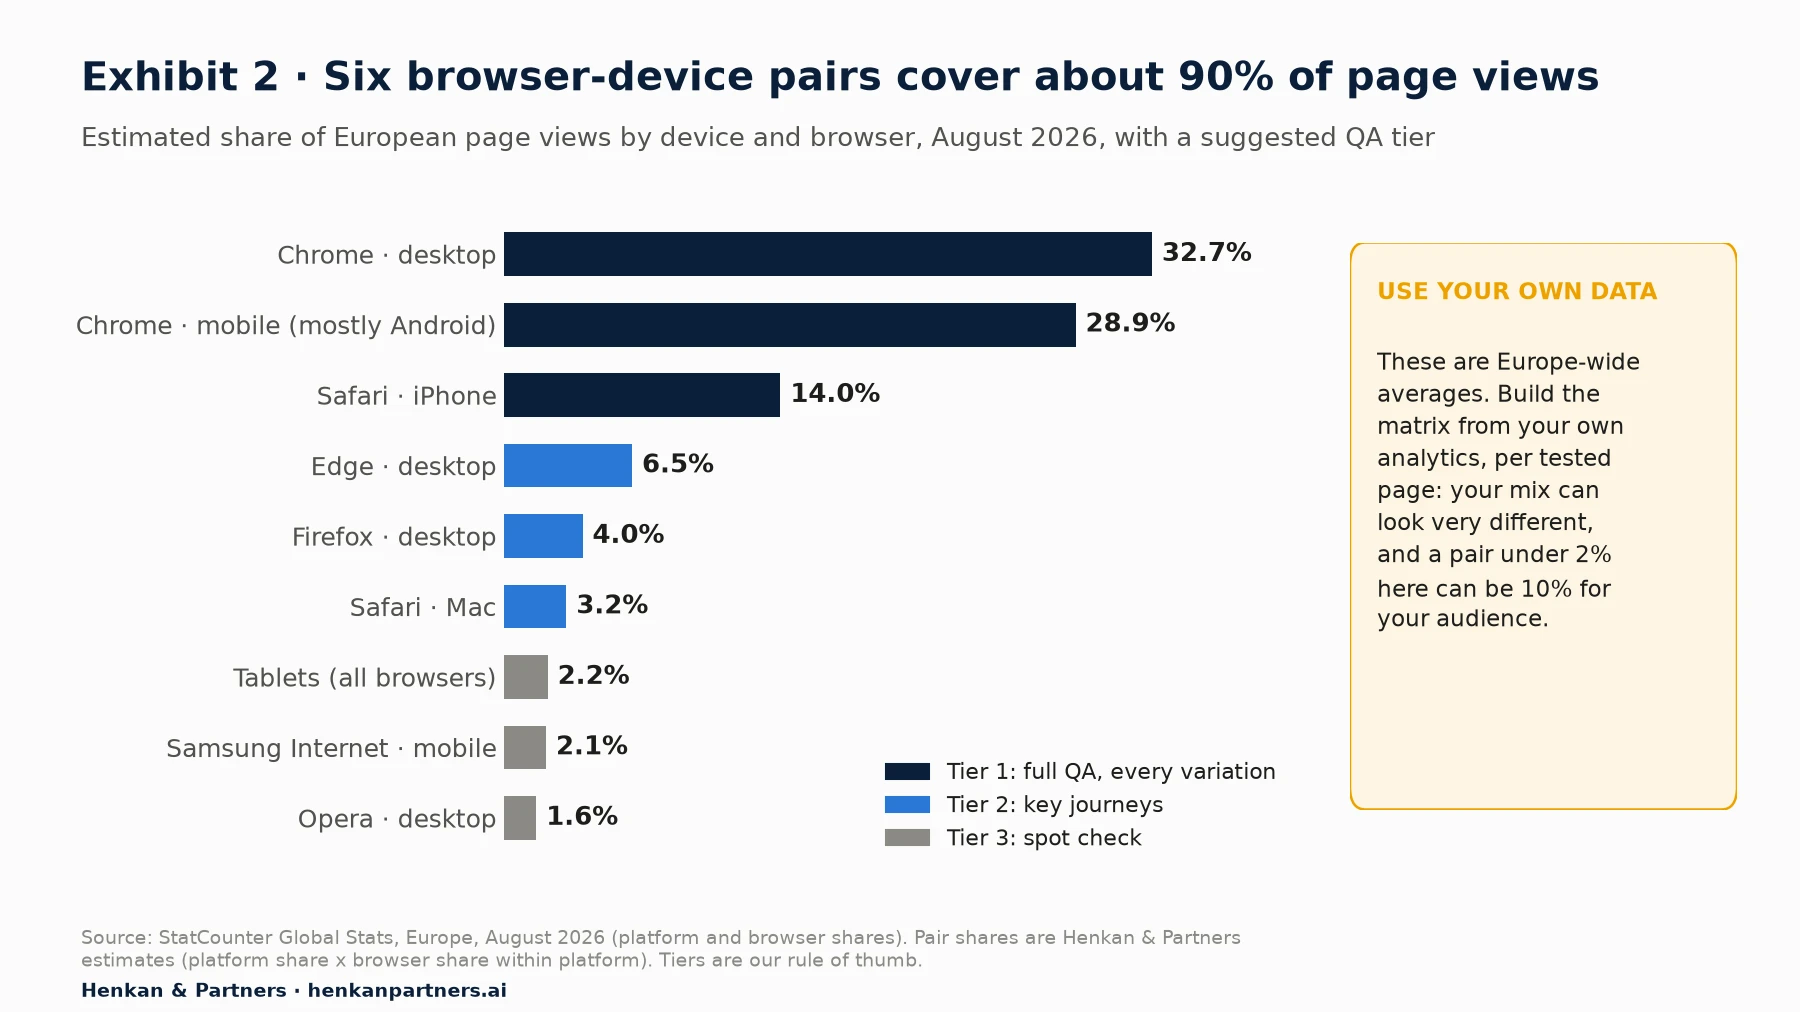
What this shows. Across Europe, desktop carried 50.7% of page views and mobile 47.1% in August 2026, with Android at 62.7% and iOS at 37.3% of mobile. Multiplying platform shares by browser shares within each platform gives the pairs above: three pairs carry three quarters of page views, six carry about 90%. Your own mix will differ, sometimes a lot, so build the matrix from your analytics for the pages you are testing, and weight it by revenue as well as sessions.
We use three tiers. Tier 1 pairs get full QA of every variation and every step of the journey. Tier 2 pairs get the key journeys: land, interact with the change, add to basket, reach checkout. Tier 3 pairs get a spot check. Whatever the tiers, test on at least one real iPhone: Safari on iOS behaves differently from desktop emulators, and it carries about 14% of European page views on its own.
What to check in each variation
- Rendering. Layout, fonts, images, spacing and text at the main breakpoints, including long product names, translations and prices with several digits.
- Function. Every button, link, form, filter and drawer that the change touches, and the ones around it. Check that the variation does not break unrelated features on the same page.
- States. Out-of-stock products, sale prices, empty baskets, logged-in and logged-out users, cookie banner open and closed.
- Dynamic content. Elements that load late or re-render (carousels, recommendations, reviews). The variation code must wait for them rather than run once and miss them. Our guides to DOM manipulation for marketers and developers cover the patterns.
- Console. No new JavaScript errors in the browser console in any variation.
- Accessibility. Keyboard navigation and screen-reader labels still work on changed elements.
Use the vendor's preview, simulation and force-variation tools
Every major tool has a way to see a variation before real visitors do, and a way to force a variation on the live site. Use both: the preview for design review, the forced variation on production for the final QA.
| Tool | Pre-launch preview and QA | Force a variation or restrict to QA users | Built-in trust checks |
|---|---|---|---|
| Kameleoon | Simulation panel from the graphic or code editor: preview variations, check targeting, segments, triggers and goal conversions; share a simulation by URL or QR code | Force display of a specific variation in simulation, regardless of targeting | SRM alert on the results page (chi-square goodness of fit, p < 0.001); IP exclusion from results |
| Optimizely | Preview tool and share links (including QR codes) for unpublished variations | Test cookie and QA audiences; force-variation query parameter `optimizely_x=VARIATIONID`, with tokens for draft or paused tests; separate environments | Automatic SRM detection (sequential SRM) for A/B tests with manual traffic distribution, 1,000+ visitors, up to 45 days |
| AB Tasty | QA Assistant to check the campaign on your website | QA mode by IP address, cookie or URL parameter (URL parameter for A/B tests only); campaign shows as 'IN QA' and is visible only to QA users | See vendor documentation |
| VWO | Live Preview with a QA assistant; automatically generated variation screenshots across browsers | View a live variation through a segment on a custom query parameter; previews do not expose the test to real visitors | See vendor documentation |
Disclosure: Henkan & Partners is a Kameleoon Platinum partner and runs tests on several platforms. The table describes documented features only; it is not a ranking.
AI can speed up QA, but it cannot sign it off
AI assistants and agents are now useful in QA. They can turn a test plan into a list of test cases, write browser-automation scripts that open each variation on several viewports and take screenshots, compare those screenshots with the control, and read the console for new errors. Through the Model Context Protocol (MCP), an agent can also query your analytics to check that goals are arriving. Our article on AI agents in the experimentation workflow covers the wider picture.
Two limits apply. First, AI-generated variation code needs the same QA as human code; faster build makes QA more important, not less. Second, an agent can report that a button exists without noticing that it looks wrong or that the copy is misleading. Use automation to widen coverage across the browser matrix, and keep a human on Tier 1 journeys and on the final sign-off.
Section 6 · Flicker and page speed
Treat flicker and page speed as part of the test, because the fix can hurt more than the flash
Flicker, or flash of original content, is what happens when a client-side test changes the page after the visitor has already seen the original. It is a QA defect twice over: it harms the experience, and it can bias the result, since visitors in the variation see both versions. Most client-side tools reduce it with an anti-flicker snippet, which hides the page (or part of it) until the variation is applied or a timeout expires.
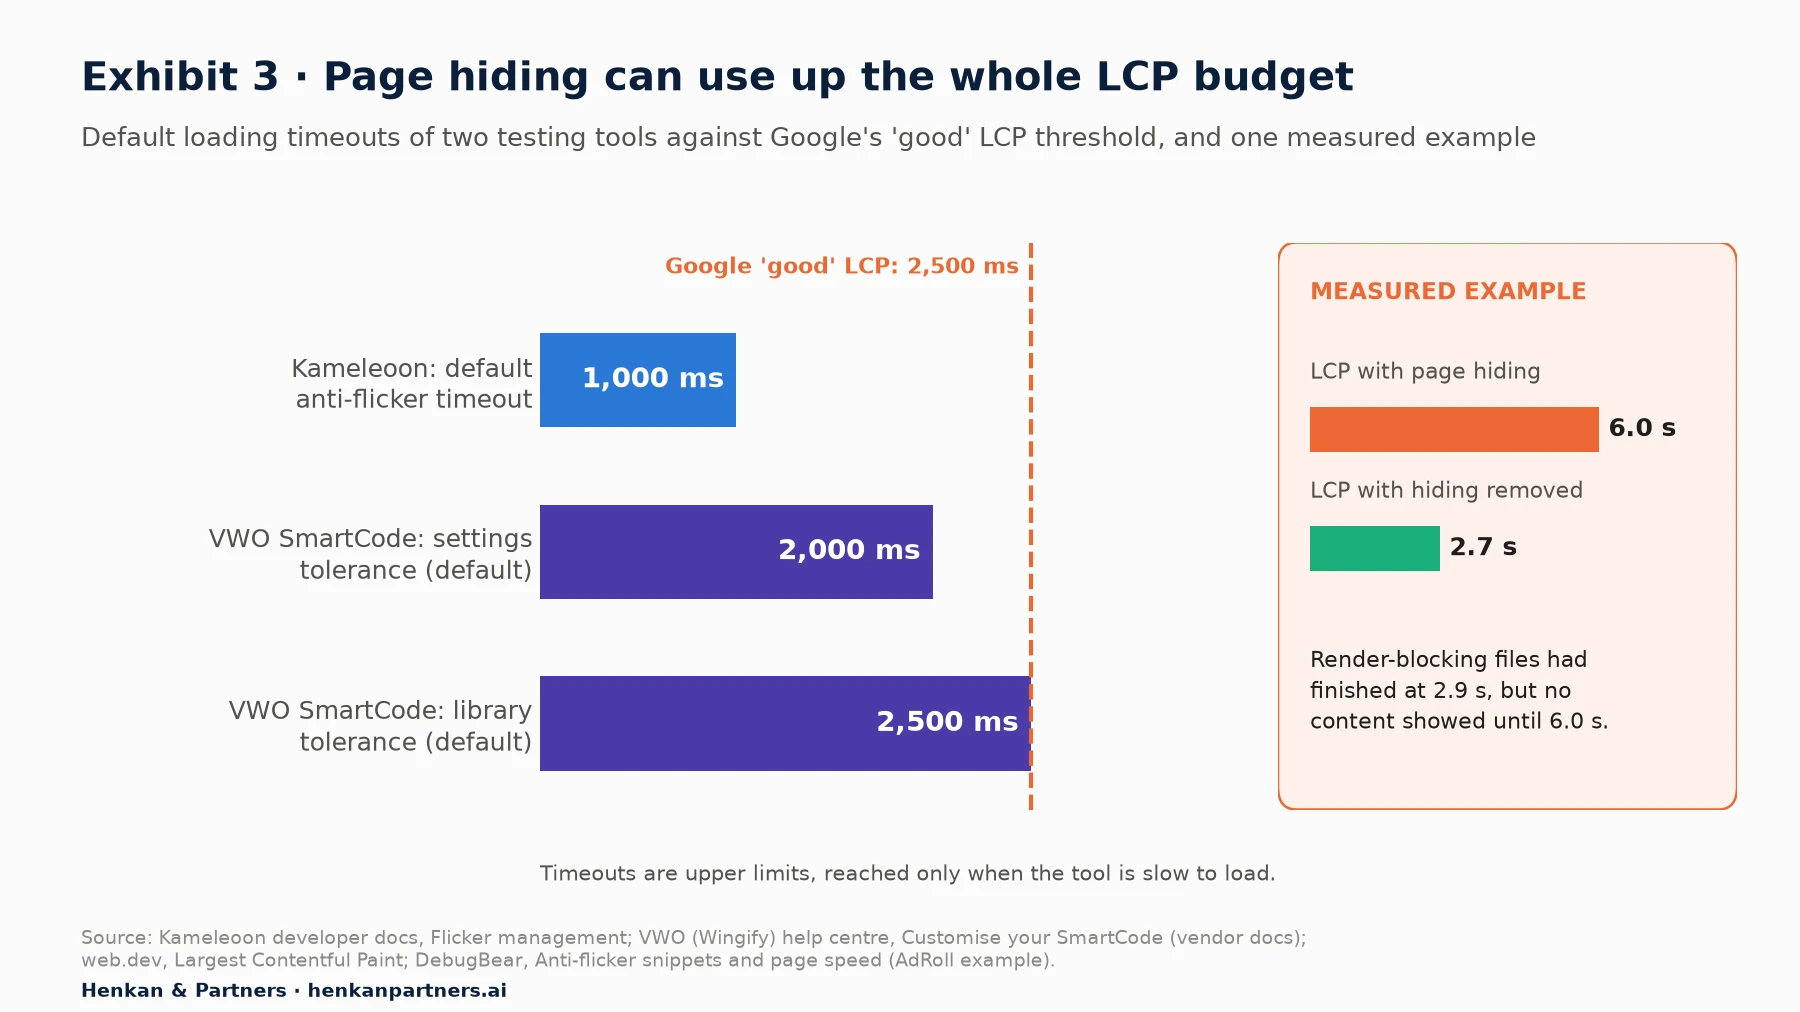
What this shows. Kameleoon's documentation sets a default anti-flicker timeout of 1,000 milliseconds and states that under normal conditions timeouts affect only about 2 to 3% of visitors (vendor data). VWO's SmartCode defaults to 2,000 and 2,500 milliseconds for its two timeouts. Google considers a Largest Contentful Paint (LCP) of 2.5 seconds or less 'good'. Timeouts are only reached when the tool is slow, but when they are, hiding can use up the whole budget, as in DebugBear's example where no content showed until 6.0 seconds.
The web.dev guidance on Cumulative Layout Shift (CLS) is also relevant: a 'good' score is 0.1 or less at the 75th percentile, and unexpected shifts usually come from content added to the page before existing content, or from elements whose size is unknown. A variation that inserts a banner above the fold, or swaps an image of a different size, will shift the layout. It also notes that content often behaves differently in production from development, because test assets are already cached on the developer's machine.
Speed checks before launch
- Measure control and variation separately on a mid-range mobile device and throttled network, not on an office laptop. Compare LCP, CLS and Interaction to Next Paint.
- Keep the anti-flicker timeout as short as your tool allows and hide only the elements that change, not the whole body, where the tool supports it.
- Place the tool's script as the vendor recommends, usually early in the `<head>`, and avoid loading it through a tag manager that fires late.
- Use the tool's 'wait for element' helpers rather than custom polling; Kameleoon, for instance, documents `runWhenElementPresent()` for this purpose.
- Add page speed as a guardrail so a slower variation cannot win on conversion alone without anyone noticing.
If flicker cannot be solved on a given page, that is a sign the test belongs on the server side. Our comparison of client-side and server-side A/B testing sets out when to switch.
Check the SEO basics for redirect tests
Google's guidance on website testing is short and worth following to the letter: do not show search engines different content from users (cloaking); in split-URL tests, use `rel="canonical"` on alternate URLs pointing to the original, and 302 (temporary) redirects rather than 301s; and once the test is over, update the site and remove all elements of the test as soon as possible. Redirect tests also have their own SRM risk: Optimizely lists visitors closing the tab before a redirect completes among the causes of traffic imbalance.
Section 7 · Tracking, analytics and consent
Prove that every goal fires once, in every variation, and that consent does not tilt the groups
A test with perfect design and broken tracking produces a confident wrong answer. Check tracking in each variation with the tool's simulation or debugging panel and with your browser's network tab, not by trusting the goal list in the interface.
- Each goal fires once per action. A click goal that fires twice in the variation (for example because the variation duplicates a button) inflates its conversion rate.
- Goals fire in every variation. If the variation replaces an element, the goal attached to the old element's selector may silently stop firing.
- Revenue is captured correctly, with the right currency, and excluding test orders.
- The experiment and variation IDs reach your analytics tool. Send them to GA4 as an event parameter registered as a custom dimension, so you can analyse the test in the same place as everything else. Our article on e-commerce custom dimensions shows how.
- Counts reconcile. On day one, compare visitors per variation in the testing tool and in analytics. They will not match exactly, but the ratio between variations should be the same in both.
Understand how consent changes who is counted
In Europe, consent decides which visitors a test can count. Two settings interact, and both need checking.
In the testing tool. Kameleoon, for example, offers three behaviours when consent is unknown: disabled (nothing is displayed or stored), delayed (experiments display normally but no data is sent or stored until consent) and restricted (only experiments flagged as technical display). Your choice changes both who sees the test and who is counted. Agree it with your legal and privacy team before launch, not after.
In analytics. With Google's consent mode, the basic implementation blocks Google tags until the visitor interacts with the banner, while the advanced implementation loads tags with consent denied and sends cookieless pings. Visitor counts per variation in GA4 therefore depend on the implementation and on consent rates, which is another reason to compare ratios rather than absolute numbers.
Our view. The dangerous case is a variation that changes the consent rate itself, for example a test that moves or restyles the cookie banner, or changes what appears above it. If one group consents more often, it is also counted more often, and you get a sample ratio mismatch that has nothing to do with the tool. Test the banner on its own, never alongside other changes. Our article on user consent in e-commerce covers the wider rules.
Section 8 · Launch
Launch in steps, and run a sample ratio mismatch check on day one
Launch is not a single click. It is a short sequence: final QA on production with the test live but restricted to QA users, a ramp to real traffic, and a day-one health check.
Ramp exposure, but never down and back up
Ramping means exposing a small share of traffic first, so that a bug harms few visitors, then moving to full allocation. Kohavi, Tang and Xu devote chapter 15 to it, and Xu, Duan and Huang describe LinkedIn's approach in 'SQR: Balancing Speed, Quality and Risk in Online Experiments' (KDD 2018): each ramp phase has a purpose, and moving too slowly wastes time while moving too fast takes risk. In our experience, a risky change (checkout, pricing display, navigation) can run for a few hours to a day on a small share of traffic before going to full allocation; a copy change rarely needs a ramp at all.
One rule is absolute. Do not reduce allocation and then raise it again during a test. Optimizely's documentation warns that down-then-up ramping causes re-bucketing that can irreparably harm the results, and that resetting results does not reset visitor bucketing. If you must change allocation, stop, fix and restart with fresh counts.
Check the sample ratio on day one
A sample ratio mismatch (SRM) occurs when the observed split between variations differs from the configured split by more than chance allows. It is the single most useful trust check, because nearly every kind of technical failure (redirects that lose visitors, targeting that behaves differently per variation, a variation that crashes, bots, tracking that fails in one group) shows up as an SRM. Fabijan et al. classify 25 distinct causes across five stages: assignment, execution, log processing, analysis and interference.
χ² = Σ (observed − expected)² / expected, with 1 degree of freedom for two groups

Example A: 5,100 vs 4,900 visitors, configured 50/50 → χ² = 4.0, p ≈ 0.046 → not an SRM at p < 0.001; keep watching
Example B: 10,300 vs 9,700 visitors, configured 50/50 → χ² = 18.0, p ≈ 0.00002 → SRM: pause and investigate
Kameleoon and Eppo both use a chi-square test with a p-value threshold of 0.001, low enough that it rarely fires by chance even when checked often. Optimizely uses a sequential SRM method that checks continuously, within the limits in Table 3. Whatever your tool, you can run the check yourself in a spreadsheet with the formula above.
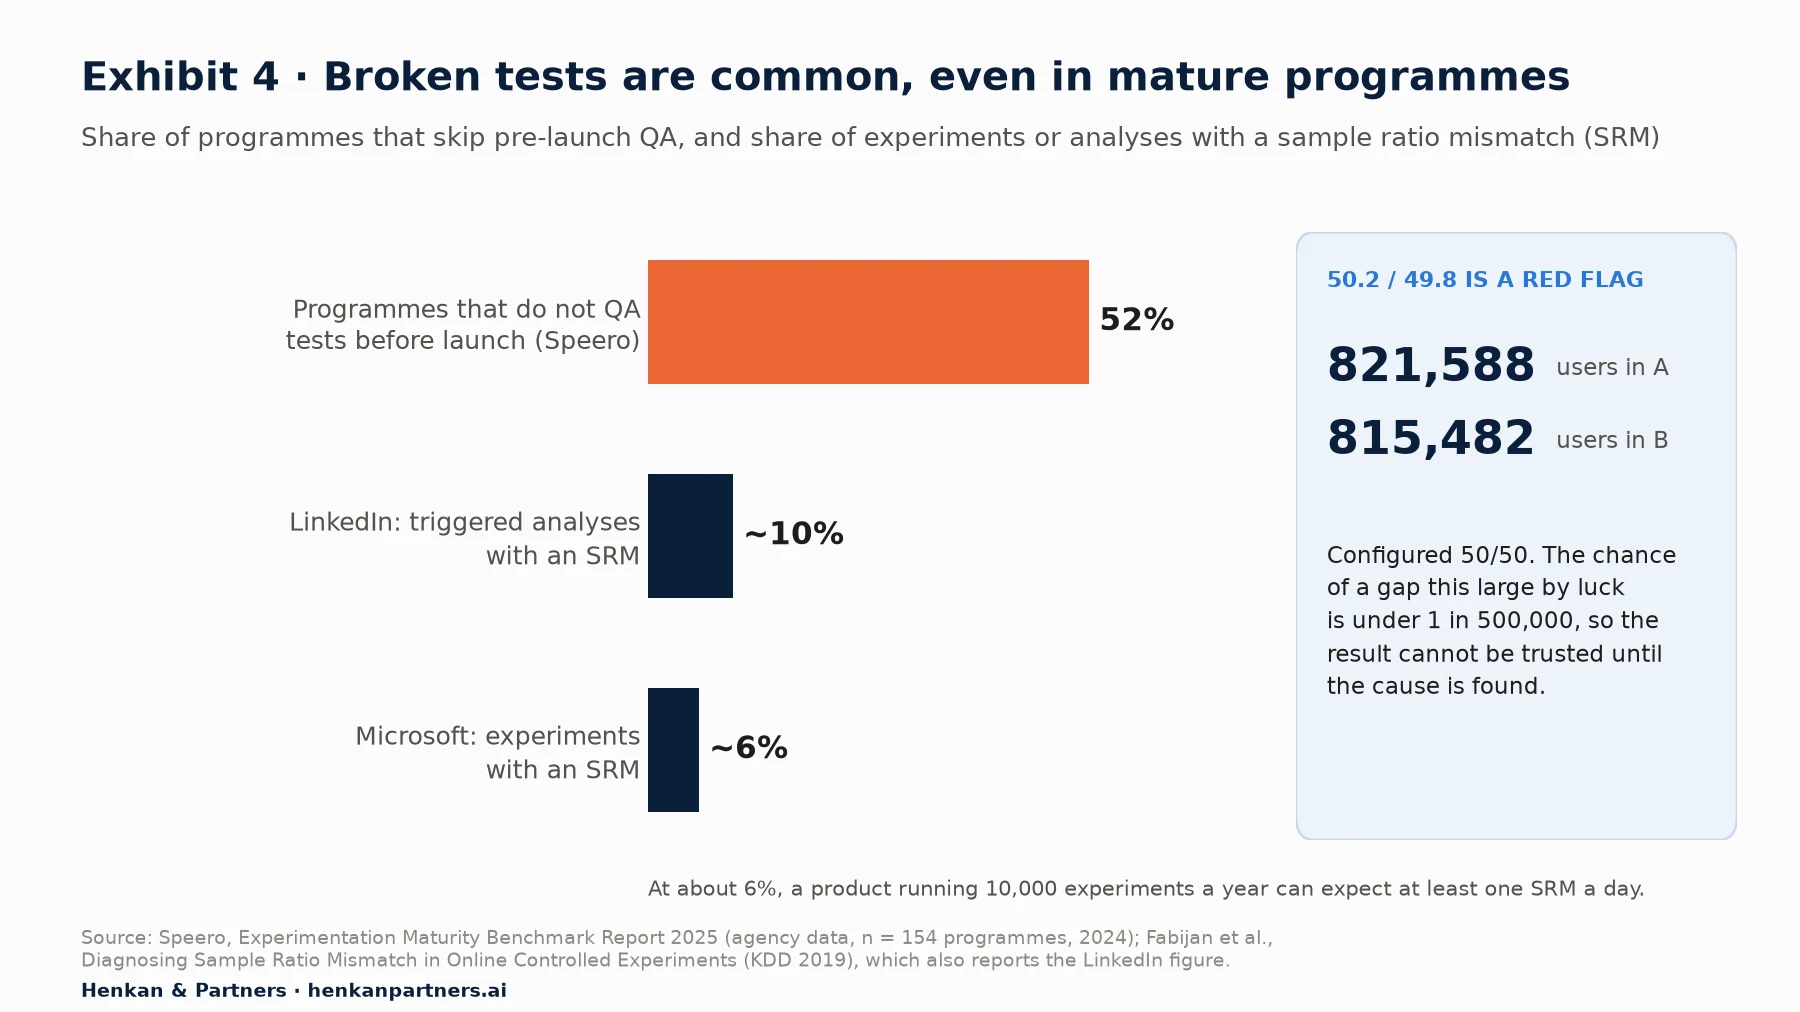
What this shows. An SRM is rarely dramatic. Fabijan et al. give the example of a 50.2/49.8 split, 821,588 against 815,482 users, where the probability of so large a gap by chance is below 1 in 500,000. Nobody would spot that by eye, which is why the check must be a calculation, and why it must run on day one rather than at the readout.
If an SRM is detected, Kameleoon's guidance is to pause, break results down by device, browser, operating system or other data to find the factor that correlates with the imbalance, and fix the cause before relaunching. It notes that results are not always lost if the source can be isolated and excluded. Our advice is more conservative: treat any result from a test with an unexplained SRM as untrustworthy, and restart once the cause is fixed.
Monitor errors and broken journeys in the first hours
Watch JavaScript errors, failed add-to-basket calls and checkout errors by variation during the first hours, and compare with the control. A variation that works in QA can still break for a browser version, a payment method or a product type that QA did not cover.
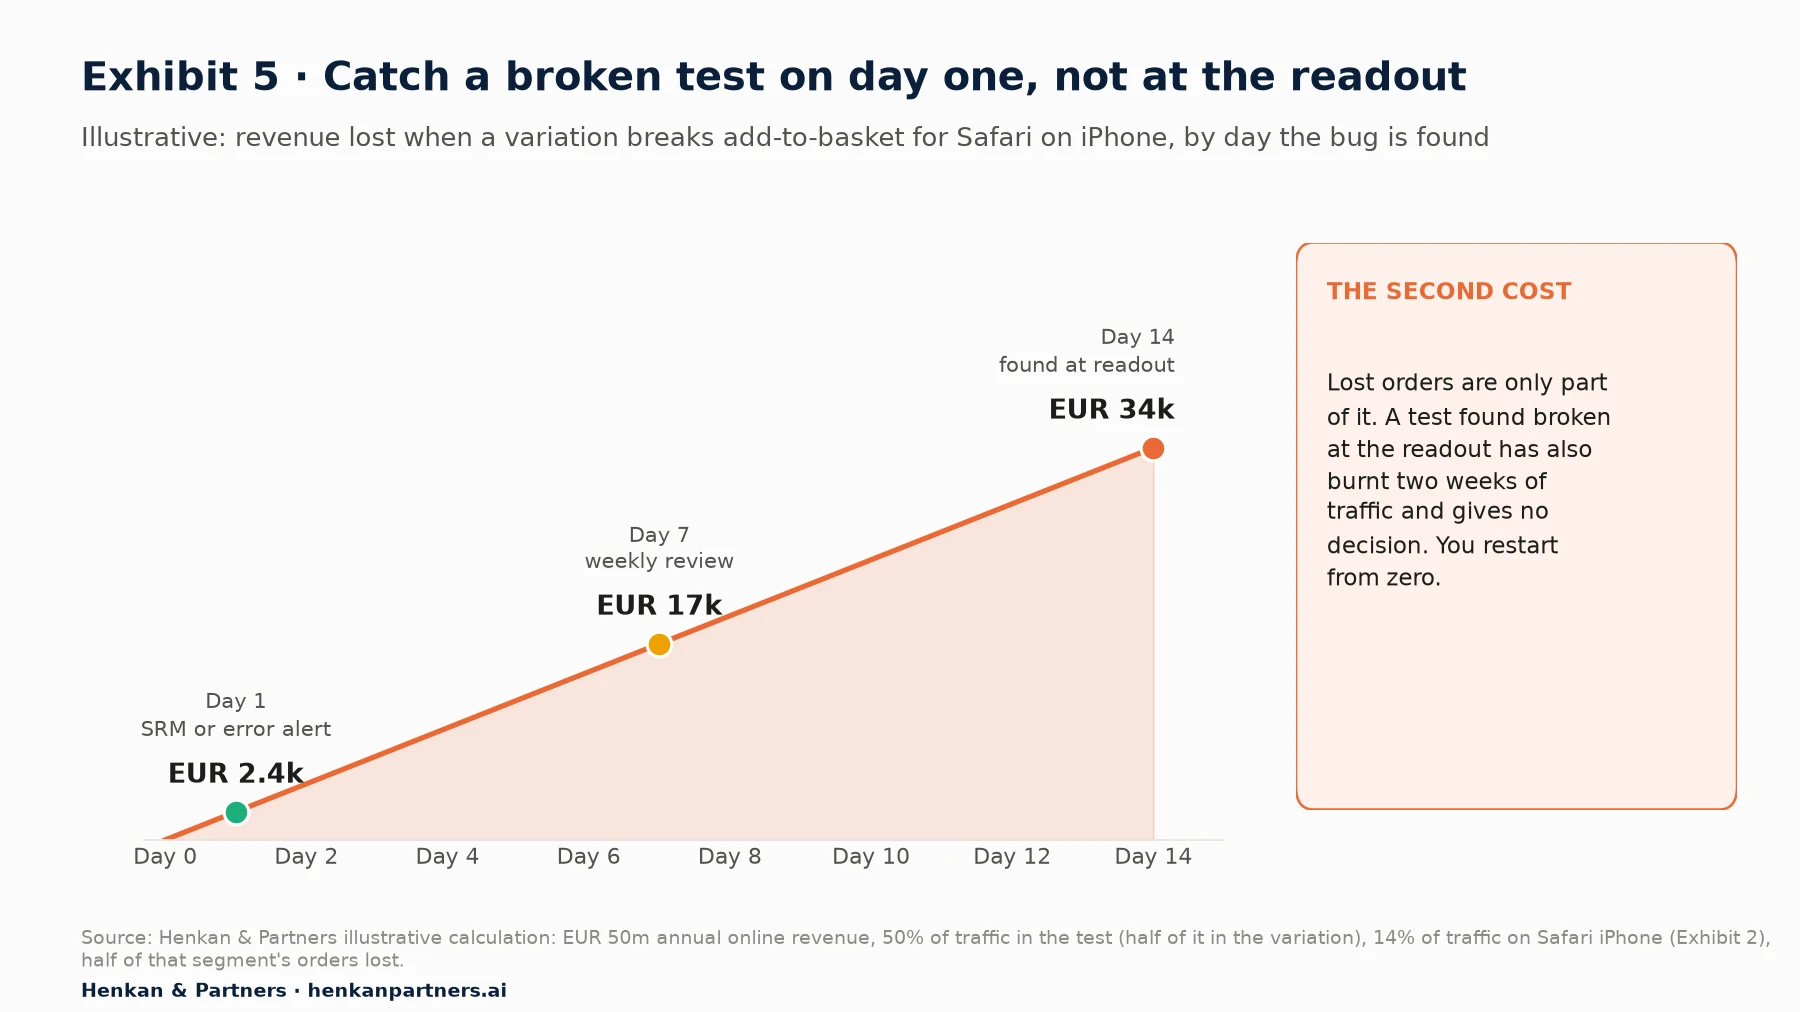
What this shows. In this illustrative case, a site with €50 million of annual online revenue puts half its traffic in a test, so a quarter of visitors see the variation. The variation halves orders for Safari on iPhone, about 14% of traffic. Caught by a day-one SRM or error alert, the loss is about €2,400; found at the day-14 readout, about €34,000, plus two weeks of traffic that produced no usable decision.
Section 9 · During the test
While the test runs, watch the guardrails and leave the primary metric alone
Once the test is live and healthy, the most useful thing the team can do is nothing. The discipline during the test has three parts: do not peek at the primary metric to make decisions, review guardrails and trust checks on a fixed rhythm, and change nothing about the live test.
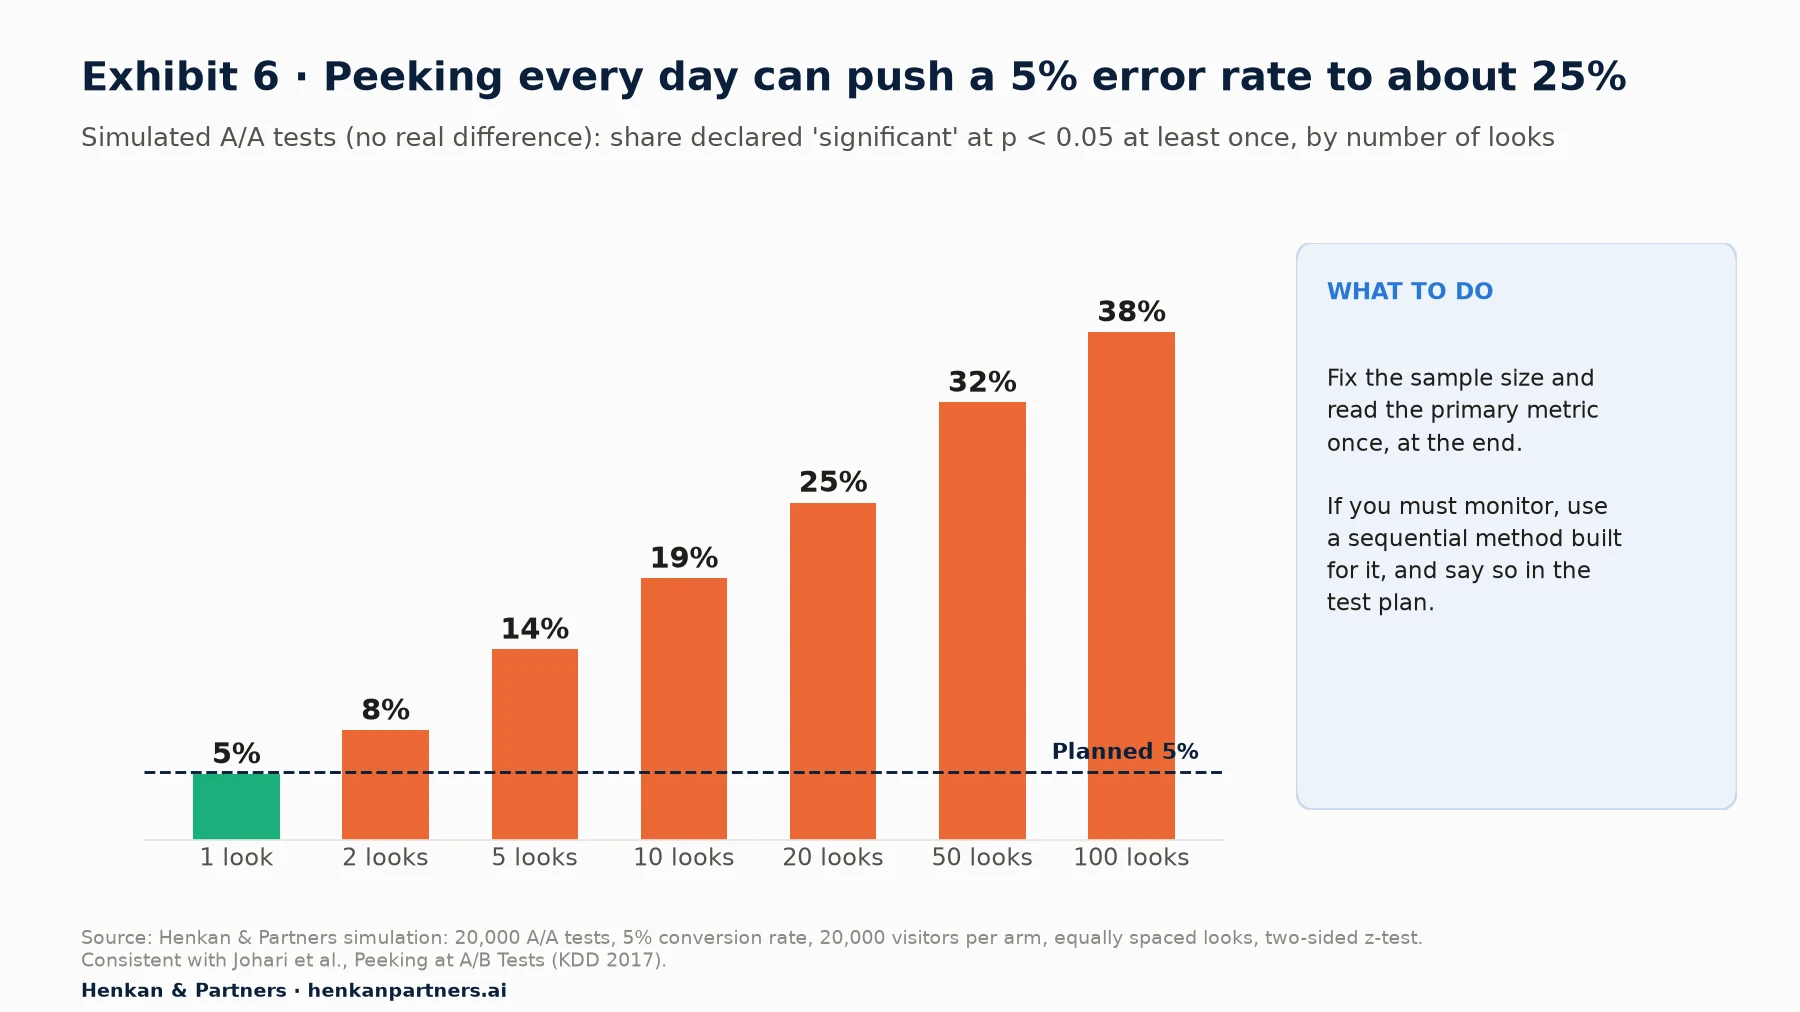
What this shows. In an A/A test there is no real difference, so any 'significant' result is a false positive. With one look at the end, our simulation produced 5%, as designed. Checking 20 times, roughly daily for three weeks, and stopping at the first significant result produced 25%. This is why a fixed-horizon test must be read once, at the planned sample size.
Peeking is a problem only when the method does not allow it. Johari, Pekelis and Walsh showed in 'Peeking at A/B Tests' (KDD 2017) that continuous monitoring invalidates standard p-values, and developed always-valid p-values and confidence intervals, deployed by Optimizely, that remain valid when monitored. Other tools offer sequential or Bayesian options. The checklist point is simple: write in the test plan which method you use and when you are allowed to look, and stick to it.
Review guardrails and trust checks on a fixed rhythm
Guardrails are the exception to 'do not look'. Checking for harm is legitimate, because the decision is asymmetric: you would stop a test that damages revenue or breaks the site, but you would not ship a variation early because it looks good. Set the rhythm in the plan (for example day 1, day 3, then weekly), and at each review re-run the SRM check and look at guardrails only.
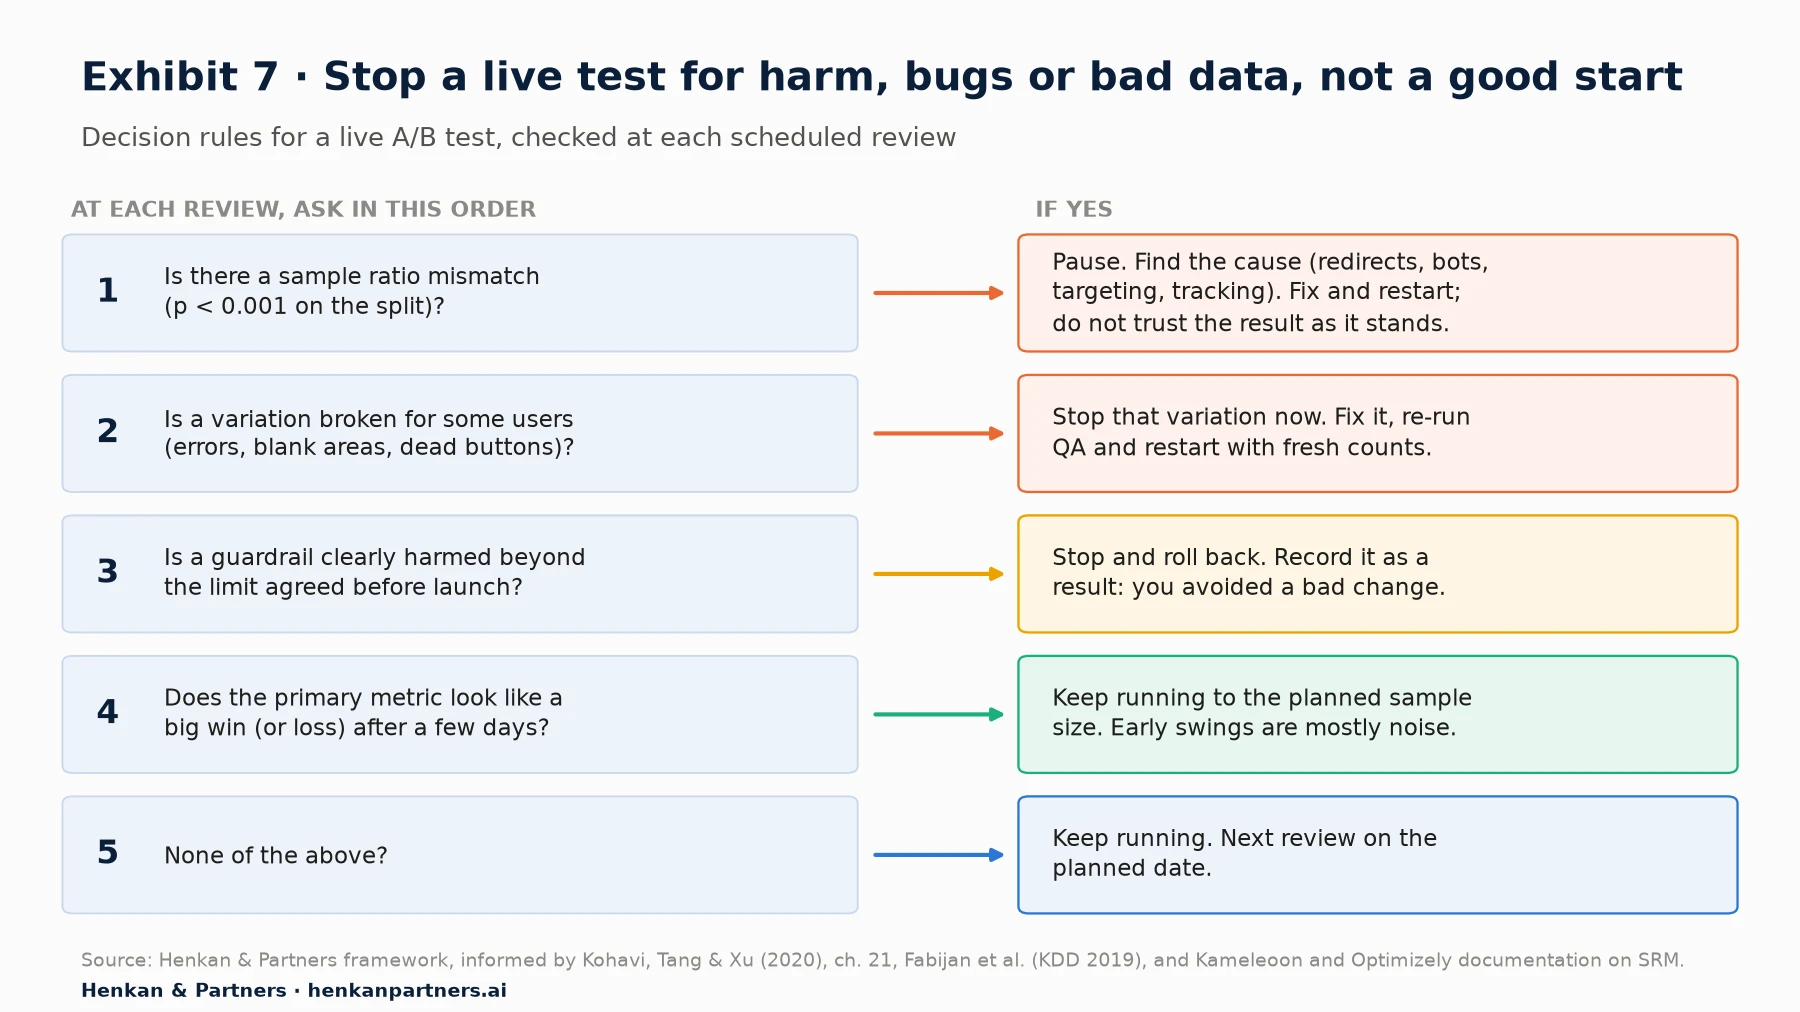
What this shows. The order matters. Data problems come first, because if the split is broken nothing else can be trusted. Harm comes next. A promising primary metric is never, on its own, a reason to stop a fixed-horizon test: early swings in either direction are mostly noise, as Exhibit 6 shows.
Finally, do not edit a live test. Changing a variation's code, the targeting or the goals mid-test means the visitors before and after the change saw different things. If something must change, stop, fix, re-run the checklist and restart with fresh counts. Log every incident in the test record, even when it is fixed, so the analyst knows what happened.
For marketers. Agree the review dates with stakeholders at launch. The question 'how is the test doing?' then has a standard answer: 'healthy, guardrails fine, readout on the 14th'.
For leaders. Reward teams for stopping harmful tests quickly and for waiting on promising ones. A culture that celebrates early 'wins' will produce many that do not replicate. Our article on building an experimentation culture explains why.
Section 10 · After the test
Close every test properly: analyse as planned, record it, switch it off and hard-code the winner
The last phase is the one programmes most often leave unfinished. A test that ends without a documented decision, or a winner left running in the testing tool for months, creates problems that surface long after the team has moved on.
Analyse as planned, then look for reasons to doubt
- Re-run the SRM check on the full sample before looking at anything else.
- Read the primary metric first, with the method and threshold written in the plan, and report the confidence interval, not only the p-value.
- Check the guardrails and state whether any moved beyond its limit.
- Apply Twyman's law. If the result is surprisingly large, look for a tracking or targeting explanation before celebrating.
- Use segments as diagnostics, not as new winners. A variation that 'wins on mobile in Germany' after a flat overall result is usually a multiple-comparisons artefact. If a segment matters, write a new hypothesis and test it.
Record the result in a test repository
Kohavi, Tang and Xu call it institutional memory: a searchable record of every experiment, which lets teams avoid repeating tests, learn from losses and run meta-analyses across tests. A spreadsheet will do at first; what matters is that every test gets the same fields, including the ones that did not win.
| Field | What to record |
|---|---|
| Identity | Test name, ID in the tool, owner, pages, dates, allocation |
| Plan | Hypothesis, research evidence, primary metric, guardrails, sample size, MDE, method |
| QA record | Checklist sign-offs, browser-device matrix used, screenshots of each variation |
| Health | SRM result, incidents during the test and how they were handled |
| Result | Primary metric with interval, guardrails, decision (ship, stop, iterate) and reason |
| Learning | What the result says about customers, in one or two sentences, and the next test it suggests |
Switch the test off and hard-code the winner
When a variation wins, it is tempting to push it to 100% in the testing tool and move on. Treat this as a short bridge, not a solution. The change still depends on client-side code running on top of the page, so it keeps any flicker and speed cost, and it can break silently when the underlying page changes. Google's guidance points the same way: once the test is over, update the site with the chosen variation and remove all elements of the test as soon as possible.
Put the winning change into the codebase or the content management system, deploy it, then switch the test off and remove its code, redirects and any QA cookies or parameters. Record the ship date in the repository. When a variation loses, switching off is just as important: an old test left running at 0% or on a forgotten page is a common source of conflicts with new tests.
Section 11 · What to do next
What to do next
1. Adopt the one-page checklist this week
Copy Table 1 into your test plan template, assign an owner to each line, and make 'no ticks, no launch' the rule from the next test. Start with the lines you skip today rather than trying to perfect all of them at once.
2. Build your browser-device matrix from your own data
Pull the last 90 days of sessions and revenue by browser and device for your main page types, set your Tier 1, 2 and 3 pairs, and make sure the team has real devices, or a device cloud, for every Tier 1 pair.
3. Automate the SRM check and the day-one review
Turn on your tool's SRM alert if it has one, and add a simple chi-square check on your own data if it does not. Put a day-one review in the calendar for every launch, with error and guardrail dashboards ready.
4. Run an A/A test to validate the set-up
An A/A test, in which both groups see the same page, checks the whole chain: randomisation, tracking, consent, analytics integration. If it shows an SRM or a 'significant' difference more often than expected, fix the plumbing before running more A/B tests.
5. Get a second pair of eyes on your programme
Henkan & Partners audits experimentation programmes and runs QA and test development for teams on Kameleoon, Optimizely, AB Tasty and VWO. If you want an independent check of your set-up, your checklist or a test you do not quite trust, Talk to us.
FAQ
Frequently asked questions about A/B test QA
Frequently asked questions
What is an A/B test QA checklist?
An A/B test QA checklist is a list of checks a team completes before, at, during and after launching an online experiment. It covers the test plan (hypothesis, primary metric, guardrails, sample size), variation rendering and function across browsers and devices, flicker and page speed, tracking and consent, the day-one sample ratio check, rules for stopping early, and documentation and clean-up after the test.
How do you QA an A/B test before launch?
Force each variation on the live site with the tool's preview, simulation or QA mode, then test the full journey on your most-used browser-device pairs. Check that every goal fires once in every variation, that the experiment ID reaches your analytics, that targeting includes and excludes the right visitors, and that the variation does not add flicker, layout shift or JavaScript errors.
How long should A/B test QA take?
In our experience, a simple copy or layout test needs one to two hours of QA, and a test touching checkout, pricing or navigation needs half a day to a day, including a retest after fixes. It is small compared with the cost of a test that runs for weeks and produces a result nobody can trust.
What is sample ratio mismatch in A/B testing?
A sample ratio mismatch (SRM) is when the observed split of visitors between variations differs from the configured split by more than chance allows, for example 52/48 in a test set to 50/50 with large samples. It signals a technical problem such as broken redirects, targeting errors, bots or tracking failures. About 6% of experiments at Microsoft showed an SRM, according to Fabijan et al. (KDD 2019).
How do I check for sample ratio mismatch?
Run a chi-square goodness-of-fit test on the visitor counts per variation against the configured split. Kameleoon and Eppo flag an SRM when the p-value is below 0.001. Run the check on day one, at each scheduled review and before analysing the final result.
What is flicker in A/B testing and how do you prevent it?
Flicker is when visitors briefly see the original page before a client-side test applies the variation. Anti-flicker snippets hide the page until the variation loads or a timeout expires, but can delay Largest Contentful Paint. Keep timeouts short, hide only the changed elements, load the tool early, use the tool's wait-for-element helpers, or move the test server-side.
Can I look at A/B test results before the test ends?
You can look at guardrails and data-quality checks at any time. You should not use the primary metric to decide early unless your method is built for continuous monitoring, such as a sequential test. In our simulation, checking a fixed-horizon test 20 times raised the false positive rate from 5% to about 25%.
When should you stop an A/B test early?
Stop early only if there is a sample ratio mismatch, if a variation is broken for some users, or if a guardrail metric is clearly harmed beyond the limit agreed before launch. A primary metric that looks like a big win after a few days is not a reason to stop a fixed-horizon test.
What should you do after an A/B test ends?
Re-run the SRM check, analyse the primary metric and guardrails as planned, record the result and learning in a test repository, and switch the test off. If a variation wins, hard-code it in the site and remove the test code rather than leaving it running at 100% in the testing tool.
Key terms
- A/B test
- A controlled experiment that randomly splits visitors between a control and one or more variations and compares outcomes. It matters because it separates the effect of a change from everything else going on.
- Quality assurance (QA)
- The checks that confirm a test works as designed before and after launch. It matters because a broken test harms customers and produces results that cannot be trusted.
- Primary metric
- The single metric, fixed before launch, that decides the test. It matters because choosing the metric after seeing the data inflates false wins.
- Guardrail metric
- A metric that must not get worse, such as page speed, errors or order value, or a trust check such as the sample ratio. It matters because a variation can win on the primary metric while damaging the business or the data.
- Minimum detectable effect (MDE)
- The smallest true effect a test can reliably detect given its sample size, significance level and power. It matters because it sets how long a test must run.
- Statistical power
- The probability that a test detects an effect of at least the MDE when it exists, commonly set at 80%. It matters because underpowered tests produce flat results that mean nothing.
- Sample ratio mismatch (SRM)
- A difference between the observed and configured traffic split that is larger than chance allows. It matters because it is the most common signal that a test is technically broken.
- Chi-square test
- A statistical test that compares observed counts with expected counts, used to detect SRM. It matters because it turns 'the split looks a bit off' into a clear yes or no.
- Flicker
- The brief display of the original page before a client-side variation applies. It matters because it harms the experience and can bias results.
- Anti-flicker snippet
- Code that hides the page or elements until a variation is applied or a timeout expires. It matters because it prevents flicker but can delay the moment content appears.
- Largest Contentful Paint (LCP)
- A Core Web Vitals metric for when the largest visible element renders, 'good' at 2.5 seconds or less. It matters because testing scripts can delay it.
- Cumulative Layout Shift (CLS)
- A Core Web Vitals metric for unexpected movement of page content, 'good' at 0.1 or less. It matters because variations that insert or resize elements can shift the layout.
- Peeking
- Repeatedly checking a fixed-horizon test's results and stopping when they look significant. It matters because it multiplies the false positive rate.
- A/A test
- A test in which both groups see the same experience. It matters because it validates randomisation, tracking and analysis before real tests rely on them.
- Test repository
- A searchable record of every experiment's plan, QA, result and learning. It matters because it turns individual tests into institutional memory.
Sources
All sources were checked in September 2026. Kameleoon, Optimizely, AB Tasty, VWO and Eppo features and figures come from their own documentation and are vendor data; Speero figures are agency data from a self-assessment benchmark. Exhibit 2 combines StatCounter data using our own estimate of pair shares. Exhibits 1 and 7 and Tables 1 and 4 are Henkan & Partners frameworks; Exhibit 6 is our own simulation; Exhibit 5 and Table 2 are illustrative calculations.
- Kohavi, R., Tang, D. & Xu, Y. (2020). Trustworthy Online Controlled Experiments: A Practical Guide to A/B Testing. Cambridge University Press (ch. 3, 5, 8, 15, 19 and 21).
- Kohavi, R., Tang, D. & Xu, Y. (2020). Speed Matters, chapter 5 of Trustworthy Online Controlled Experiments.
- Fabijan, A., Gupchup, J., Gupta, S., Omhover, J., Qin, W., Vermeer, L. & Dmitriev, P. (2019). Diagnosing Sample Ratio Mismatch in Online Controlled Experiments: A Taxonomy and Rules of Thumb for Practitioners. KDD 2019.
- Johari, R., Pekelis, L. & Walsh, D. (2017). Peeking at A/B Tests: Why it matters, and what to do about it. KDD 2017.
- Xu, Y., Duan, W. & Huang, S. (2018). SQR: Balancing Speed, Quality and Risk in Online Experiments. KDD 2018.
- Miller, E. (2010). How Not To Run an A/B Test.
- Speero (2025). Experimentation Maturity Benchmark Report 2025, Methods & Process (agency data).
- Kameleoon (n.d.). Simulate a campaign (vendor documentation).
- Kameleoon (n.d.). Sample Ratio Mismatch (vendor documentation).
- Kameleoon (n.d.). Flicker management and performance (vendor documentation and data).
- Kameleoon (n.d.). Consent management (vendor documentation).
- Kameleoon (n.d.). Manage your projects (IP exclusion; vendor documentation).
- Optimizely (n.d.). Test your experiments in Optimizely Experimentation (vendor documentation).
- Optimizely (n.d.). Optimizely's automatic sample ratio mismatch detection (vendor documentation).
- Optimizely (n.d.). Possible causes for traffic imbalances (vendor documentation).
- AB Tasty (n.d.). How to use the QA mode (vendor documentation).
- VWO / Wingify (n.d.). Preview test variations and Verify changes made to your test variation on the live website (vendor documentation).
- VWO / Wingify (n.d.). Customize your SmartCode (vendor documentation).
- Eppo (n.d.). Sample Ratio Mismatch (vendor documentation).
- Google, web.dev (n.d.). Largest Contentful Paint (LCP) and Cumulative Layout Shift (CLS).
- DebugBear (n.d.). Anti-flicker snippets from A/B testing tools and page speed.
- Google Search Central (n.d.). Minimize A/B testing impact in Google Search.
- Google (n.d.). Consent mode overview. Google Tag Platform.
- Google (n.d.). Define internal traffic. Analytics Help.
- StatCounter Global Stats (2026). Desktop vs mobile vs tablet market share, Europe, mobile and desktop browser market share, Europe, and mobile OS market share, Europe, August 2026.
- Henkan & Partners. Illustrative sample-size calculations (two-proportion formula, α = 0.05 two-sided, 80% power), A/A peeking simulation and broken-test cost illustration.