Focus
Guardrail Metrics in A/B Testing: How to Choose Them and When to Stop a Test
Alexandre Suon · 2026-09-29
A test can win on its primary metric and still hurt the business: more sign-ups but fewer orders, more clicks but slower pages, more revenue but more returns. Guardrail metrics are the measures you agree not to harm before a test starts. This guide shows e-commerce teams how to build the full metric system of an A/B test, choose three to five guardrails by test type, set harm thresholds, and decide when to stop a test early.
Executive summary
- Every A/B test needs a metric system, not a single metric. One primary metric decides the test, a few secondary metrics explain it, and three to five guardrail metrics protect revenue, the customer experience and the data. Microsoft's experimentation team groups metrics the same way: data quality, overall evaluation criterion (OEC), guardrail, and local feature or diagnostic metrics.
- Guardrails create much of the value of testing. At Spotify, 42% of experiments end with the team deciding not to ship after guardrail metrics detect a problem, against a win rate of about 12%. Airbnb's guardrail system flags about 25 experiments a month for review, and about 5 of them are stopped before launch.
- E-commerce guardrails come in three families. Business guardrails (revenue per visitor, margin, returns, cancellations, customer service contacts), experience guardrails (Core Web Vitals, errors, bounce) and trust guardrails (sample ratio mismatch, tracking coverage). Speed alone is worth a guardrail: Bing found every tenth of a second worth $18 million a year.
- Choose guardrails by test type and keep the list short. With ten independent guardrails each tested for harm at 2.5%, the chance of at least one false alarm is about 22%. Our guardrail picker gives each common e-commerce test type a short, specific set.
- Every guardrail needs a harm threshold and enough power. A non-inferiority margin states how much harm you will accept. Tight margins are expensive: at a 3% conversion rate, proving that conversion did not fall by more than 2% needs about one million visitors per group.
- Stop early for harm, never for a win. Harm checks can run from day one with methods built for repeated looks, such as sequential tests or alpha spending. A primary metric that looks good after a few days is not a reason to stop a fixed-horizon test.
Section 1 · The metric system
Every A/B test needs a metric system: one metric decides, a few explain, a few protect
Most test plans in e-commerce name one metric, usually conversion rate, and a long list of 'things we will also look at'. That is not a metric system. It gives no rule for what happens when the metrics disagree, and they often do. A variation that raises add-to-basket clicks may lower orders. A promotion that raises orders may lower margin. A faster checkout may raise orders and cancellations at the same time.
A metric system gives each metric a role, fixed before launch. The role decides how the metric is tested and what the team does when it moves.
Guardrail metrics are metrics that an A/B test is not trying to improve but must not harm, such as revenue per visitor, page speed, error rates or the traffic split. Each guardrail has a harm threshold agreed before launch; if a variation breaches it, the variation is not shipped, whatever the primary metric says.
The research literature uses the same idea with slightly different names. Microsoft's experimentation platform team describes four classes of metrics: data quality metrics, which tell you whether the experiment ran correctly; overall evaluation criterion (OEC) metrics, which decide whether it was a success; guardrail metrics, 'which we do not want to significantly harm when making a ship decision'; and local feature and diagnostic metrics, which explain what happened (Dmitriev et al., KDD 2017). Kohavi, Tang and Xu use goal, driver and guardrail metrics in their textbook, and distinguish organisational guardrails, which protect the business, from trust-related guardrails, which protect the result. Spotify's decision rule uses success, guardrail, deterioration and quality metrics (Schultzberg et al., 2024).
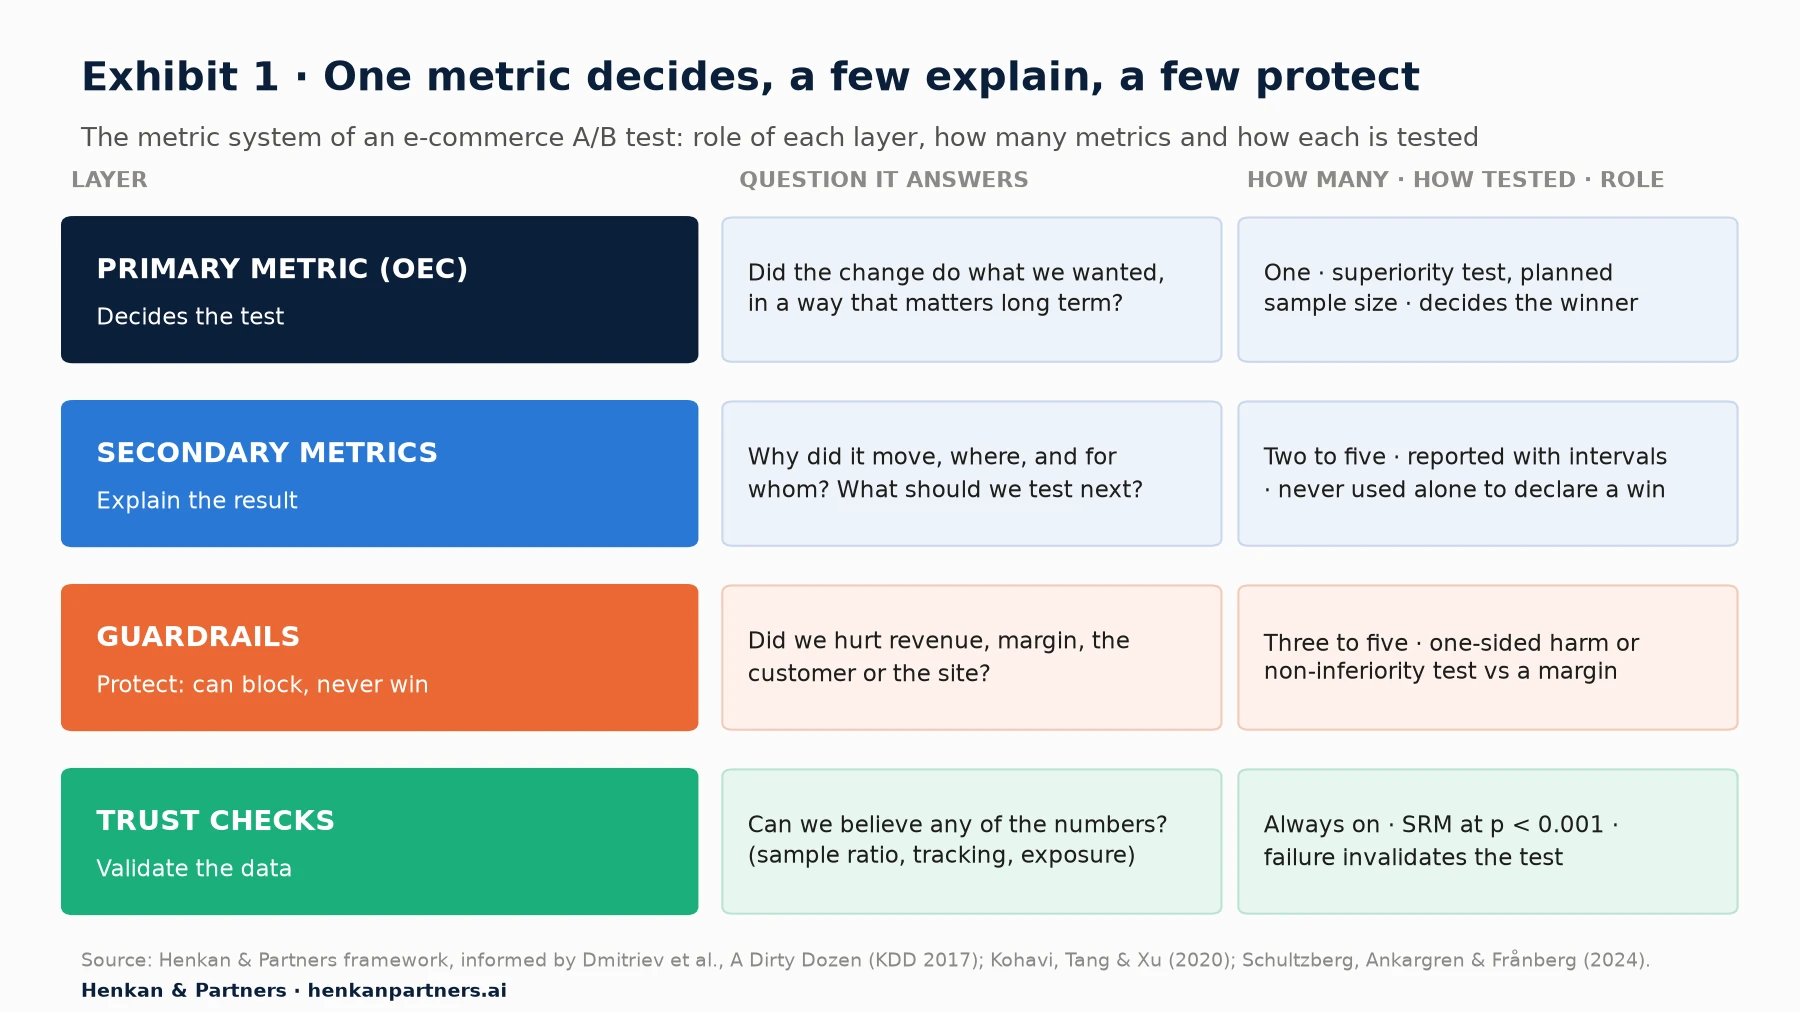
What this shows. Each layer answers a different question and is tested differently. Only the primary metric can make a variation a winner. Guardrails can only stop a variation, never make it a winner. Secondary metrics decide nothing on their own: they explain the result and feed the next hypothesis. The trust checks sit underneath everything, because if the data is broken no other number counts.
| Role | Question it answers | How many | How it is tested | What happens when it moves |
|---|---|---|---|---|
| Primary metric (OEC) | Did the change do what we wanted, in a way that matters long term? | One (or one composite) | Superiority test, two-sided, with planned sample size | Decides the test |
| Secondary metrics | Why did the primary metric move, and where? | Two to five | Reported with confidence intervals; corrected for multiple comparisons if used to claim wins | Explains; feeds the next test |
| Business and experience guardrails | Did we hurt revenue, margin, the customer or the site? | Three to five | One-sided harm test or non-inferiority test against a margin | Blocks shipping if breached |
| Trust guardrails | Can we believe the numbers at all? | Two or three, on every test | Sample ratio mismatch test (typically p < 0.001); tracking coverage checks | Invalidates the test until fixed |
If you are new to the statistics behind these tests, our guide to A/B testing statistics for marketers explains significance, power and the main model families. The essential guide to A/B testing covers the full test process.
Section 2 · Why guardrails matter
Guardrails are where a large share of the value of testing hides
Teams usually count test value in winners. The companies with the most mature programmes count something else as well: the bad changes they did not ship. Those decisions come mostly from guardrails.
- Spotify. Roughly 12% of experiments win, but 42% 'result in the team deciding not to ship after guardrail metrics (metrics that monitor for unintended regressions) detect problems' (Spotify Confidence, 2026, vendor data).
- Airbnb. An automated guardrail system flags 'roughly 25 experiments per month for escalation/review. Of these 80% eventually launch after discussion between stakeholders and additional analysis, and 20% (5 per month) are stopped before launch' (Airbnb Tech Blog, 2021).
- Microsoft. The platform raises alerts when metrics move 'drastically and out of the normal range' during a test, and enables automatic shutdown for some experiments. A Bing test was shut down automatically when a bug served 404 pages (Microsoft ExP, 2021).
- Netflix. A sequential test on play-delay, the time between pressing play and playback starting, detected a regression in a new app version in about 60 seconds (Netflix Technology Blog, 2024).
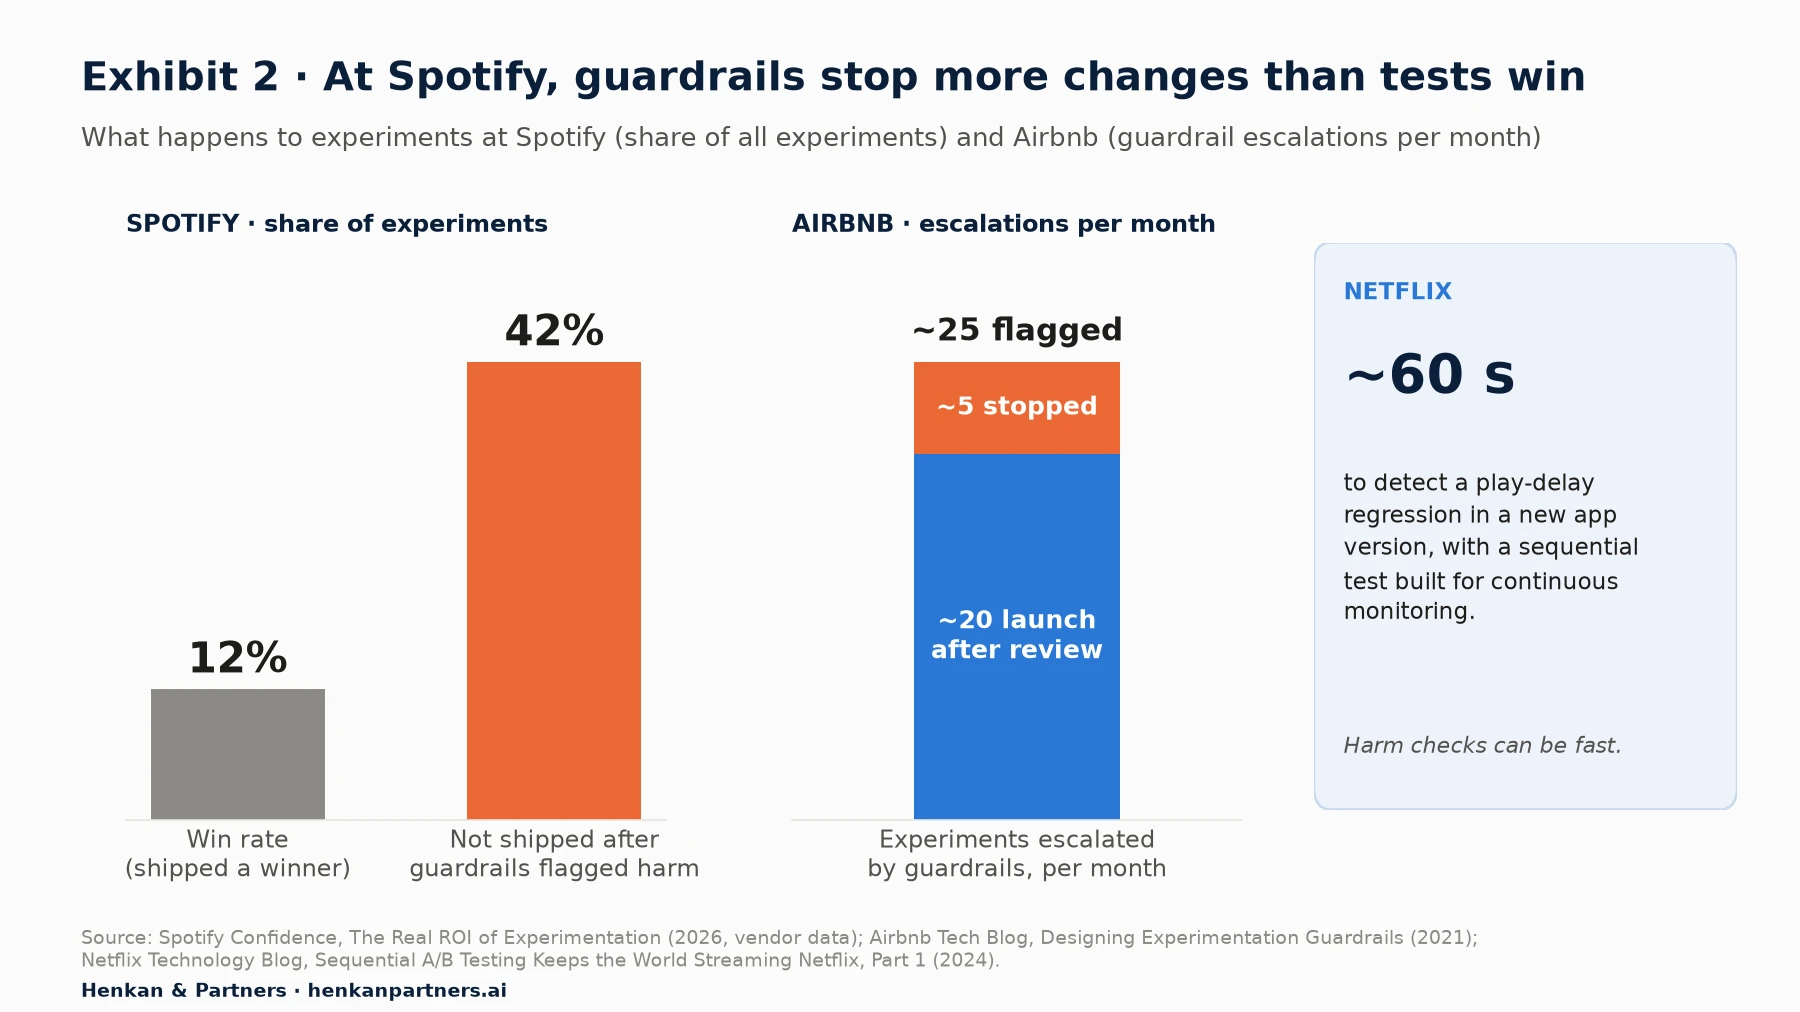
What this shows. At Spotify, the share of experiments stopped by guardrails is three and a half times the win rate. At Airbnb, most flagged experiments still launch after discussion: the guardrail forces a conversation rather than an automatic veto. For an e-commerce programme the lesson is the same. If you report only winners, you under-report what testing is worth, and you under-invest in the guardrails that produce the rest.
Guardrails also protect the team from its own success metric. Kohavi, Tang and Xu describe a Bing change that raised revenue by 12%, over $100 million a year, and explain why revenue alone is not a sufficient OEC: a search engine can always make more money in the short term by showing more ads, and lose users. Bing's OEC 'weighs revenue against user-experience metrics', so that the win counted only because 'user-experience metrics did not significantly degrade'. Every e-commerce team has a version of this trap: discounts, pop-ups, urgency messages and aggressive upsells tend to raise the headline number while charging a cost somewhere else.
Our view. Report two numbers to leadership every quarter: tests shipped as winners, and harmful changes stopped by guardrails. The second number is often larger, and it is the one that justifies the discipline. Our article on measuring personalisation ROI makes the same point about holdouts: the value you can prove is the value you protect.
Section 3 · The OEC
Pick a primary metric that stands for long-term value, not the easiest number to move
The primary metric is the one guardrails exist to support, so it needs to be right first. Kohavi, Tang and Xu define the overall evaluation criterion (OEC) as a quantitative measure of the experiment's objective that 'must be measurable in the short term (the duration of an experiment) yet believed to causally drive long-term strategic objectives'. Deng and Shi (KDD 2016) add two tests for any candidate metric: directionality (does it move in the direction that reflects real value?) and sensitivity (does it move enough to detect in a test of realistic size?).
Microsoft's ExP team summarises the properties of a good metric as STEDII: sensitivity, trustworthiness, efficiency, debuggability, interpretability and actionability, and inclusivity and fairness. A metric that fails on sensitivity will never reach significance; a metric that fails on directionality will reach significance for the wrong reasons.
The usual choices in e-commerce, and their blind spots
| Primary metric | Strength | Blind spot | Guardrail that covers it |
|---|---|---|---|
| Conversion rate (orders per visitor) | Sensitive, easy to explain | Ignores basket size, discounts and returns | Revenue per visitor, margin, returns |
| Revenue per visitor (RPV) | Captures both conversion and basket value | Noisy (large baskets swing it); ignores margin and returns | Margin per visitor, returns, conversion rate |
| Gross margin per visitor | Closest to profit in the test window | Needs cost data per product; less sensitive | Revenue per visitor, conversion rate |
| Add-to-basket rate or clicks | Very sensitive, fast | Shifts clicks without moving orders | Conversion rate, revenue per visitor |
| Sign-ups, leads or app installs | Strategic, measurable | Can be bought with friction elsewhere | Revenue per visitor, bounce, unsubscribes |
One of Kohavi and colleagues' rules of thumb is that 'reducing abandonment is hard, shifting clicks is easy' (KDD 2014). If your primary metric is a click, the guardrail has to sit further down the funnel. Our article on e-commerce KPIs and benchmarks gives typical ranges for conversion rate, order value and return rates to help you set realistic expectations.
When one metric is not enough, price the trade-off into a composite
Some tests have a known trade-off that no single metric captures. Kohavi, Tang and Xu describe an OEC for Amazon's e-mail programme that credits the revenue from each campaign but subtracts the estimated lifetime value lost when recipients unsubscribe:
OEC = (Σ revenue from the campaign − number of unsubscribes × lifetime loss per unsubscribe) ÷ number of users

E-commerce analogue for a sign-up overlay (Henkan & Partners framework):
Value per visitor = gross margin per visitor + (new subscribers per visitor × value per subscriber) − (unsubscribes per visitor × value per subscriber)
The composite forces the team to agree a value per subscriber before launch, which is exactly the conversation that usually never happens. If the business cannot agree a value, use the simpler system: primary metric on sign-ups, revenue per visitor as a strict guardrail. Section 6 works through an example.
Section 4 · Types of guardrails
E-commerce guardrails come in three families: business, experience and trust
A useful guardrail catalogue is organised by what it protects. Each family has different data sources, different time lags and different owners.
Business guardrails protect revenue and margin
- Revenue per visitor. The default guardrail when the primary metric is conversion rate, a click or a sign-up. It catches variations that win orders but shrink baskets.
- Gross margin per visitor or discount rate. Essential for promotions, pricing displays, free-delivery thresholds and product recommendations that may push cheaper items.
- Returns and cancellations. A variation that oversells (size guidance, urgency messages, 'buy the look' bundles) can raise orders and returns together. In the United States, retail returns were projected at 16.9% of annual sales in 2024, $890 billion (NRF and Happy Returns, 2024). The catch is time: returns arrive weeks after the order, so this guardrail is read on a follow-up window after the test ends.
- Customer service contacts. Contacts per order, or chat openings per visitor, catch confusing copy, missing delivery information and payment failures that do not show up as errors.
- Unsubscribes and consent. For tests on e-mail capture, pop-ups and consent banners, the opt-out rate and the consent rate protect future marketing reach.
Experience guardrails protect the visitor and the site
- Core Web Vitals. Largest Contentful Paint (LCP), Interaction to Next Paint (INP) and Cumulative Layout Shift (CLS), measured separately for control and variation from real users. Client-side testing scripts, new images and injected components can all degrade them.
- JavaScript errors and failed requests. Errors per session or per page view, split by browser and device. This is the fastest harm signal you have.
- Bounce and exit rates on the tested page. Useful for overlays and landing-page changes; a weaker signal elsewhere, because a bounce can mean the visitor found what they needed.
- Search and navigation health. Zero-result searches and filter usage, for tests that touch search, menus or category pages.
Speed deserves its place because the evidence is strong and consistent. In a study of 37 European and American brand sites, a 0.1-second improvement in mobile site speed, measured across four speed metrics, was associated with an 8.4% increase in retail conversions and 9.2% more spending by retail consumers (Deloitte and 55 for Google, 2020). Bing measured that every 100 milliseconds of speed-up improved revenue by 0.6% (Kohavi et al., KDD 2014), later valued at $18 million of incremental annual revenue per tenth of a second (Kohavi, Tang & Xu, 2020).
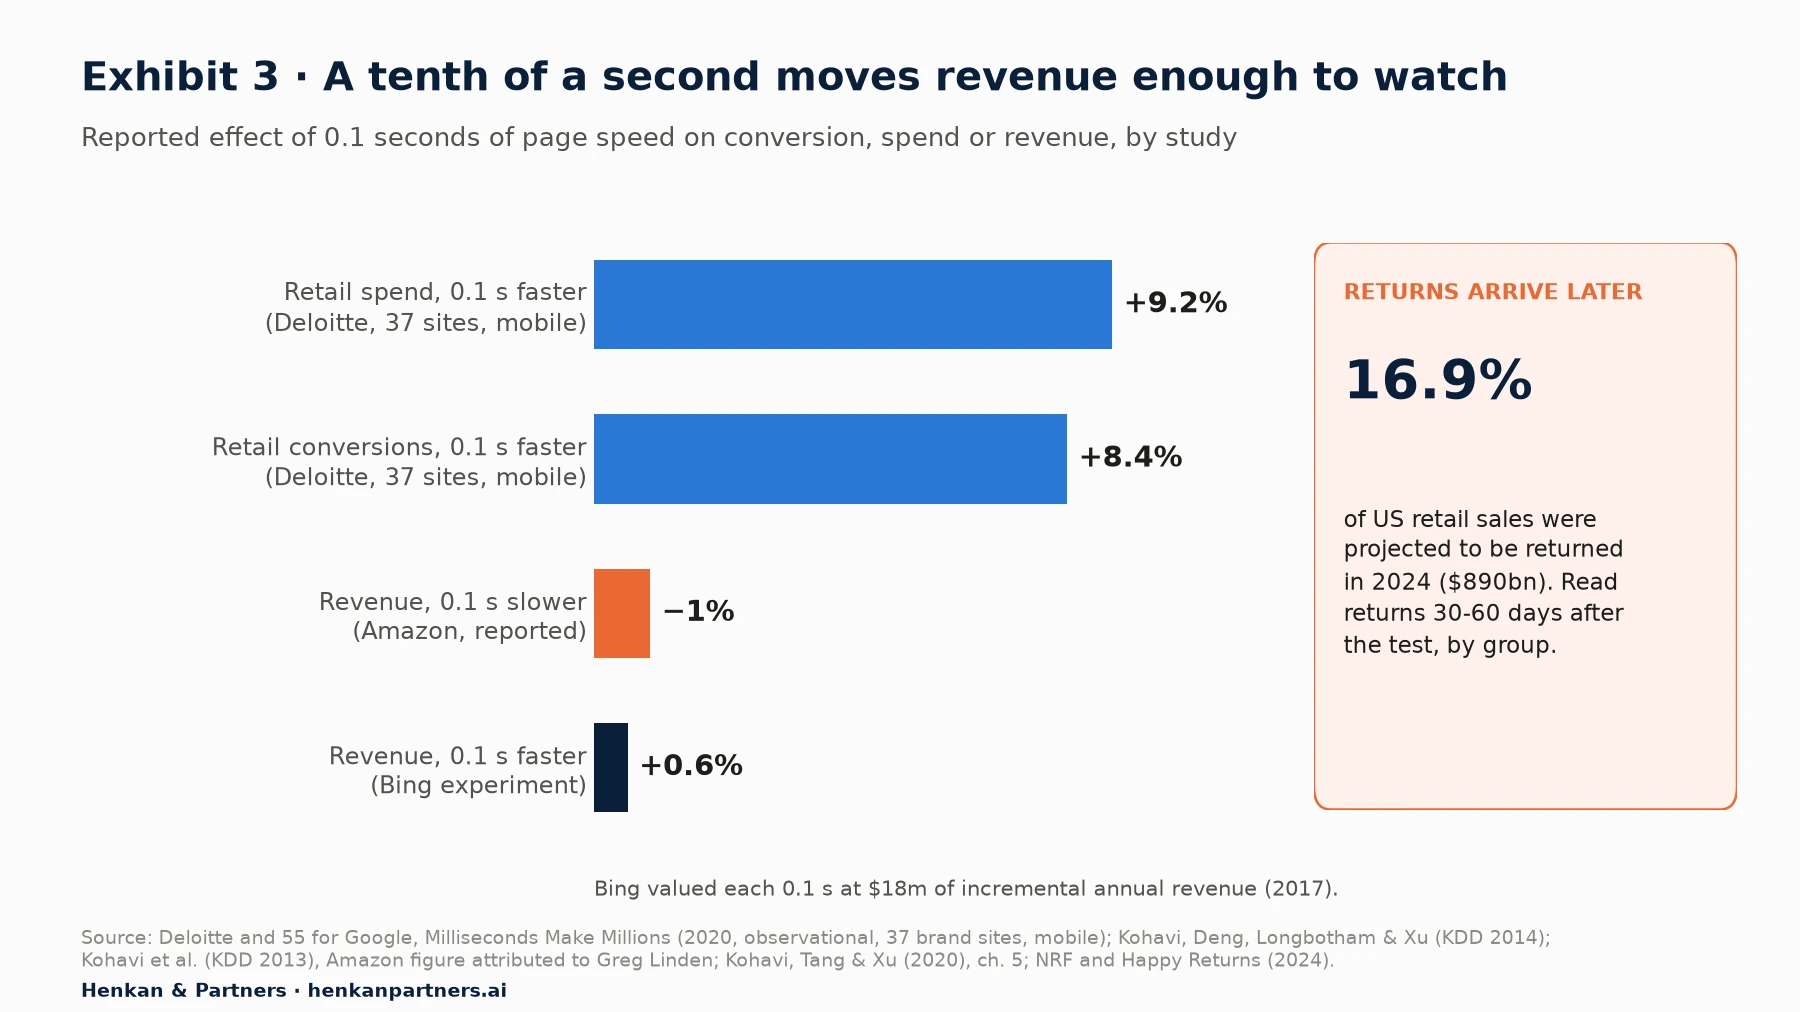
What this shows. Three sources, spanning more than a decade, find that a tenth of a second changes conversion or revenue by between 0.6% and about 9%. The Deloitte figure comes from observational data across sites rather than a controlled experiment, so treat it as an upper-range indication. The returns figure is a reminder that part of the cost of a 'winning' variation may arrive after the test has closed.
Trust guardrails protect the result itself
Trust guardrails do not measure harm to the business; they tell you whether the test can be believed. The main one is the sample ratio mismatch (SRM) check: a chi-square test that the observed split matches the configured one. Others include the share of visitors with tracking, the share of assigned visitors who were actually exposed to the variation, and differences between groups before exposure. Spotify calls these quality metrics; Microsoft calls them data quality metrics. They should run on every test, automatically. Our A/B test QA checklist explains how to set them up and what to do when one fails, so we do not repeat it here.
| Guardrail | Family | Data source | Readable after | Typical harm threshold (our starting point) |
|---|---|---|---|---|
| Revenue per visitor | Business | Testing tool or analytics, with orders | Planned test duration | No drop beyond 1–3% relative |
| Gross margin per visitor | Business | Order data joined with product costs | Planned test duration | No drop beyond 1–3% relative |
| Return and cancellation rate | Business | Order management system | 30–60 days after the test | No rise beyond agreed points |
| Customer service contacts per order | Business | Help desk or chat tool, tagged by variation | 1–2 weeks | No significant rise |
| LCP, INP, CLS (real users) | Experience | Real-user monitoring split by variation | Days | Stay within Google's 'good' thresholds |
| JavaScript errors per session | Experience | Error monitoring tagged by variation | Hours | No significant rise; any new error type investigated |
| Bounce rate on tested page | Experience | Analytics | Days | No significant rise |
| Sample ratio | Trust | Testing tool | Day 1, then weekly | p < 0.001 invalidates the test |
Section 5 · Choosing guardrails
Choose three to five guardrails by test type, not a standard list of twenty
It is tempting to add every metric in the dashboard as a guardrail. That backfires. Airbnb's team warns that protecting too many metrics produces false escalations, and the arithmetic explains why. If each guardrail is tested for harm at a one-sided 2.5% level and the metrics were independent, the chance that at least one flags harm by luck is about 7% with three guardrails, 12% with five, 22% with ten and 40% with twenty. Real metrics are correlated, which lowers these numbers somewhat, but the direction holds: long lists turn every test into a debate.
The better approach is a short always-on set plus a few test-specific guardrails chosen from what the change could plausibly break. The always-on set is the trust checks plus revenue per visitor and JavaScript errors. The test-specific set follows from a simple question asked at the planning meeting: if this change goes wrong, where would it hurt?
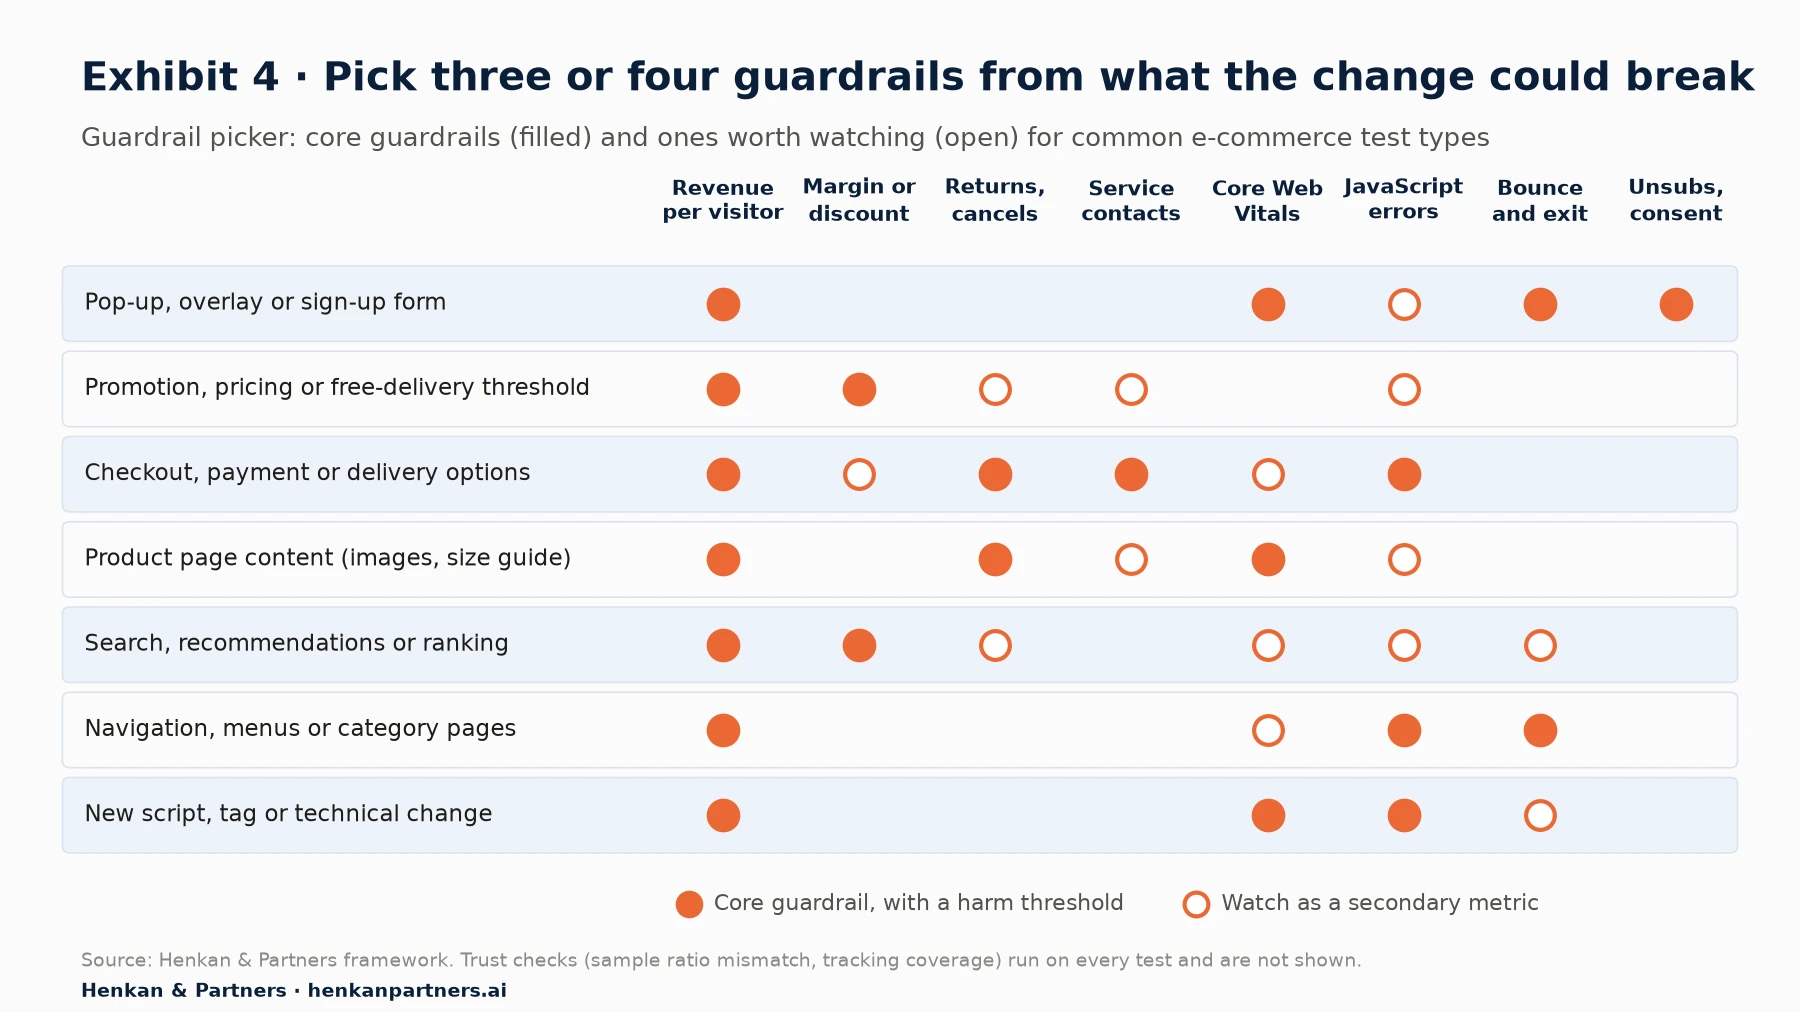
What this shows. Read across a row to build a test plan. Most test types need two to four core guardrails beyond the trust checks, which keeps the false-alarm rate manageable. Two columns are nearly always core: revenue per visitor, because almost every change can move it, and JavaScript errors, because they are cheap to measure and fast to react to. Returns and margin matter most for tests that change what or how much people buy.
Five rules for picking guardrails
- Start from the failure mode. Write one sentence for each guardrail: 'this change could hurt X because Y'. If you cannot write the sentence, it is not a guardrail for this test.
- Keep a fixed always-on set. Sample ratio, tracking coverage, revenue per visitor and errors run on every test, so no one has to remember them.
- Add two or three test-specific guardrails. Use Exhibit 4 as the starting point, then adjust for your business model.
- Prefer sensitive proxies you can read during the test. If returns take six weeks, add a faster proxy such as size-guide usage or 'wrong item' contacts, and schedule the returns read-out for later.
- Write the threshold next to each guardrail. A guardrail without a threshold is only a metric to look at, and it will be argued about after the fact.
For marketers. Guardrails are your protection when a stakeholder asks why a 'winning' test was not shipped. If revenue per visitor and its harm threshold were in the plan they signed, the answer is already agreed.
For leaders. Ask for the guardrails and thresholds at test approval, not at the readout. A programme where guardrails appear only after results come in is choosing metrics to fit the story.
Section 6 · Worked example
A newsletter pop-up shows why the primary metric alone can mislead
Newsletter sign-up overlays are one of the most common tests in e-commerce, and one of the clearest cases for guardrails. It is an example we return to often in client work, and one that came up in our Studio 4K episode with Hubert Wassner, Chief Statistician Officer at AB Tasty, on the Fail Fast Forward podcast. His advice: always pair the primary KPI with a guardrail, because a newsletter pop-up can lift sign-ups significantly while destroying revenue.
The set-up is simple. The control shows a small sign-up form in the footer. The variation shows a full-screen overlay after a few seconds, with a 10% discount for subscribing. The primary metric is the sign-up rate, because the marketing team owns e-mail growth. The figures below are illustrative, for 100,000 visitors per group, but the pattern is typical.
| Metric (per 100,000 visitors) | Control | Variation | Change |
|---|---|---|---|
| Newsletter sign-ups (primary) | 1,000 | 3,500 | +250% |
| Orders | 2,500 | 2,420 | −3.2% |
| Revenue (average order value €84) | €210,000 | €203,280 | −€6,720 |
| Revenue per visitor (guardrail) | €2.10 | €2.03 | −3.2% |
| Bounce rate on landing page (guardrail) | 40% | 43% | +3 points |
| Gross margin lost (at 40% margin) | −€2,688 |
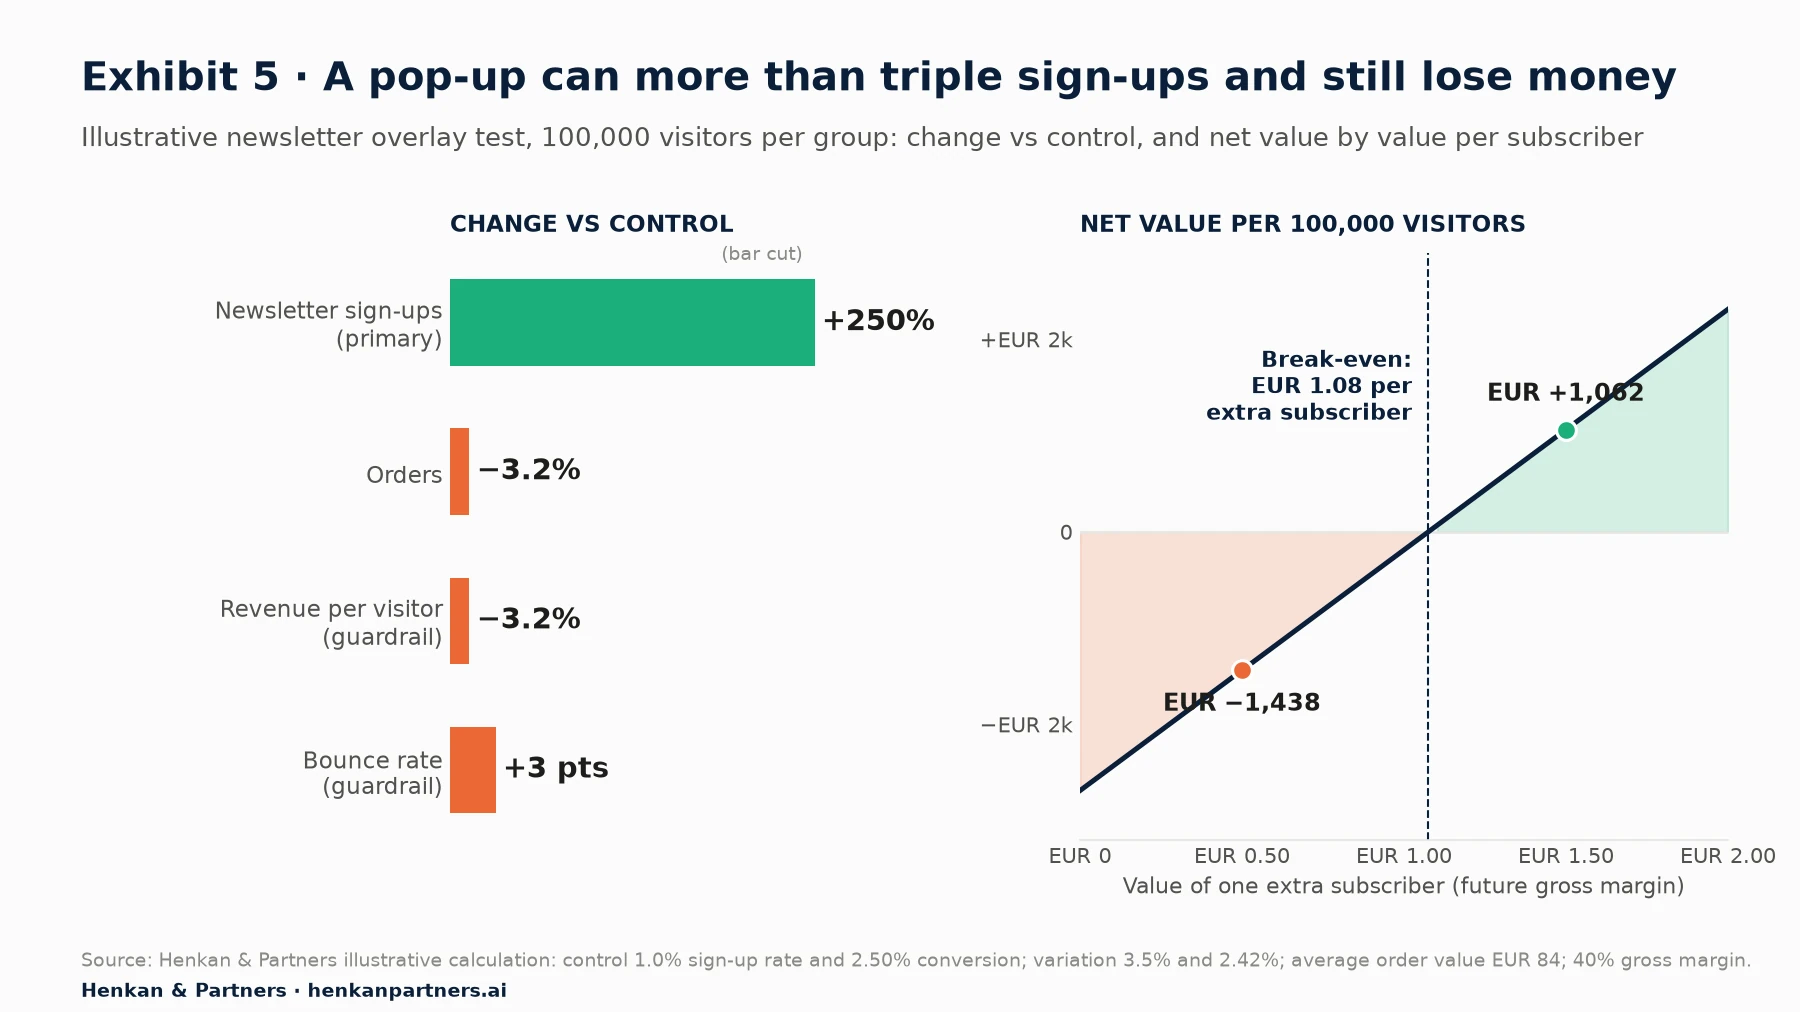
What this shows. On its primary metric, the variation is a large win. On the guardrail, it loses 3.2% of revenue per visitor, well beyond a typical 1–2% harm threshold. The composite view shows the real question: each extra subscriber must be worth at least €1.08 in future margin to pay for the lost orders. At €1.50 the pop-up pays; at €0.50 it destroys value. Without that number agreed in advance, the team will pick whichever reading suits it.
Three further points make this test a good teaching case:
- The discount changes the customer mix. New subscribers who joined for 10% off may buy mainly with the code. Track margin per order from subscribers acquired in each group, not only the count.
- Unsubscribes arrive later. A share of subscribers who joined to close the overlay will leave after the first e-mails. Read the 30-day unsubscribe rate by group before calling the result.
- Search visibility is a slow guardrail. Google advises against 'intrusive interstitials and dialogs' that obscure content and suggests small banners instead. A test cannot measure the ranking effect in two weeks, which is a reason to prefer less intrusive designs rather than a metric to add.
Our view. For overlays, we make revenue per visitor a strict guardrail with a margin of 1% to 2%, and read unsubscribes and margin per subscriber on a 30-day follow-up. In our experience, many overlay tests that 'win' on sign-ups do not survive that check in their first form; the ones that do are usually less intrusive, triggered later or on exit intent.
Section 7 · Thresholds and power
Set a harm threshold for every guardrail before launch, and power the test to check it
A guardrail needs a rule for what counts as harm. There are two ways to write that rule, and they lead to different decisions.
Two ways to test a guardrail
- Harm test (inferiority test). Ship unless there is statistical evidence that the guardrail got worse. This is simple and costs no extra traffic, which is why, at Spotify, it is common for teams to start with it. Its weakness: a small, underpowered test almost never finds evidence of harm, so 'no red flag' can simply mean 'not enough data'.
- Non-inferiority test. Ship only if there is evidence that any harm is smaller than an agreed non-inferiority margin (NIM). Spotify's example: with a 1% margin on a sales guardrail, you ship only if there is evidence that total sales will not drop by more than 1%. This is the stronger standard, and it forces the business to say how much harm it will accept.
Spotify's decision rule, published in 2024, combines both: ship when the treatment is significantly better on at least one success metric, significantly non-inferior on all guardrail metrics, shows no significant deterioration on any metric, and passes the quality checks. Airbnb takes a pragmatic middle path with three guardrails of its own: an impact guardrail that escalates when the estimated effect is worse than a threshold (for example −0.5%), whatever its significance; a power guardrail that requires the standard error to be small enough relative to that threshold; and a statistically significant negative guardrail reserved for top-priority metrics such as revenue.
Three statistical choices that matter
- Test guardrails one-sided. You only care whether the variation made the guardrail worse. A one-sided test at the same level is more powerful for that question than a two-sided one.
- Do not correct the significance level for the number of guardrails. Schultzberg, Ankargren and Frånberg show that for non-inferiority guardrails, the false-positive rate of the ship decision does not grow with the number of guardrails, because every guardrail must pass. Correct the significance level only across success metrics.
- Do correct power for the number of guardrails. The same paper shows that the risk of wrongly blocking a good change grows with each guardrail. Their correction divides the allowed false-negative rate by the number of guardrails plus one, so each guardrail needs more power, and more traffic, as the list grows.
Visitors per group for a non-inferiority guardrail (one-sided, true effect zero):
n = (z(1−α) + z(1−β))² × σ² × 2 ÷ Δ²

where σ is the metric's standard deviation per visitor and Δ is the absolute margin.
For a conversion rate p with a relative margin m: σ² = p(1−p) and Δ = m × p.

Spotify's power correction with G guardrails: β* = β ÷ (G + 1)
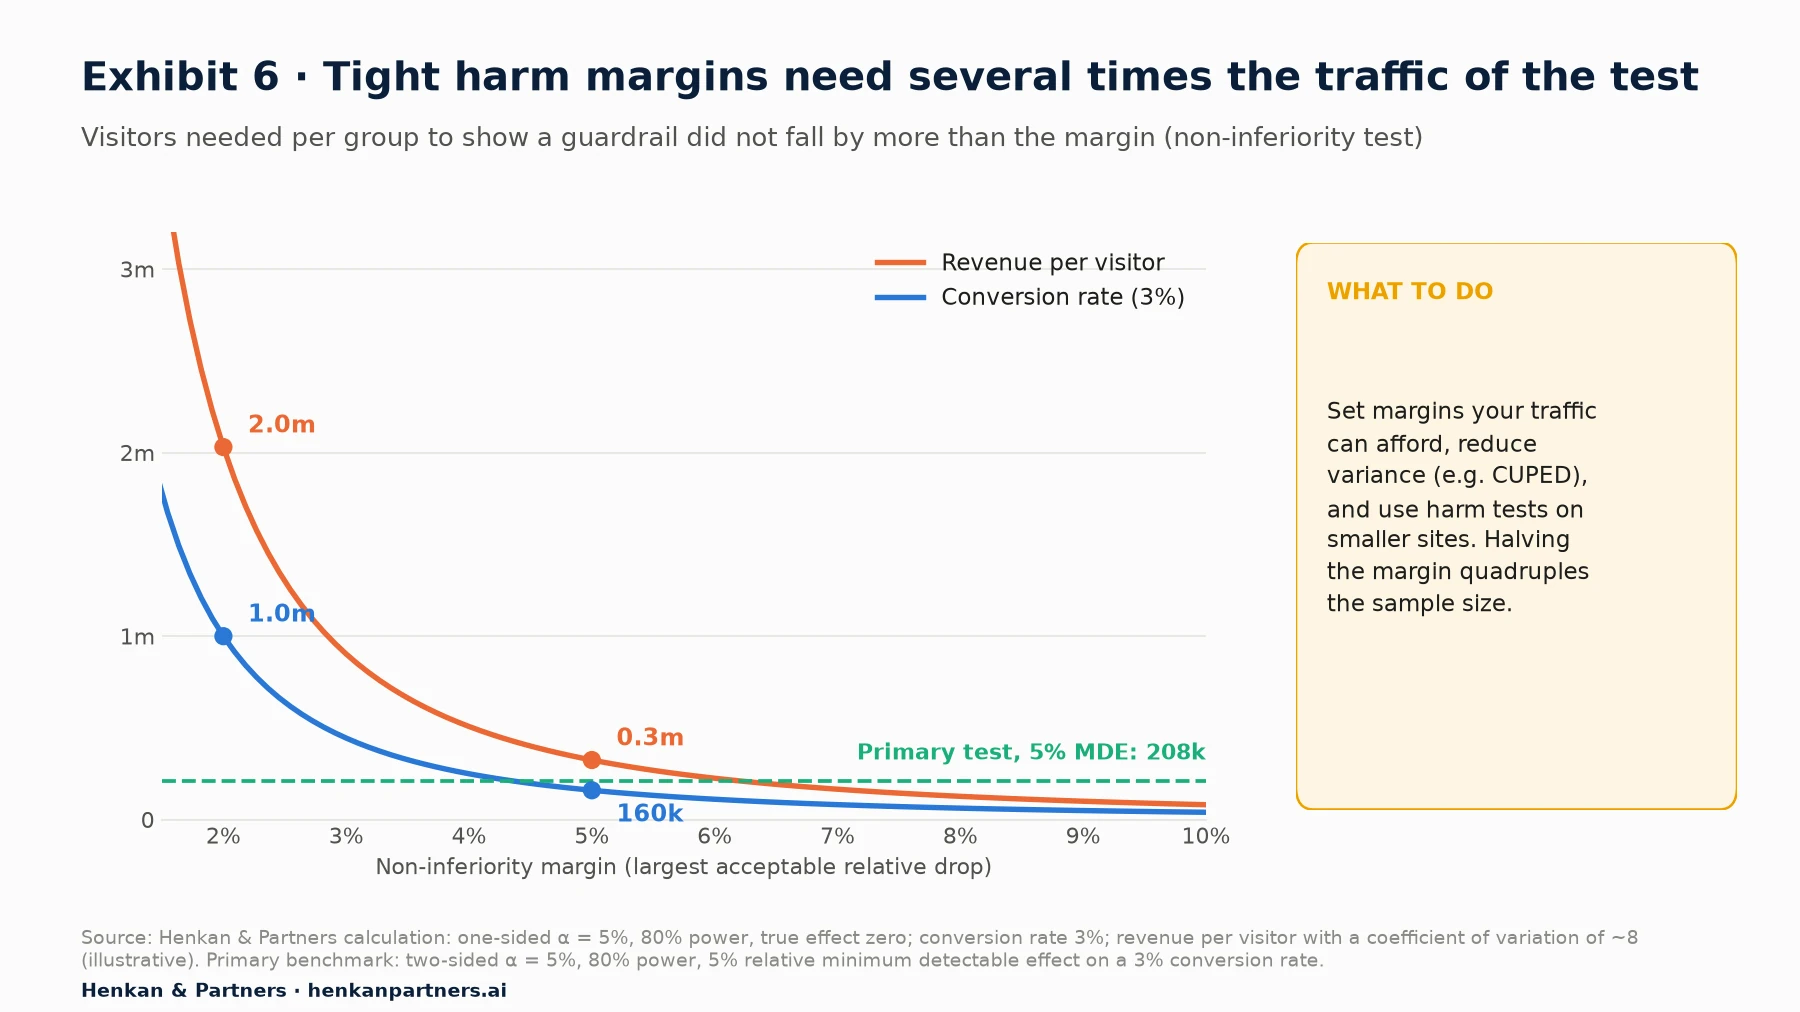
What this shows. A primary test designed to detect a 5% relative lift in a 3% conversion rate needs about 208,000 visitors per group. Proving that the same conversion rate did not fall by more than 2% needs about one million, and for revenue per visitor about two million, because revenue is much noisier. Most e-commerce sites cannot afford that. The practical answer is not to drop the guardrail but to set margins you can afford, use variance reduction such as CUPED, and fall back on harm tests for smaller sites.
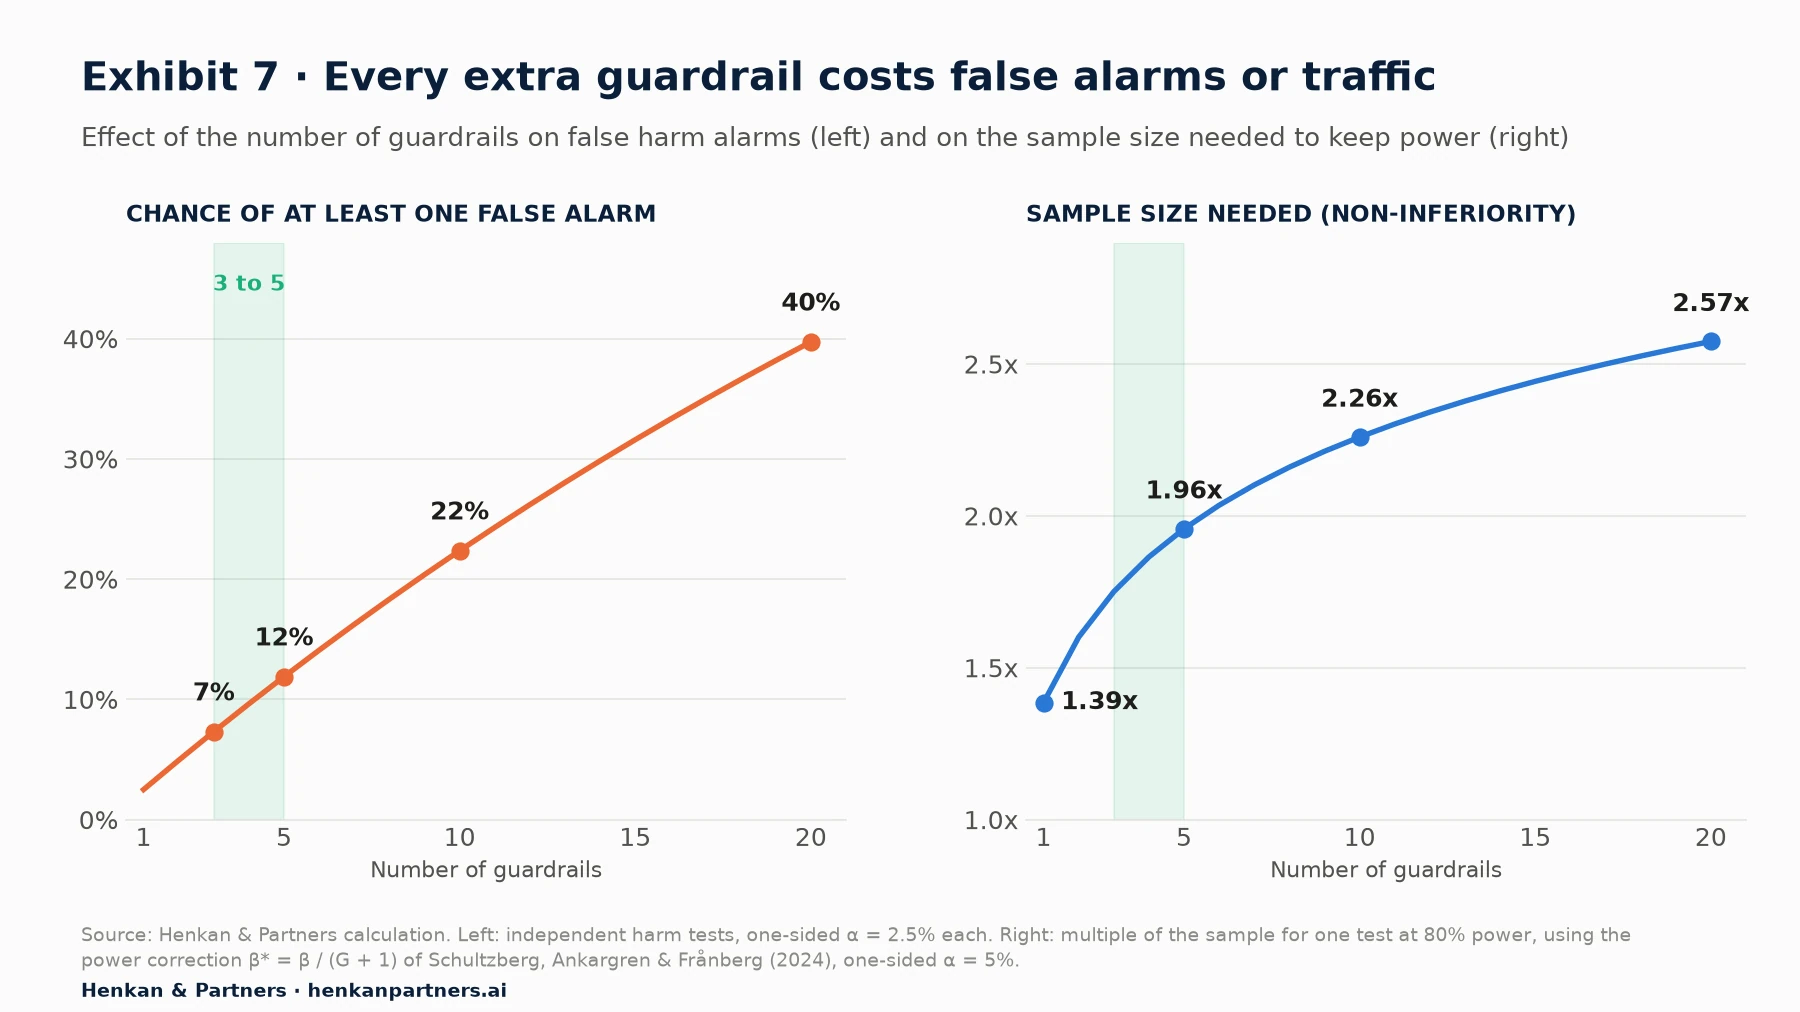
What this shows. The two panels are the two ways the cost of a long guardrail list shows up. If guardrails are harm tests, each one adds a chance of a false alarm that blocks a good change. If they are non-inferiority tests with the power correction, each one adds traffic: five guardrails need about twice the sample of one test at 80% power. Either way, the fifteenth guardrail is rarely worth what it costs.
For marketers. If your traffic cannot support a formal margin, say so in the test plan and use harm tests on the guardrails, plus a direction check: any guardrail whose estimate is worse than the agreed threshold gets discussed before shipping, significant or not. That is Airbnb's impact guardrail, and it is honest about what the data can show.
For leaders. The margins are business decisions, not statistical ones. How much revenue per visitor would you trade for a 10% rise in sign-ups? Someone senior has to answer, once, and the answer becomes a standard.
Section 8 · Stopping rules
Stop a test early for harm, never for a win
The decision to stop a test is asymmetric. Stopping a harmful variation early costs little: you lose a few days of learning and save revenue and customers. Stopping a promising variation early costs a lot: early swings are mostly noise, and a win declared on day four often disappears. The metric system turns that asymmetry into rules: guardrails and trust checks can stop a test at any time; the primary metric can only end a test at its planned end, unless the test uses a method built for early stopping.
Our A/B test QA checklist gives the order of questions to ask at each scheduled review. Here we look at the statistical design behind the harm checks, because 'look at the guardrails every day' is only safe if the method allows it.
Repeated looks need methods built for them
A fixed-horizon test assumes one look at the end. Looking every day with the same threshold inflates false alarms: in Netflix's simulations, repeatedly applying a standard test to data with no real difference produced a significant result at some point in 66 of 100 runs. For guardrails, a false alarm means stopping a good variation. Two families of methods fix this:
- Group sequential tests with alpha spending. You plan a number of interim looks and spend the error rate across them. The O'Brien–Fleming design sets very strict thresholds early and relaxes them later; Lan and DeMets (1983) generalised the idea to any timing of looks. With five equally spaced looks and an overall two-sided 5% error rate, the O'Brien–Fleming thresholds are z = 4.56, 3.23, 2.63, 2.28 and 2.04. Early stops happen only for large, clear harm.
- Always-valid sequential tests. Confidence sequences and mixture sequential tests let you look after every visitor. Netflix uses them for software rollouts; GrowthBook uses frequentist sequential testing for its Safe Rollouts; Optimizely's Stats Engine is built on the same family of methods (Johari et al., 2017).
| Metric type | Can it stop the test early? | Method | Action |
|---|---|---|---|
| Trust guardrails (SRM, tracking) | Yes, from day one | Chi-square at p < 0.001, checked daily or automatically | Pause, find the cause, restart with fresh counts |
| Severe harm (errors, broken journeys, large revenue drop) | Yes, immediately | Alert thresholds; auto-shutdown where the tool supports it | Stop the variation and roll back |
| Business and experience guardrails | Yes, at planned looks | One-sided sequential test or alpha spending on harm | Stop if the harm boundary is crossed; record as a result |
| Primary metric, fixed-horizon test | No | Single analysis at planned sample size | Wait for the planned end |
| Primary metric, sequential test | Yes, if planned | Sequential boundaries set before launch | Stop at a boundary; report the adjusted interval |
| Secondary metrics | No | Descriptive only | Use to explain, never to stop |
Automate harm detection, but keep a person in the loop
Mature platforms automate the harm side. Microsoft's ExP classifies alerts by severity (P0 catastrophic, P1 serious, P2 potential issue), controls the false discovery rate across the many metrics it watches with the Benjamini–Hochberg method, and can shut experiments down automatically. Optimizely's guardrail alerts check on a schedule that starts every 6 hours in the first 14 days and slows to every 96 hours later in a long test. Both examples show the same design choice: frequent automatic checks for harm, with thresholds and methods chosen so that a false alarm is rare.
Automation is for the clear cases. For the grey zone (a guardrail slightly past its threshold, not significant) Airbnb's escalation process is the model: stakeholders discuss the result openly, and 80% of flagged tests still launch. The point of a guardrail is to force a decision to be made on purpose, not to replace judgement. For more on the reading mistakes that turn good tests into bad decisions, see our companion piece on common A/B testing mistakes.
Section 9 · Tools
Most testing tools now support guardrails, but they implement them differently
Before you design a metric system, check what your tool does with each role. The differences matter: some tools correct secondary metrics for multiple comparisons and slow them down, some colour guardrails red on any significant drop, some can roll a variation back automatically. The table summarises each vendor's own documentation.
| Tool | Metric roles | Guardrail behaviour | Automatic action |
|---|---|---|---|
| Optimizely | Primary metric; secondary metrics (ranked 2–5); monitoring metrics | Secondary thresholds adjusted for false discovery rate; monitoring metrics weighted 1/n; guardrail alerts on a % threshold, minimum visitors and optional significance (Web Experimentation) | Email or Slack alert; optional automatic pause when a guardrail is breached |
| Statsig | Primary, secondary and guardrail metrics | Decision framework recommends 'Roll out winning group', 'Discuss' or 'Do not roll out' from one primary metric and guardrails; rollout alerts on a % threshold, using sequential testing and CUPED if enabled | Notifications; the framework recommends but does not enforce, and reviewers can be required |
| Eppo (now Datadog Experiments) | Metrics with optional guardrail cutoffs | Guardrail cutoffs: yellow when the confidence interval's lower bound crosses the cutoff, red when also significantly negative | Flags in results |
| GrowthBook | Goal, secondary and guardrail metrics | Frequentist view: yellow for any move in the wrong direction, red when p < 0.05 two-sided | Safe Rollouts use sequential tests on guardrails and roll back automatically; SRM and multiple-exposure checks |
| Kameleoon | Goals; guardrails for AI experiments (latency, cost, errors, safety) | Rollback conditions on a goal: uplift, downlift or conversion-rate threshold after a minimum number of visitors (Feature Experimentation) | Turns off the rule or the whole environment; email alerts |
| AB Tasty | Primary KPI; secondary KPIs as guardrails (errors, performance, bounce, complaints, margin) | Health checks including SRM before deciding; ship, hold, iterate or roll back framework | Decision guidance |
| Spotify Confidence | Success, guardrail, deterioration and quality metrics | Non-inferiority tests on guardrails, no alpha correction for guardrails, power corrected for their number | Decision rule recommends ship or not |
Disclosure: Henkan & Partners is a Kameleoon Platinum partner and works with several of the other tools listed. The comparison is based only on each vendor's public documentation.
Two practical consequences follow. First, check whether your tool treats secondary metrics differently from guardrails: in Optimizely, for example, every metric beyond the fifth becomes a monitoring metric with a small weight, and more secondary metrics make each one slower to reach significance. Second, check whether automatic actions are available in your product: in several tools, automatic rollback belongs to feature-flag or server-side products, not to the client-side web editor that most e-commerce teams use.
Section 10 · AI
AI can propose and watch guardrails, but people must own the thresholds
AI tools are useful at three points in the guardrail workflow, and risky at a fourth.
- Proposing guardrails. Given the hypothesis and a description of the change, a language model is good at listing plausible failure modes, which is the first rule of picking guardrails. Treat the list as a prompt for discussion; it does not know your margins or your customers.
- Watching them. Agents connected to testing tools through APIs or MCP servers (GrowthBook, for example, publishes one) can pull guardrail results on schedule, summarise them and flag breaches. This is monitoring, and it is a good use of automation.
- Testing AI features themselves. When the variation is an AI feature (a chatbot, generated product descriptions, an AI search), the guardrails change. Kameleoon's documentation for testing LLM prompts recommends monitoring 'latency, cost, errors, and safety as operational guardrails', and rolling back automatically when, for example, a groundedness score breaches a threshold.
- The risk: letting AI set thresholds or read results after the fact. An assistant asked 'did this test win?' after the data is in will happily find the metric that says yes. Keep thresholds in the test plan, written before launch, and keep the calculation in the tool or in code.
Our guide to A/B testing statistics covers in more detail where AI helps and where it goes wrong with test analysis.
Section 11 · What to do next
What to do next
1. Add a metric system section to your test plan template
Replace the single 'KPI' field with four: primary metric, secondary metrics, guardrails with thresholds, and trust checks. Make the guardrail field mandatory, with a one-line failure mode for each.
2. Set up the always-on guardrails once
Build sample ratio, tracking coverage, revenue per visitor and JavaScript errors into every test by default, in your testing tool or your analysis template. Turn on your tool's alerts for them.
3. Agree harm thresholds with the business
Hold one meeting with finance, marketing and product to agree standard margins for revenue per visitor, margin and conversion, and a value per subscriber or lead. Then check with a sample-size calculator which margins your traffic can support.
4. Add a follow-up read for slow guardrails
For tests that could affect returns, cancellations or unsubscribes, schedule a 30- to 60-day read-out by group after the test ends, and record it in the same test record.
5. Get a second opinion on your metric system
Henkan & Partners designs metric systems, guardrails and stopping rules for e-commerce experimentation programmes, and sets them up in the tools you already use. Talk to us.
FAQ
Frequently asked questions about guardrail metrics
Frequently asked questions
What are guardrail metrics?
Guardrail metrics are metrics an A/B test is not trying to improve but must not harm, such as revenue per visitor, page speed, error rates or the traffic split. Each has a harm threshold agreed before launch, and a variation that breaches it is not shipped, even if it wins on the primary metric.
What is the difference between primary, secondary and guardrail metrics?
The primary metric decides whether the variation is better. Secondary metrics explain why and where the result happened, but decide nothing on their own. Guardrail metrics protect the business, the customer and the data: they can stop a variation from shipping but can never make it a winner.
How many guardrail metrics should an A/B test have?
Three to five, plus automatic trust checks such as sample ratio mismatch. Each extra guardrail adds false alarms or traffic: with ten independent harm tests at a one-sided 2.5% level, the chance of at least one false alarm is about 22%.
What are examples of guardrail metrics in e-commerce?
Business guardrails such as revenue per visitor, gross margin, returns, cancellations and customer service contacts; experience guardrails such as Core Web Vitals, JavaScript errors and bounce rate; and trust guardrails such as sample ratio and tracking coverage.
What is an overall evaluation criterion (OEC)?
An OEC is the quantitative measure of an experiment's objective. It must be measurable within the test yet believed to drive long-term value. It can be a single metric such as revenue per visitor, or a composite that prices a trade-off, such as revenue minus the lifetime value lost through unsubscribes.
What is a non-inferiority margin in A/B testing?
It is the largest drop in a guardrail metric that you are willing to accept. A non-inferiority test ships the variation only if the data shows the drop is smaller than that margin. Tight margins need a lot of traffic, so choose margins your site can support.
Should guardrail metrics be corrected for multiple testing?
Not at the significance level, if every guardrail must pass for the variation to ship. Spotify's research shows the false-positive risk of the decision does not grow with more guardrails. The power does need correcting, because each guardrail adds a chance of wrongly blocking a good change.
When should you stop an A/B test early?
Stop early for a sample ratio mismatch, for broken experiences, or when a guardrail crosses a harm boundary set before launch, using a method built for repeated looks. Do not stop a fixed-horizon test early because the primary metric looks like a win.
Do A/B testing tools support guardrail metrics?
Yes. Optimizely, Statsig, Eppo, GrowthBook, Kameleoon and AB Tasty all support guardrails or equivalent secondary metrics, with differences in how they are tested and whether the tool can pause or roll back a variation automatically. Check your tool's documentation before designing the metric system.
Key terms
- Guardrail metric
- A metric a test is not trying to improve but must not harm. It matters because variations can win on the primary metric while damaging revenue, the customer experience or the data.
- Primary metric
- The single metric, fixed before launch, that decides the test. It matters because choosing the deciding metric after seeing results inflates false wins.
- Secondary metric
- A metric reported to explain the result, such as clicks on the changed element or conversion by device. It matters because it guides the next hypothesis without being used to declare a winner.
- Overall evaluation criterion (OEC)
- The quantitative measure of an experiment's objective, measurable in the short term but believed to drive long-term value. It matters because a poorly chosen OEC optimises the wrong thing very efficiently.
- Business guardrail
- A guardrail that protects revenue, margin or operations, such as revenue per visitor or returns. It matters because many 'wins' shift value rather than create it.
- Trust guardrail
- A check that the test ran correctly, such as the sample ratio or tracking coverage. It matters because if it fails, no other result can be believed.
- Sample ratio mismatch (SRM)
- A difference between the observed and configured traffic split larger than chance allows. It matters because it is the most common sign of a broken test.
- Non-inferiority margin
- The largest harm to a guardrail the business agrees to accept. It matters because it turns 'must not get worse' into a testable rule.
- Non-inferiority test
- A test that ships a variation only if the data shows harm is smaller than the margin. It matters because it guards against underpowered tests that miss real harm.
- One-sided test
- A test that looks for an effect in one direction only, such as harm to a guardrail. It matters because it is more powerful for that question than a two-sided test.
- Statistical power
- The probability that a test detects an effect of a given size when it exists. It matters for guardrails because an underpowered test reports 'no harm' simply for lack of data.
- Sequential test
- A test designed to be analysed repeatedly while data arrives, without inflating false positives. It matters because it makes early stopping for harm statistically safe.
- Alpha spending
- A way to split the allowed false-positive rate across planned interim looks, as in O'Brien–Fleming or Lan–DeMets designs. It matters because it lets you check for harm during a test with strict early thresholds.
- Core Web Vitals
- Google's user-experience metrics for loading (LCP), responsiveness (INP) and visual stability (CLS). They matter because testing scripts and new components can degrade them.
- Auto-shutdown
- An automatic pause or rollback of a variation when a guardrail breaches its threshold. It matters because it limits harm without waiting for a person to notice.
Sources
All sources were checked in September 2026. Optimizely, Statsig, Eppo, GrowthBook, Kameleoon and AB Tasty features come from their own documentation and are vendor data; Spotify Confidence figures are published by Spotify's commercial experimentation product and are also vendor data. The Deloitte study is observational and was commissioned by Google. Exhibits 1 and 4 and Tables 1, 2, 3 and 5 are Henkan & Partners frameworks; Exhibits 6 and 7 are our own calculations from standard formulas; Exhibit 5 and Table 4 are illustrative.
- Kohavi, R., Tang, D. & Xu, Y. (2020). Trustworthy Online Controlled Experiments: A Practical Guide to A/B Testing. Cambridge University Press (ch. 1, ch. 7, ch. 5 and ch. 21); excerpt.
- Dmitriev, P., Gupta, S., Kim, D. W. & Vaz, G. (2017). A Dirty Dozen: Twelve Common Metric Interpretation Pitfalls in Online Controlled Experiments. KDD 2017.
- Deng, A. & Shi, X. (2016). Data-Driven Metric Development for Online Controlled Experiments: Seven Lessons Learned. KDD 2016.
- Kohavi, R., Deng, A., Frasca, B., Walker, T., Xu, Y. & Pohlmann, N. (2013). Online Controlled Experiments at Large Scale. KDD 2013.
- Kohavi, R., Deng, A., Longbotham, R. & Xu, Y. (2014). Seven Rules of Thumb for Web Site Experimenters. KDD 2014.
- Schultzberg, M., Ankargren, S. & Frånberg, M. (2024). Risk-aware product decisions in A/B tests with multiple metrics. arXiv; summarised on Spotify Engineering.
- Schultzberg, M. (2024). Better Product Decisions with Guardrail Metrics. Confidence by Spotify (vendor content).
- Rydberg, J. (2026). The Real ROI of Experimentation. Confidence by Spotify (vendor data).
- Bellato, M., Schultzberg, M. & Ankargren, S. (2025). Beyond Winning: Spotify's Experiments with Learning Framework. Spotify Engineering.
- Xifara, T. et al. (2021). Designing Experimentation Guardrails. The Airbnb Tech Blog.
- Lindon, M., Sanden, C., Shirikian, V., Liu, Y., Mishra, M. & Tingley, M. (2024). Sequential A/B Testing Keeps the World Streaming Netflix, Part 1: Continuous Data. Netflix Technology Blog.
- Machmouchi, W., Gupta, S., Zhang, R. & Fabijan, A. (2020). Patterns of Trustworthy Experimentation: Pre-Experiment Stage. Microsoft Research.
- Machmouchi, W., Gupta, S. & Zhang, R. (2021). Patterns of Trustworthy Experimentation: During-Experiment Stage. Microsoft Research.
- Agrawal, A., Bajpai, V. K. & Lu, J. (2021). Alerting in Microsoft's Experimentation Platform (ExP). Microsoft Research.
- Gupta, S. & Machmouchi, W. (2022). STEDII Properties of a Good Metric. Microsoft Research.
- Lan, K. K. G. & DeMets, D. L. (1983). Discrete sequential boundaries for clinical trials. Biometrika, 70(3), 659–663.
- Johari, R., Pekelis, L. & Walsh, D. (2017). Peeking at A/B Tests: Why it matters, and what to do about it. KDD 2017.
- Deloitte and 55 for Google (2020). Milliseconds Make Millions. Summarised on web.dev.
- NRF and Happy Returns (2024). 2024 Retail Returns to Total $890 Billion. National Retail Federation.
- Google Search Central (n.d.). Interstitials and dialogs.
- Optimizely (n.d.). Primary metrics, secondary metrics, and monitoring goals and Guardrail alerts (vendor documentation).
- Statsig (n.d.). Decision Framework and Rollout Alerts (vendor documentation).
- Eppo (n.d.). Guardrail cutoffs (vendor documentation).
- GrowthBook (n.d.). Experimenting in GrowthBook, Safe Rollouts and How to automate experiments with GrowthBook MCP (vendor documentation).
- Kameleoon (n.d.). Automatically rollback a feature and Experiment on LLM prompts and AI-agent configurations (vendor documentation).
- AB Tasty (n.d.). Measure and learn (vendor documentation).
- Henkan & Partners. Illustrative newsletter overlay example; sample-size, false-alarm and power calculations (normal approximation, formulas as stated in the article).