Focus
Your First 90 Days in a New CRO Role: What to Audit, Who to Win Over and Which Tests to Run First
Alexandre Suon · 2026-09-29
You have just started a new CRO or experimentation role. Congratulations. This deep dive is a practical CRO 90-day plan: what to audit before you run a single test, which stakeholders to win over and what to ask them, which first tests to choose, how much testing your traffic can really support, and what to report at day 90. Use it as a working checklist, not a reading assignment.
Executive summary
- The first 90 days set the expectations you will be judged against for years. McKinsey reports that 92% of external hires take far more than 90 days to reach full productivity, and that 68% of leadership transitions founder on issues of politics, culture and people. In CRO, you also inherit tools, tracking and a backlog you did not choose.
- Audit before you test. Check that analytics orders reconcile with back-end orders, that the testing tool is installed and QA'd properly, and that past results can be trusted. Speero's 2025 maturity benchmark (154 programmes assessed in 2024) found 52% do not QA tests before launch, and even Microsoft saw a sample ratio mismatch in about 6% of experiments.
- Win the people who can block you before you need them. Tech, brand, legal and finance rarely oppose experimentation in principle; they oppose surprises. Map every stakeholder by influence and support, hold 15 to 20 structured 1:1s, and play back what you heard within 30 days.
- Choose first tests for learning and visibility, not for maximum uplift. Published win rates range from 8% (Airbnb Search) to 33% (Microsoft), and Optimizely reports 12% across 127,000 experiments (vendor data). Never promise an uplift number in your first month; promise a trustworthy process and decisions.
- Size the programme with arithmetic, not ambition. In our illustrative example, a page area with 100,000 weekly users and a 2.5% conversion rate needs about 31 weeks to detect a 2% relative lift, but under two weeks to detect 10%. That single table sets realistic expectations for how many tests a year the site can run.
- At day 90, report trust, rhythm, decisions and learnings, not test counts. A one-page scorecard covering data trust, test quality, operating rhythm, decisions, learnings, capacity and next-quarter asks shows leadership that the programme is an investment in better decisions.
Section 1 · Why it matters
The first 90 days decide the programme, because expectations are set before results exist
A CRO 90-day plan is a structured plan for a new conversion rate optimisation or experimentation lead's first three months. It sequences an audit of data, tools and past tests (days 1–30), fixes and first tests (days 31–60), and an operating model with a first scorecard (days 61–90), so that the programme earns trust before it is judged on uplift.
A new CRO role rarely starts from a blank page. You inherit a testing tool someone else chose, a tracking set-up someone else built, a backlog of ideas that may be years old, and a set of expectations that were probably formed during your recruitment. Sometimes the expectation is explicit ("we want +10% conversion this year"). More often it is vague and dangerous ("we need to test more").
Whatever you inherit, the first weeks are when people decide what kind of leader you are and what experimentation is for. If the first thing they see is a rushed test that breaks the checkout on Safari, or a "winning" result finance cannot find in the revenue numbers, it takes a long time to recover. If the first thing they see is a clear diagnosis, a sensible plan and a well-run first test, you have bought yourself the time a real programme needs.
Michael Watkins's The First 90 Days, the standard book on leadership transitions, frames the goal as reaching the "break-even point" sooner: the moment when you have contributed as much value to the organisation as you have consumed from it. The same logic applies to a CRO lead. Your first job is not to produce an uplift. It is to shorten the time until the organisation trusts your data, your process and your judgement.
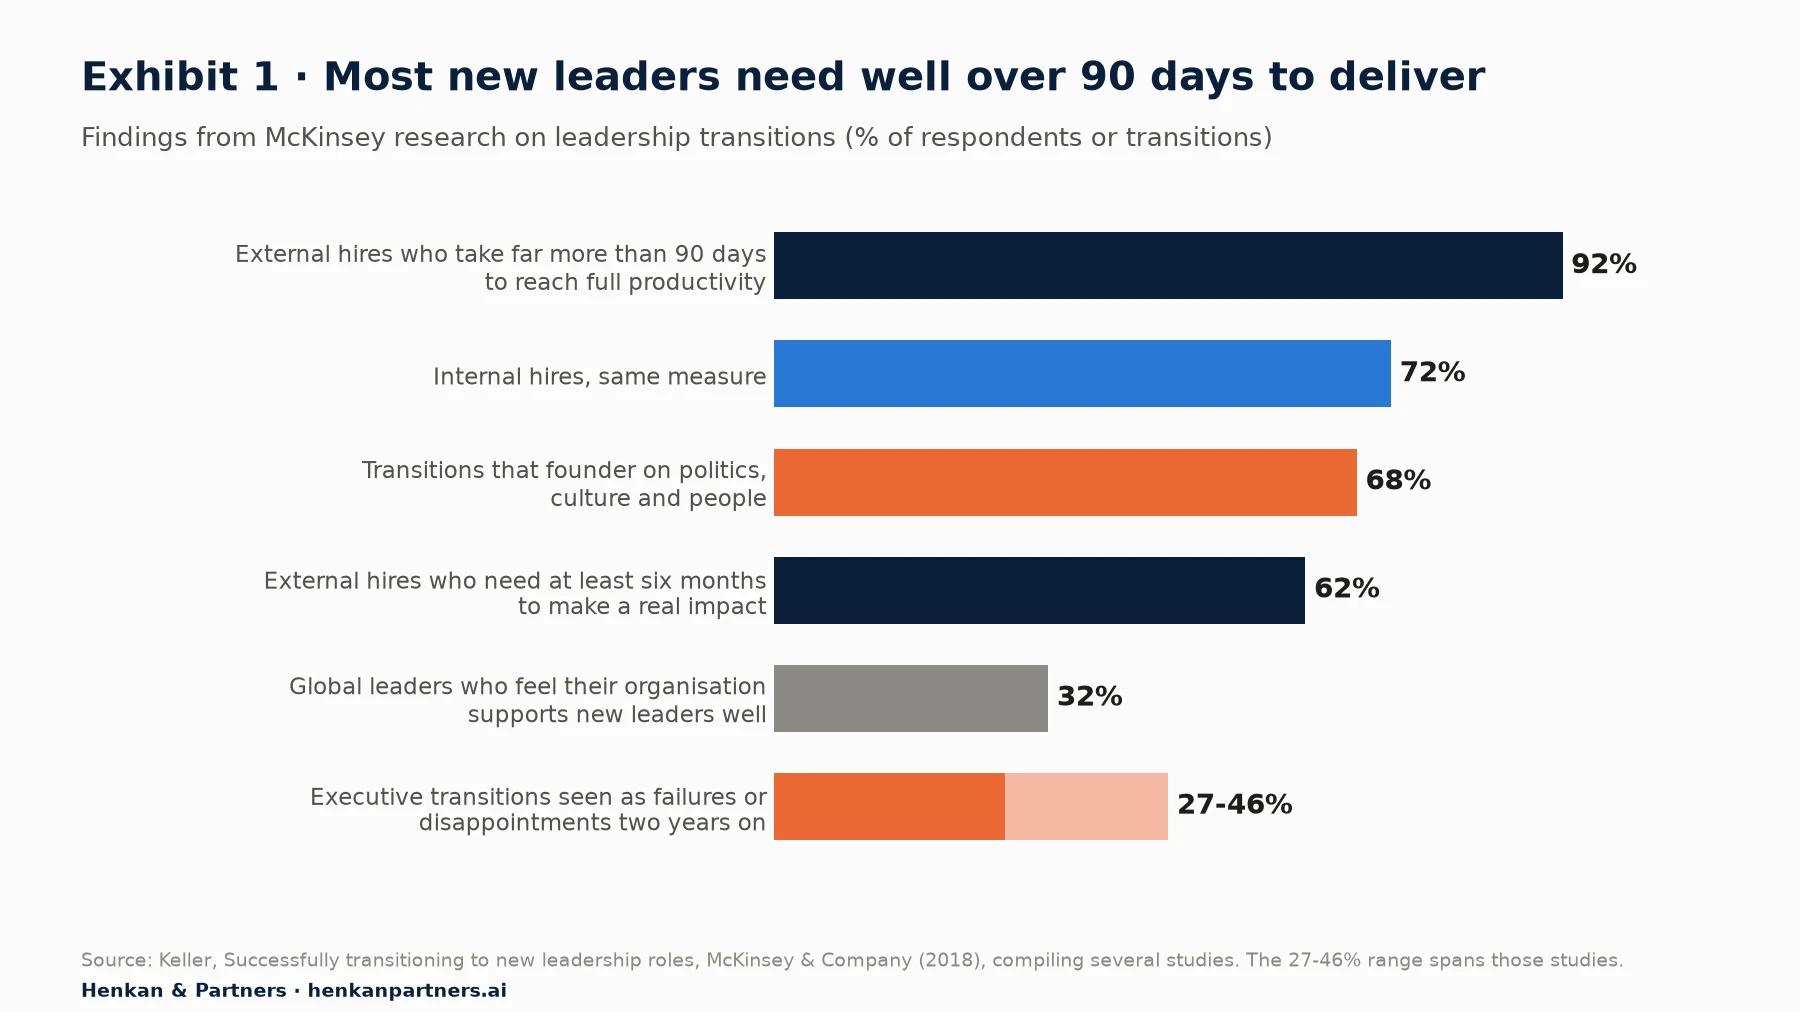
What this shows. Ninety days is not enough to deliver the full value of a new role, and McKinsey's research says so plainly. It is enough to set direction, build relationships and prove that your way of working is reliable. The biggest risk is not technical: 68% of transitions founder on issues of politics, culture and people, which is why Section 3 of this plan is about stakeholders, not statistics.
Recognise which situation you have walked into
Watkins's STARS model describes five business situations a new leader can inherit: start-up, turnaround, accelerated growth, realignment and sustaining success. Translated to experimentation, most new CRO leads recognise one of four:
- Start-up: the first CRO hire. No programme, perhaps a tool licence nobody uses. Your job is to build foundations and prove value with a handful of well-chosen tests.
- Turnaround: a programme that lost trust. Tests ran, but results were disputed, or "wins" never showed up in revenue. Your job is to fix trust before you increase volume.
- Realignment: a busy programme with the wrong goals. Plenty of tests, measured by count, mostly cosmetic. Your job is to redirect effort to research-led tests and decisions.
- Sustaining success: a mature team you now lead. The process works. Your job is to learn the system before you change it, and to scale what already works.
The situation changes the weighting of everything that follows. A turnaround spends more of days 1–30 on data trust; a start-up spends more on stakeholders and tool set-up; a sustaining-success lead spends more time listening to their own team. Decide which one you are in by the end of week two, and say it out loud to your sponsor. Getting the diagnosis agreed is itself an early win.
Our view. Alexandre Suon, who wrote this plan, built a CRO practice from scratch at a global hotel group and has held every role in an experimentation programme, from analyst and test developer to CRO manager and programme lead. The pattern we see most often is not a lack of ideas or tools. It is a new lead who starts testing in week two to show momentum, before anyone has checked whether the numbers can be trusted.
Section 2 · Days 1–30: audit
Days 1–30: audit before you test, because every future result depends on the data you inherit
The temptation in month one is to launch something. Resist it for a few weeks. Every result you produce will be read against numbers you have not yet checked, from a tool you have not yet inspected. The audit below usually takes two to four weeks alongside stakeholder meetings. It does not need to be exhaustive; it needs to find the problems that would make a test result wrong.
1. Data and tracking trust
Start with one question: do the orders in your analytics tool match the orders in the back end? Pull daily transactions and revenue from GA4 (or Adobe, Piano, Amplitude, whatever you have) and from the order management system for the last 8 to 12 weeks, and compare them. They will never match exactly, because of consent, ad blockers, cancellations, tax and currency handling, but the gap should be stable and explainable. A gap that jumps around is a tracking problem, and a tracking problem is a testing problem.
Then look at consent. When users decline analytics cookies, their behaviour is not observed directly. Google's GA4 documentation says behavioural modelling can estimate that behaviour, but only once a property collects at least 1,000 events per day with analytics storage denied for at least seven days, and has at least 1,000 daily users with analytics storage granted for at least 7 of the previous 28 days. Find out whether your property is modelled, what the consent rate is by country and device, and whether your testing tool counts visitors before or after consent. Our guide to user consent in e-commerce and how GA4 works go deeper.
2. Testing tool set-up
Open the site with the developer tools on and look at how the testing tool loads. Is the client-side script in the page head, loaded synchronously or with an anti-flicker snippet, or buried in a tag manager where it fires late? Late loading causes flicker (visitors briefly see the original before the variant), which biases results and irritates brand teams. Check whether the tool is integrated with your analytics, whether goals are defined consistently, and who has publishing rights. Our comparison of client-side and server-side A/B testing explains the trade-offs if a change of architecture is on the table.
Then check for sample ratio mismatch (SRM): when a test configured as 50/50 ends up with, say, 52/48, something is excluding visitors from one variant, and the result cannot be trusted. Fabijan and colleagues at Microsoft found SRM in about 6% of Microsoft's experiments. Run a chi-squared test on the visitor counts of the last 10 to 20 completed tests. If several fail, stop and find out why before you launch anything new.
3. The past test archive
Ask for every test run in the last two years, with hypothesis, screenshots, dates, sample sizes, results and decisions. What you receive is itself a finding. Look at the win rate (suspiciously high rates usually mean peeking or loose thresholds), how many tests were stopped early, how many were powered for a realistic effect, and whether anyone can find a test from 18 months ago in less than five minutes. Our guide to A/B test statistical models covers the checks worth running on old results.
4. Backlog, capacity and constraints
Read the backlog. How many ideas carry evidence (analytics, research, customer feedback) and how many are opinions? How is it prioritised, and who can add to it? Then find out how much design and development capacity is really available for tests each month, who signs off brand changes, and what legal or privacy constraints apply (price display rules, claims, accessibility, consent). These constraints do not stop a programme, but discovering them in month three, after a test is built, does.
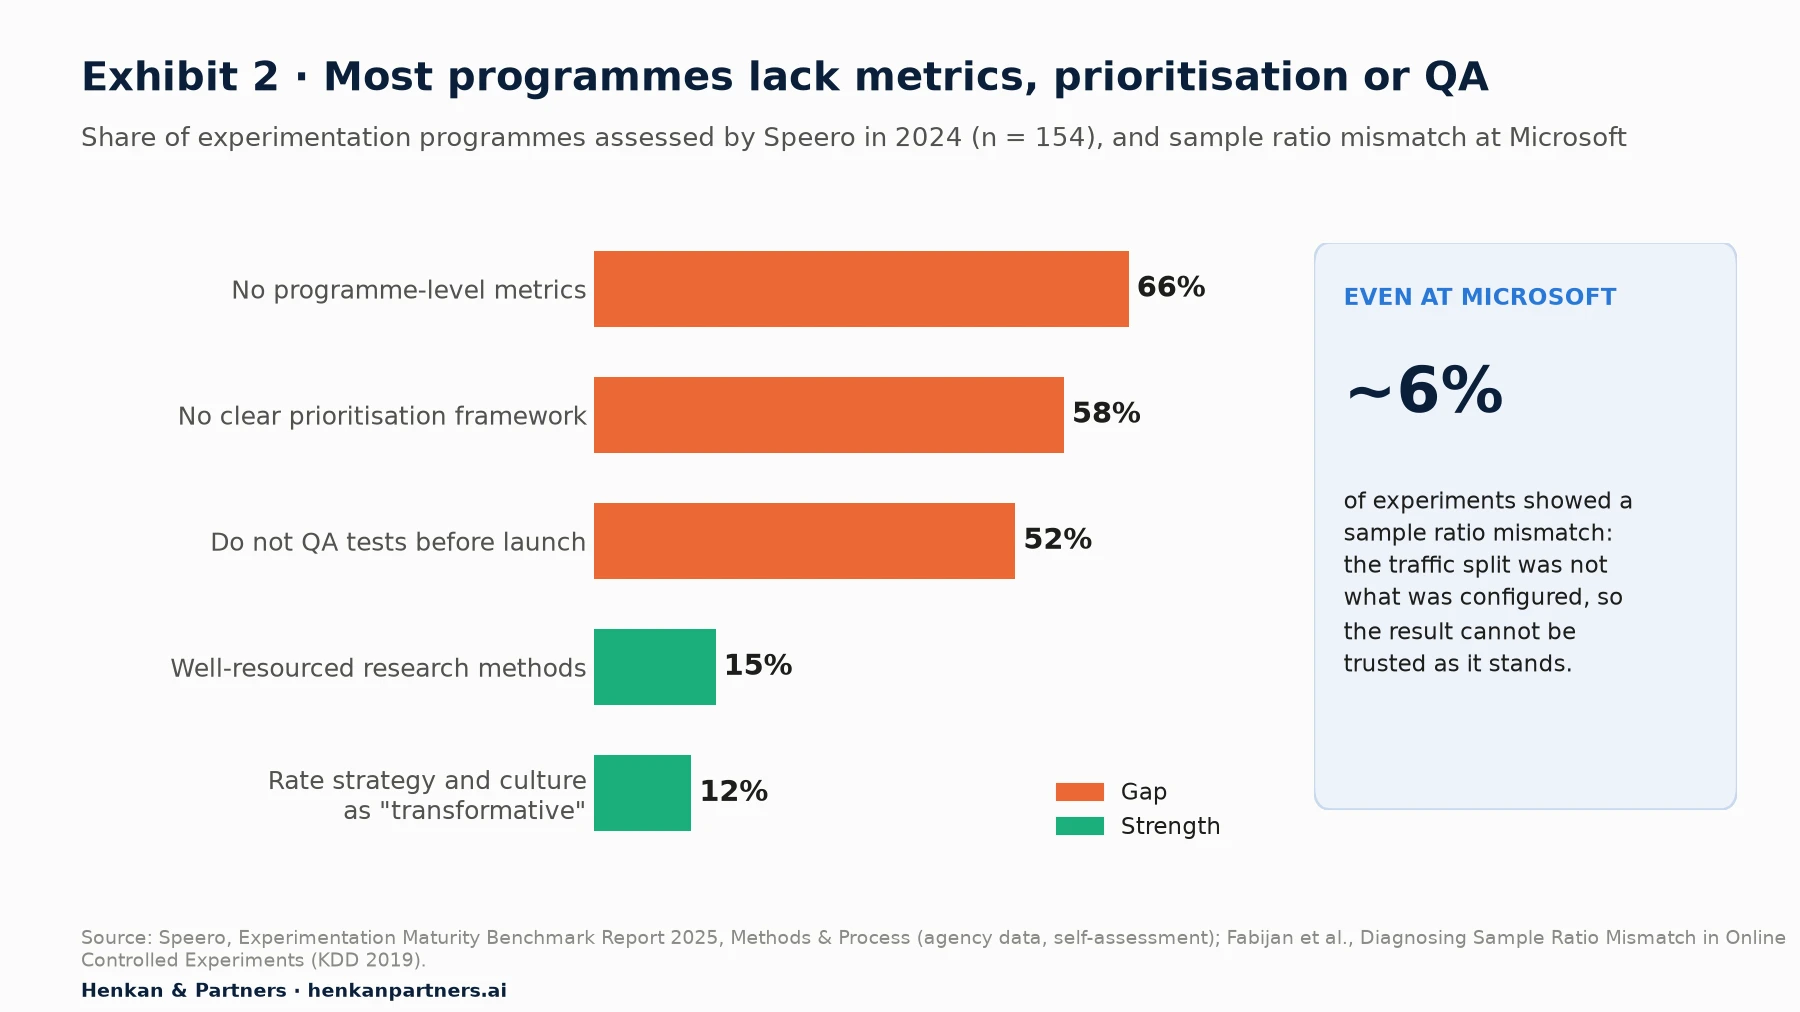
What this shows. The programme you inherit will probably have gaps, and that is normal rather than a scandal. Two-thirds of the programmes Speero assessed had no programme-level metrics and half did not QA tests before launch. Even Microsoft, with one of the most mature platforms in the world, catches traffic-split problems in about one experiment in seventeen. Finding these issues early is a sign of a good audit, not of a bad predecessor.
The one-page audit scorecard
Summarise the audit on one page, using the scorecard below. Rate each line green, amber or red, add one sentence of evidence, and share it with your sponsor at the end of month one. The thresholds are rules of thumb from our experience, not industry standards; adjust them to your business.
| Area | Good (green) | Warning (amber) | Red flag (red) |
|---|---|---|---|
| Analytics vs back-end orders | Stable, explained gap; reconciled at least monthly | Gap known but drifts, or reconciled only when someone asks | Nobody has compared them, or the gap swings week to week |
| Consent and tagging | Consent rate known by market; tags fire after consent; documented data layer | Consent rate known overall only; some undocumented tags | Tags fire before consent, or nobody knows the consent rate |
| Testing tool set-up | Loaded early, no visible flicker, integrated with analytics | Some flicker on slow devices; goals defined differently from analytics | Loaded late via tag manager; frequent flicker; no integration |
| QA and SRM | Written QA checklist; SRM checked on every test | QA done informally; SRM checked sometimes | No QA before launch; SRM never checked, or several recent failures |
| Past test archive | Every test documented with hypothesis, result and decision, searchable | Results in slides or spreadsheets; hard to search | No record, or only the "wins" |
| Statistical practice | Sample size planned; fixed duration or valid sequential method | Durations planned but tests often stopped early | Tests stopped when "significant"; win rate looks too good to be true |
| Backlog | Ideas carry evidence and a consistent score | Scored, but mostly opinions | No backlog, or a list of senior requests |
| Delivery capacity | Agreed monthly design and dev time for tests | Capacity borrowed ad hoc from other teams | No capacity; tests wait months to be built |
| Governance | Brand, legal and privacy sign-off paths known and quick | Sign-off exists but is slow or unclear | Sign-off discovered after tests are built |
For practitioners. Do not present the audit as a list of your predecessor's mistakes. Present it as "what we need to be true before we scale", with owners and dates. The people who built the current set-up are often the ones who will help you fix it.
For leaders. If your new CRO lead brings you a red-heavy audit at day 30, that is good news: problems found before scaling are far cheaper than disputed results after.
Section 3 · Stakeholders
Map and win your stakeholders early, because people, not statistics, decide whether a programme survives
Experimentation touches almost every team in an e-commerce business. Product and tech own the code. Brand and creative own how the site looks and sounds. Legal and privacy own what you can say and collect. Finance owns the numbers leadership believes. CRM, merchandising, trading and customer service each own a slice of the customer experience. Any of them can slow a test down; a few can stop the programme.
In practice, these teams rarely oppose experimentation itself. They oppose surprises, extra work and risk to things they are accountable for. Your job in month one is to learn what each of them is accountable for, and to design your process so that it protects those things.
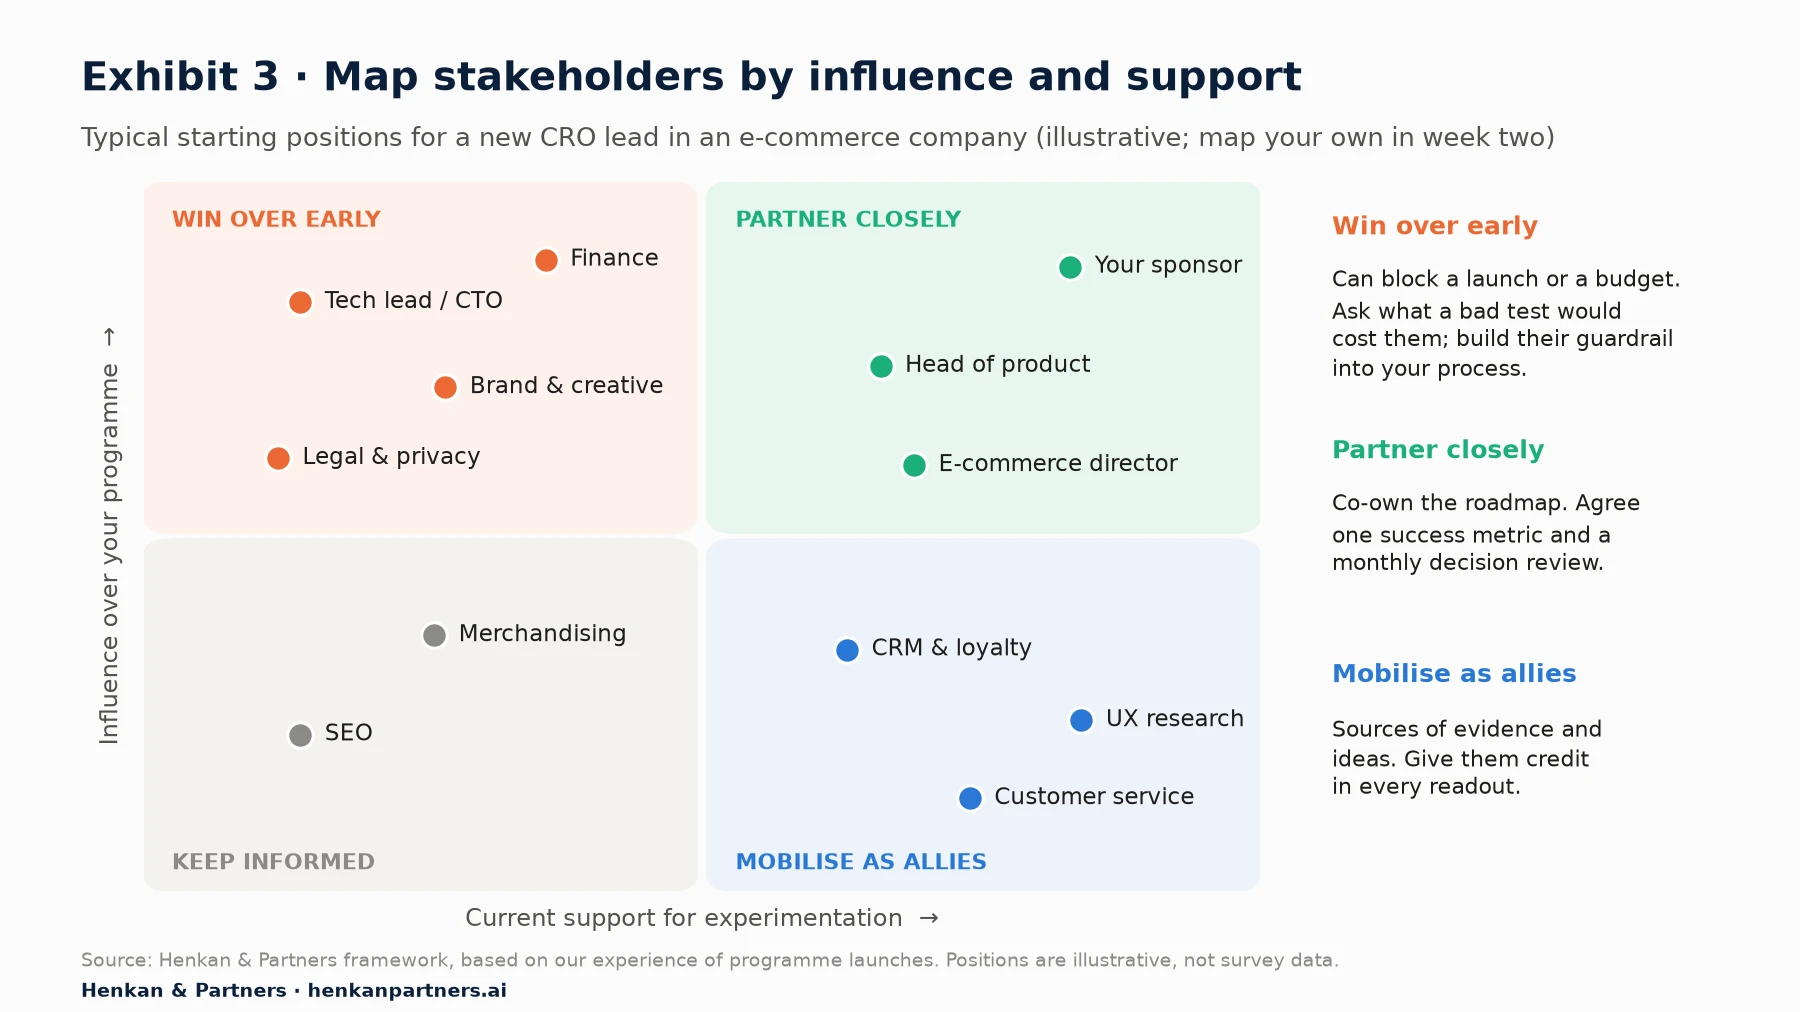
What this shows. The top-left quadrant is where new CRO leads lose most time: people with the power to block a launch or a budget who have not yet seen what experimentation does for them. The positions shown are typical, not universal; in some companies brand is your strongest ally and product is sceptical. Redraw the map with real names in week two and update it at day 60.
What each stakeholder needs to hear
| Stakeholder | What they can do | What they worry about | What to offer them |
|---|---|---|---|
| Tech / engineering | Block or slow launches; own site performance | Flicker, page speed, code quality, incidents | A QA checklist, performance budget and rollback plan they help write |
| Product | Co-own roadmap; give or withhold dev capacity | Tests that conflict with their releases | A shared roadmap and tests that answer their open questions |
| Brand & creative | Veto designs and copy | Off-brand variants, inconsistent experience | Brand guardrails built into the brief; early sight of designs |
| Legal & privacy | Stop tests on claims, pricing or data | Consent breaches, misleading claims | A pre-approved list of test types and a fast review path for the rest |
| Finance | Fund or cut the programme; validate impact | Inflated uplift claims that never reach the P&L | Conservative impact estimates and holdback checks they can audit |
| CRM & merchandising | Supply ideas and audiences; clash with campaigns | Tests that disrupt promotions | A shared calendar and joint tests on their priorities |
| Leadership / sponsor | Set expectations; protect the programme | Slow progress, no visible outcome | A clear 90-day plan and a monthly decision review |
Fifteen questions to ask in your first 1:1s
Book 30 to 45 minutes with 15 to 20 people across these teams in your first three weeks, including people two levels below the leaders. Use the same core questions with everyone, so you can compare answers. Take notes; the patterns are your diagnosis.
- What does success look like for your team this year, and how is it measured?
- What do you think the experimentation programme is for?
- What is the best test result you remember from here, and why did it matter?
- Has a test ever caused a problem for your team? What happened?
- Which numbers do you trust, and which do you quietly ignore?
- Where do customers struggle most, in your view? What evidence do you have?
- What question about customers would you most like answered this year?
- What would make you say no to a test?
- How much notice do you need before a test goes live on your area?
- Who else should I speak to, and who tends to be left out of decisions?
- What did the previous set-up get right that I should keep?
- What has been tried before and quietly abandoned?
- What upcoming launches, campaigns or re-platforms should the programme plan around?
- How would you like to hear about results: a dashboard, a meeting or a short note?
- If I could fix one thing in the next 90 days that would make your life easier, what would it be?
At the end of month one, play back what you heard to your sponsor and, ideally, to the group: the three or four themes, where people agree, where they disagree, and what you propose to do. People support plans they recognise their own words in. For more on building support over the long term, see our deep dive on building a culture of experimentation.
Section 4 · First tests
Pick first tests for learning and visibility, because most tests do not win
Your first tests have a different job from the tests you will run in year two. They must prove that the process works end to end (research, design, build, QA, launch, analysis, decision), they must be visible to the people you need on your side, and they must produce a clear answer whatever the outcome. Maximum uplift is a secondary goal, because the odds of any single test winning are low.
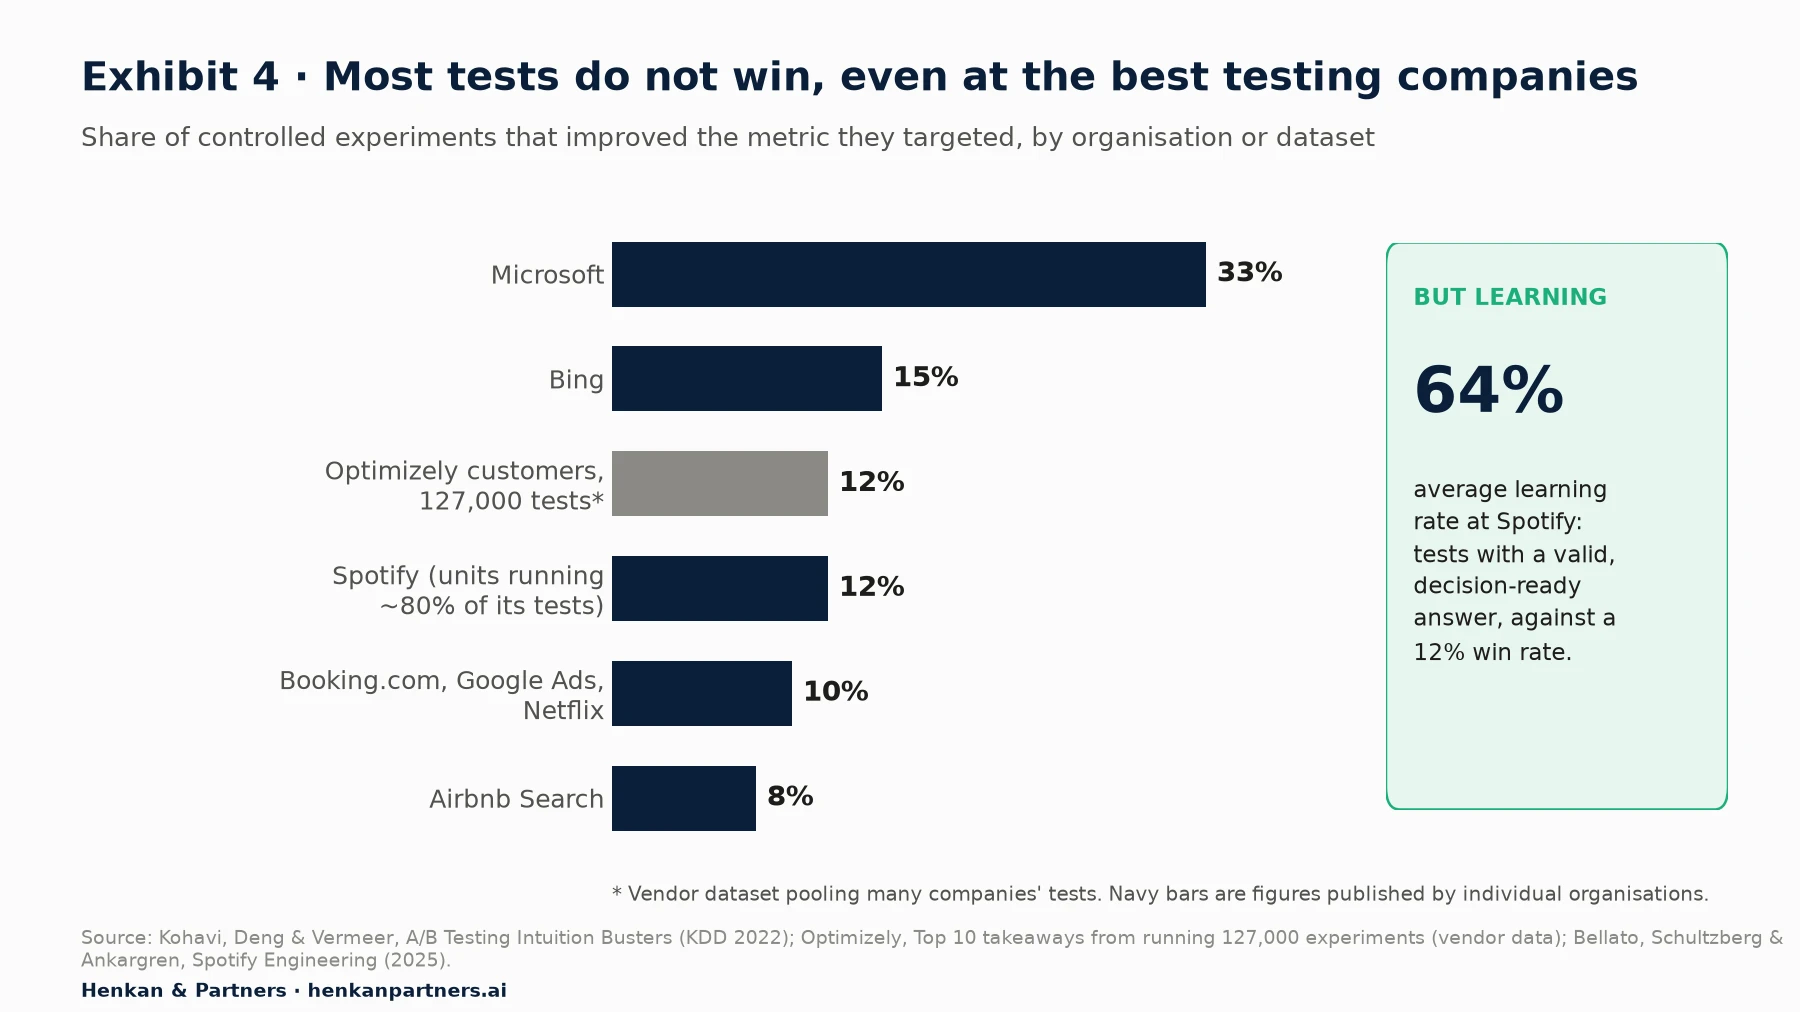
What this shows. Published success rates for mature programmes range from 8% to 33%. Kohavi, Deng and Vermeer report about 10% at Booking.com, Google Ads and Netflix, and Optimizely reports 12% across 127,000 experiments in its customer base. Spotify's engineering team found a win rate of about 12% in the units running most of its experiments, but a learning rate of 64%: most tests gave a valid answer, often that something should not ship.
Never promise an uplift number in your first month
Given these win rates, promising "+10% conversion this year" is promising something you cannot control. There is a statistical trap too. Kohavi, Deng and Vermeer show that when only about 10% of ideas truly work, roughly 22% of statistically significant results are false positives, even with a well-powered test (80% power) and a standard threshold. At Airbnb Search's 8% success rate the false positive risk rises to about 26%. If you promise uplift, you will be tempted to celebrate results that are not real, and finance will eventually notice.
What you can promise is a process: a number of well-designed tests, each with a clear decision, a trustworthy measurement system, and a growing body of knowledge about your customers. Uplift follows from that, but on the business's timetable, not yours.
What makes a good first test
- It is backed by evidence you found in the audit. A funnel drop, a pattern in session replays, a recurring complaint in customer service logs. See our deep dive on turning customer insights into a test backlog.
- It runs where there is traffic. A high-traffic page or template (product pages, listing pages, basket) so the test can finish in a few weeks.
- It is bold enough to detect. A change large enough that a real effect would be visible with your sample size (see Section 6). Tiny copy tweaks on low traffic teach nothing.
- A stakeholder cares about the answer. Ideally it answers a question someone asked you in a 1:1. That person becomes your advocate whatever the result.
- It is low-risk to build and QA. Your first test is also a test of your delivery process. Do not start with a checkout rebuild.
Run two or three of these in days 31–60, not ten. At the same time, fix the foundations the audit uncovered. Some problems do not need a test at all: a broken filter, an error message nobody understands or a page-speed defect should simply be fixed.
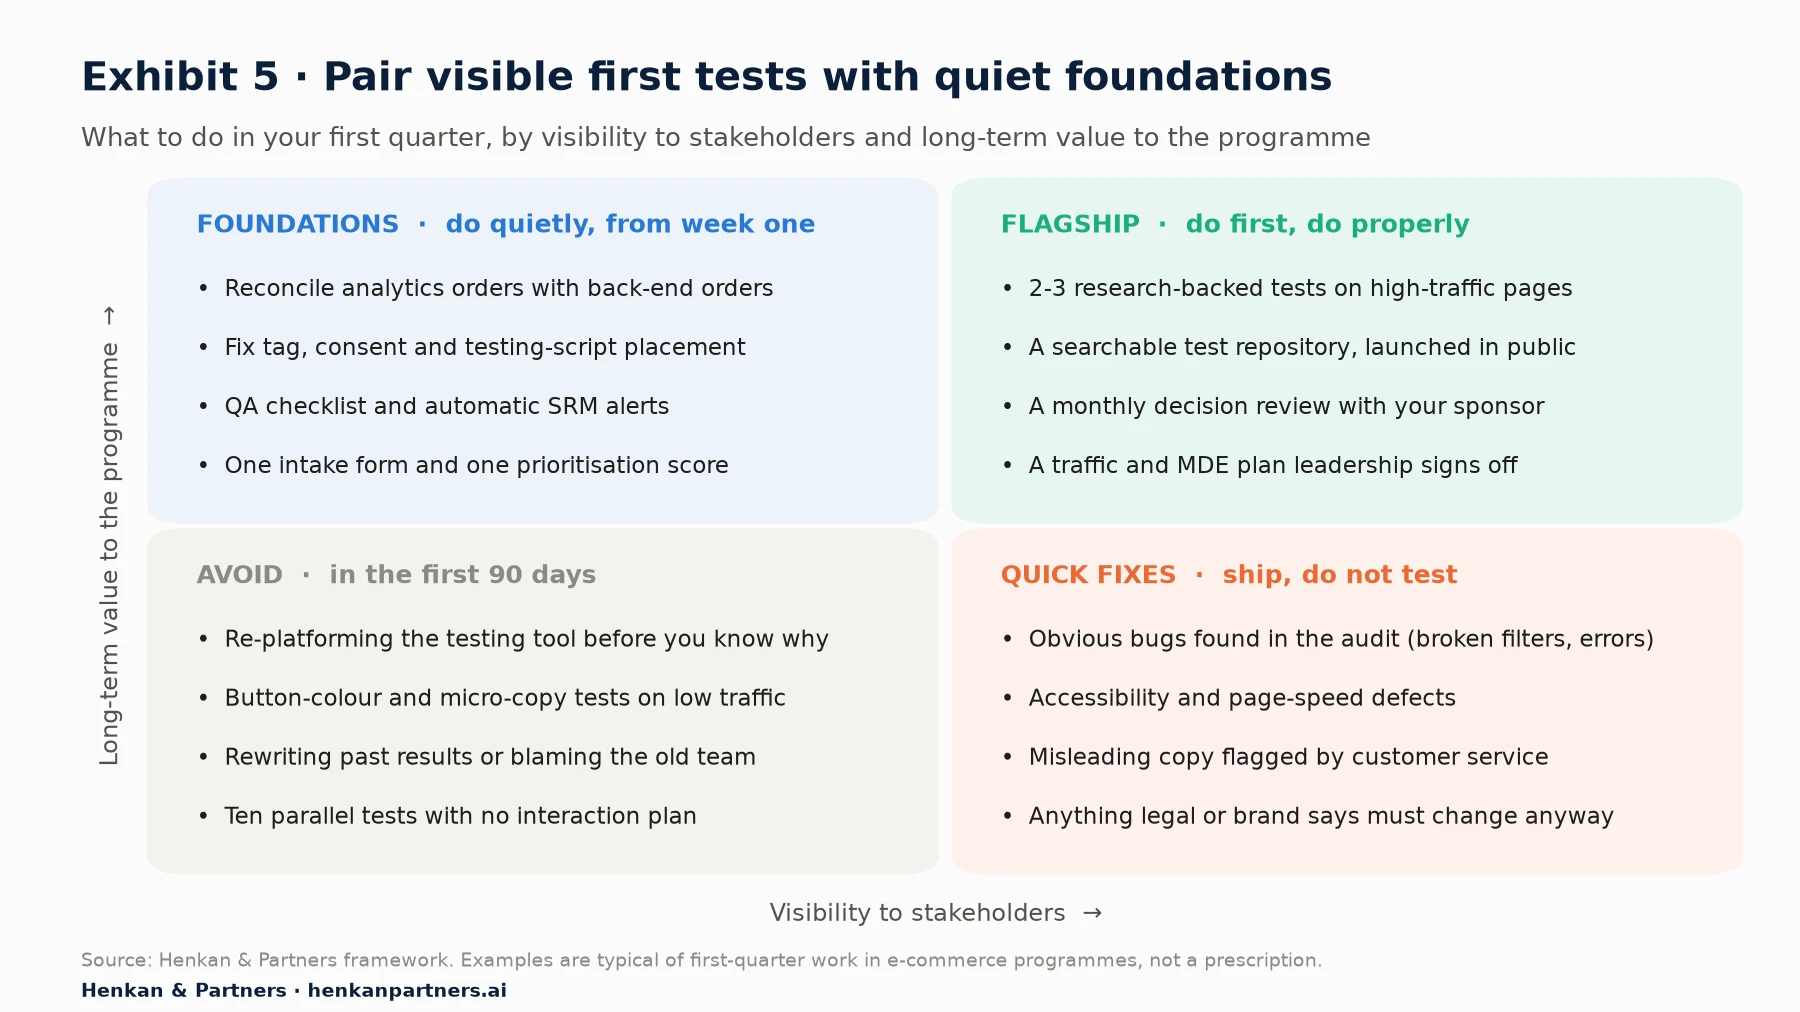
What this shows. The top-right quadrant is what leadership will see; the top-left is what makes it trustworthy. Most new leads over-invest in the bottom-left: re-platforming the testing tool or running many small tests to look busy. The bottom-right matters too, because shipping obvious fixes quickly builds goodwill with teams who have waited months for them.
Section 5 · Days 31–90: operating model
Days 31–90: build the operating model, because rhythm and records outlast any single result
By day 30 you know what you inherited. The next 60 days turn that knowledge into a way of working that will still run when you are on holiday. The 30-60-90 day plan below summarises the phases.
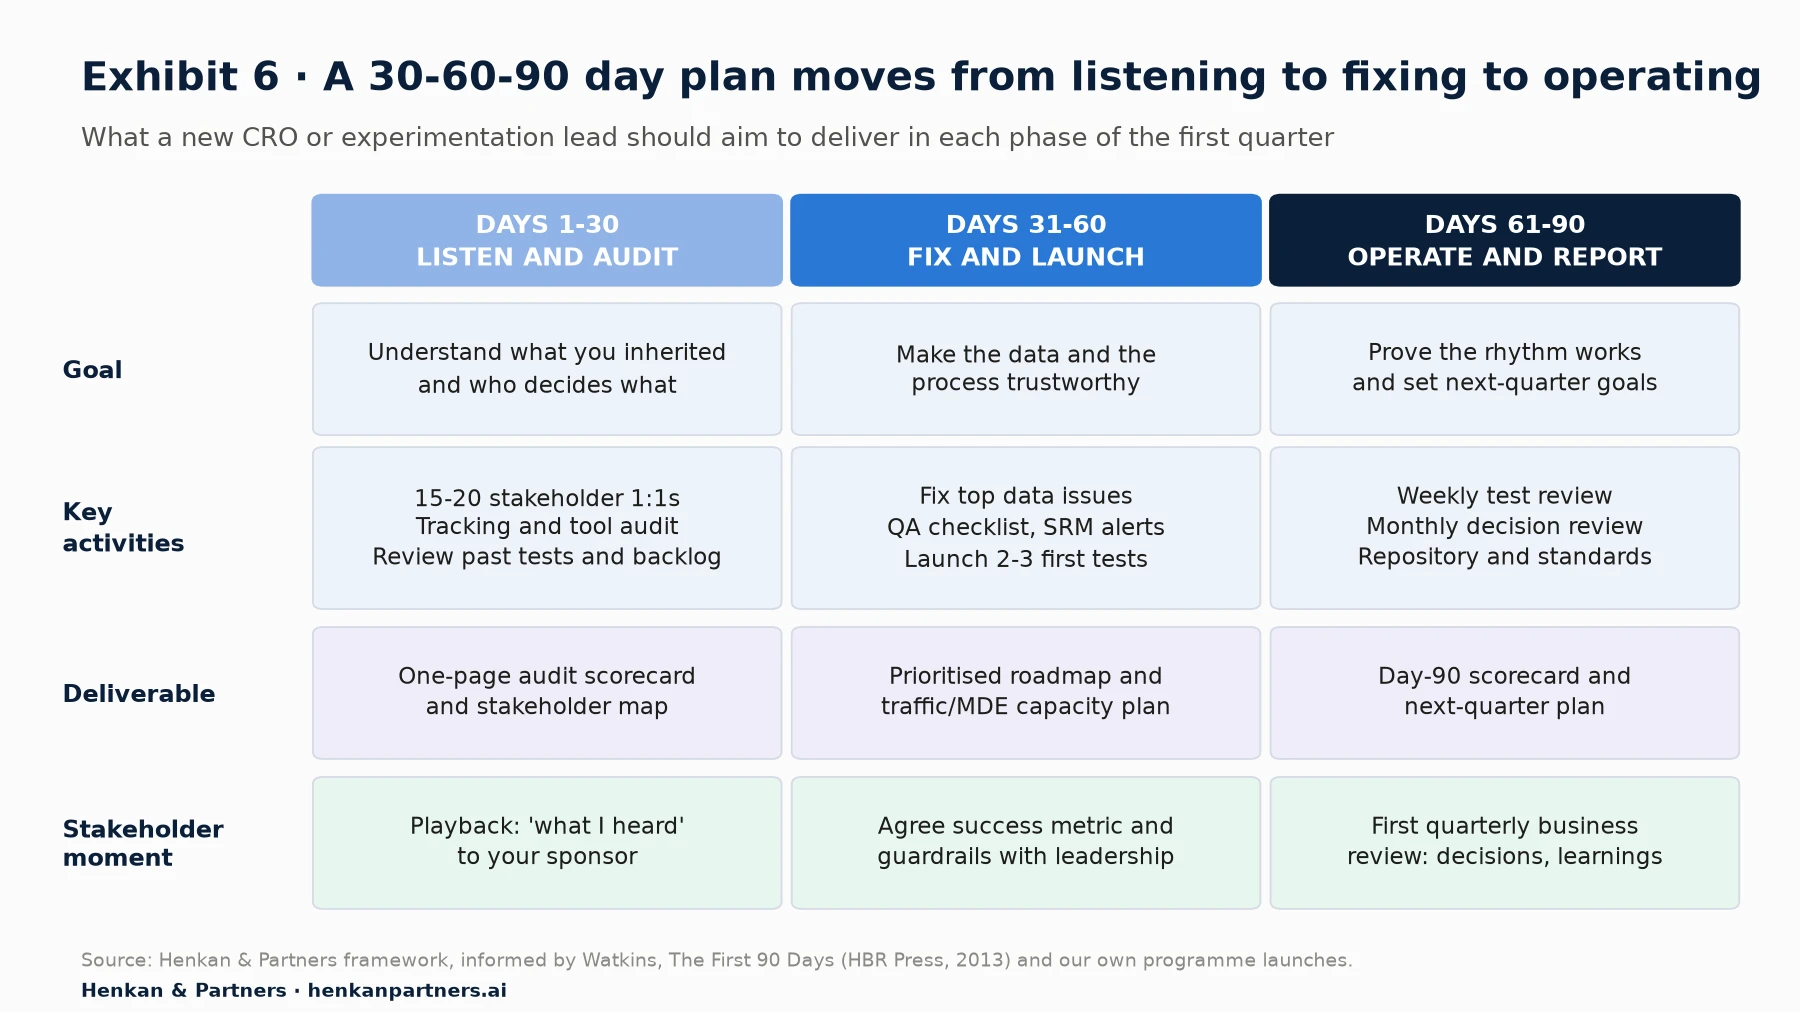
What this shows. Each phase ends with a deliverable and a stakeholder moment, because a plan nobody sees does not build trust. The phases overlap in practice: foundation fixes start in week two, and stakeholder conversations never stop. What matters is that each 30-day block has a visible output your sponsor can point to.
Intake and prioritisation
Create a single front door for test ideas: a short form asking for the problem, the evidence, the page or audience, the expected impact and the metric. Score every idea the same way. Any consistent framework beats none; we prefer scores that weight evidence heavily and check that the test can reach a detectable effect in a reasonable time. Publish the scored backlog so people can see why their idea is or is not next. Transparency ends most arguments about priority.
QA and launch checklist
Write a one-page QA checklist with tech and agree it together: browsers and devices, consent states, logged-in and logged-out users, tracking of every goal, performance impact, flicker, and a named person who can switch the test off. Add an automated SRM check to every running test, with an alert. If you use an agency or an outsourced developer, the checklist is part of their brief.
Rituals that keep the programme running
| Ritual | Frequency | Who | Purpose |
|---|---|---|---|
| Test review | Weekly, 30 min | CRO team, analyst, developer, designer | Status of live and upcoming tests, QA issues, SRM alerts, blockers |
| Decision review | Monthly, 45–60 min | Sponsor, product, e-commerce, finance | Concluded tests, decisions taken, learnings, next month's priorities |
| Backlog grooming | Fortnightly | CRO lead plus idea owners | Score new ideas, retire stale ones, check evidence |
| Quarterly business review | Quarterly | Leadership | Programme scorecard, capacity, investment asks |
A searchable test repository and documentation standards
Every concluded test should have one record with the same fields: hypothesis and evidence, audience and pages, screenshots of every variant, dates and sample sizes, primary and guardrail metrics, result with confidence intervals, decision (ship, stop, iterate) and the learning in one sentence. Tag records by page, lever and customer problem so the repository can answer questions like "what have we learned about delivery costs on product pages?". A shared spreadsheet is a fine start; what matters is that it is searchable and complete, including the tests that lost.
Reporting that leadership reads
Leadership does not want a list of tests. It wants to know what was decided, what the business now knows, and what it will do differently. Replace "we ran 12 tests" with "we made 5 decisions: we shipped the new delivery message, we stopped the redesigned filters before they cost us, and we learned that returning customers ignore promotional banners". Keep impact estimates conservative and state their uncertainty. Finance will trust a modest, well-explained number far more than a heroic one.
For practitioners. Write the decision and the learning before you write the uplift. If a test has no decision, it is not finished.
For leaders. Ask your CRO lead "what did we decide this month because of experiments?" rather than "how many tests did we run?". The first question rewards judgement; the second rewards busywork.
Section 6 · Sizing
Size what is possible with traffic and minimum detectable effect, because arithmetic sets honest expectations
The most useful document you can produce in your first 60 days is a capacity plan: how many tests your traffic can support each year, on which parts of the site, at what size of effect. It turns vague expectations into a shared, checkable number, and it protects you from being judged on test volume the site cannot physically produce.
The key idea is the minimum detectable effect (MDE): the smallest true change your test can reliably detect with a given sample size. The smaller the effect you want to detect, the more visitors you need, and the relationship is roughly quadratic: halving the MDE requires about four times the traffic. Our essential guide to A/B testing explains the statistics in more depth.
Worked example: how many tests can this site run?
The example below is illustrative. It assumes a page area (say, all product pages) with a 2.5% baseline conversion rate, a two-sided significance level of 5%, 80% power, a 50/50 split between control and one variant, a minimum of two full weeks per test to cover weekly cycles, 50 testing weeks a year, and one test at a time in that page area. We computed the sample sizes with the standard two-proportion formula.
n per variant = (z(1-α/2) × √(2·p̄·(1-p̄)) + z(1-β) × √(p1·(1-p1) + p2·(1-p2)))² / (p2 - p1)²
where p1 = baseline rate (2.5%), p2 = p1 × (1 + relative MDE), p̄ = (p1 + p2) / 2, z(0.975) ≈ 1.96, z(0.80) ≈ 0.84 (unrounded values used in Table 4)
| Relative MDE | Users per variant | Total users | Weeks at 25,000 users/week | Weeks at 100,000 users/week | Tests a year in one area (25k / 100k per week) |
|---|---|---|---|---|---|
| 2% | 1,545,440 | 3,090,880 | 123.6 | 30.9 | 0 / 1 |
| 5% | 250,846 | 501,692 | 20.1 | 5.0 | 2 / 8 |
| 10% | 64,199 | 128,398 | 5.1 | 1.3 (run 2) | 8 / 25 |
| 15% | 29,193 | 58,386 | 2.3 | 0.6 (run 2) | 16 / 25 |
| 20% | 16,792 | 33,584 | 1.3 (run 2) | 0.3 (run 2) | 25 / 25 |
Read the table like this. On a page area with 100,000 users a week, detecting a 2% relative lift (from 2.5% to 2.55%) takes about 31 weeks, so you could run one such test a year there. Detecting a 10% lift takes under two weeks, so the two-week minimum applies and you could run around 25 tests a year in that area. With 25,000 users a week, even a 5% lift needs about 20 weeks.
Three practical conclusions follow. First, low-traffic areas can only support bold changes; testing small tweaks there is a waste of weeks. Second, most sites have only a few areas with enough traffic for frequent testing, so the capacity plan is really a plan for those areas. Third, the number of tests a year is a consequence of traffic and ambition, not a target to set in advance. In Ascend2's 2025 survey of 402 marketing decision-makers, limited traffic for statistically significant results was the most cited A/B testing challenge, at 51%.
For leaders. If someone promises 100 tests a year on a site with modest traffic, ask them to show the capacity plan. Either the tests will be too small to detect anything, or they will overlap on the same pages and audiences in ways that make results hard to trust.
For practitioners. Techniques such as CUPED (variance reduction with pre-experiment data), testing higher-traffic proxy metrics or running tests across page templates rather than single pages can increase capacity. Use them, but explain them; a clever method nobody understands will be distrusted.
Section 7 · Traps
Avoid the eight traps that catch new CRO leads, because each one costs months of trust
None of these traps comes from lack of skill. They come from the pressure to show progress quickly in a new job. Knowing them in advance makes them easier to avoid.
- Inheriting broken tracking and testing anyway. If analytics and back-end orders do not reconcile, every result is disputable. Fix the measurement first, even if it delays your first test by a month.
- Promising an uplift number. With win rates of 8–33% at mature companies, a promised number turns every inconclusive test into a failure and every false positive into a temptation.
- Testing too small. Low-traffic pages, subtle changes and short durations produce inconclusive results that teach nothing. Check the MDE before you build.
- Running many parallel tests without a plan. Overlapping tests on the same pages and audiences can interact, and QA load multiplies. Decide which areas and audiences each test owns.
- Measuring success by test count. Volume only helps when tests are well chosen and trusted. Count decisions and learnings instead.
- Ignoring qualitative research. Analytics tells you where customers drop off, not why. Usability tests, session replay and customer feedback produce better hypotheses. See our Voice of Customer guide and session replay guide.
- Becoming the "tool admin". If your calendar fills with building other people's tests in the tool, nobody is doing the research, prioritisation and decision-making. Protect time for the work only you can do.
- Going to war with the previous team's work. Rewriting old results or publicly dismissing past decisions alienates the people who know where the problems are. Re-analyse quietly, credit what was good, and move on.
Section 8 · AI
Use AI to speed up research and building, but keep humans on evidence and QA
If you are starting a CRO role now, you have tools your predecessors did not. Used well, they compress the slowest parts of the first 90 days: synthesising research, drafting hypotheses and building test variants. Used carelessly, they produce confident-sounding insights with no evidence behind them.
Where AI helps in the first 90 days
- Research synthesis. Large language models can cluster thousands of survey answers, reviews or customer service tickets into themes in hours rather than weeks. Our deep dive on analysing survey data with LLMs explains how to do this with checks.
- Hypothesis drafting. Given a clear finding and your hypothesis template, AI can draft variants of a hypothesis and suggest test designs. Treat the output as a first draft for your team, not a backlog.
- Prompt-based test building. Several testing platforms now let you describe a variant in plain language and generate the code. Kameleoon introduced prompt-based experimentation in June 2025 and reports, from over 1,000 such experiments on 48 websites, a 97% reduction in test creation time (vendor data, based on its assumption of three developer days per test). Our research on prompt-based experimentation looks at what it changes in practice.
- Analysis and reporting. AI agents connected to your analytics and testing data (for example through MCP, the Model Context Protocol) can draft readouts, check for SRM and flag anomalies. See our deep dive on AI agents in the experimentation workflow.
The risks to manage
- Hallucinated insights. A model asked "why do customers abandon the basket?" will give a fluent answer whether or not your data supports it. Every insight used for a test must trace back to real evidence you can show.
- Weaker QA. Faster test building means more code reaching production with less human review. Keep your QA checklist, and test generated variants on real devices and consent states.
- Generic ideas. Models trained on the same public best practices suggest the same tests to everyone. Your advantage is evidence about your own customers.
- Data governance. Check with legal and privacy before sending customer data, verbatims or order data to an AI service.
A reasonable first-90-days stance is to use AI for speed on research synthesis and building, with a human owner for every insight, every hypothesis and every launch. Synthetic research can help generate hypotheses too, as our deep dive on synthetic users for customer research discusses, but it is never a substitute for testing with real customers.
Section 9 · Day-90 scorecard
Report a first-quarter scorecard at day 90, because it defines what the programme is for
Your day-90 review is the moment the organisation decides what your programme is for. If you report test counts and uplifts, you will be measured on test counts and uplifts forever. If you report trust, rhythm, decisions and learnings, you set a more durable standard, and you give finance and leadership a reason to invest in capacity rather than demand volume.
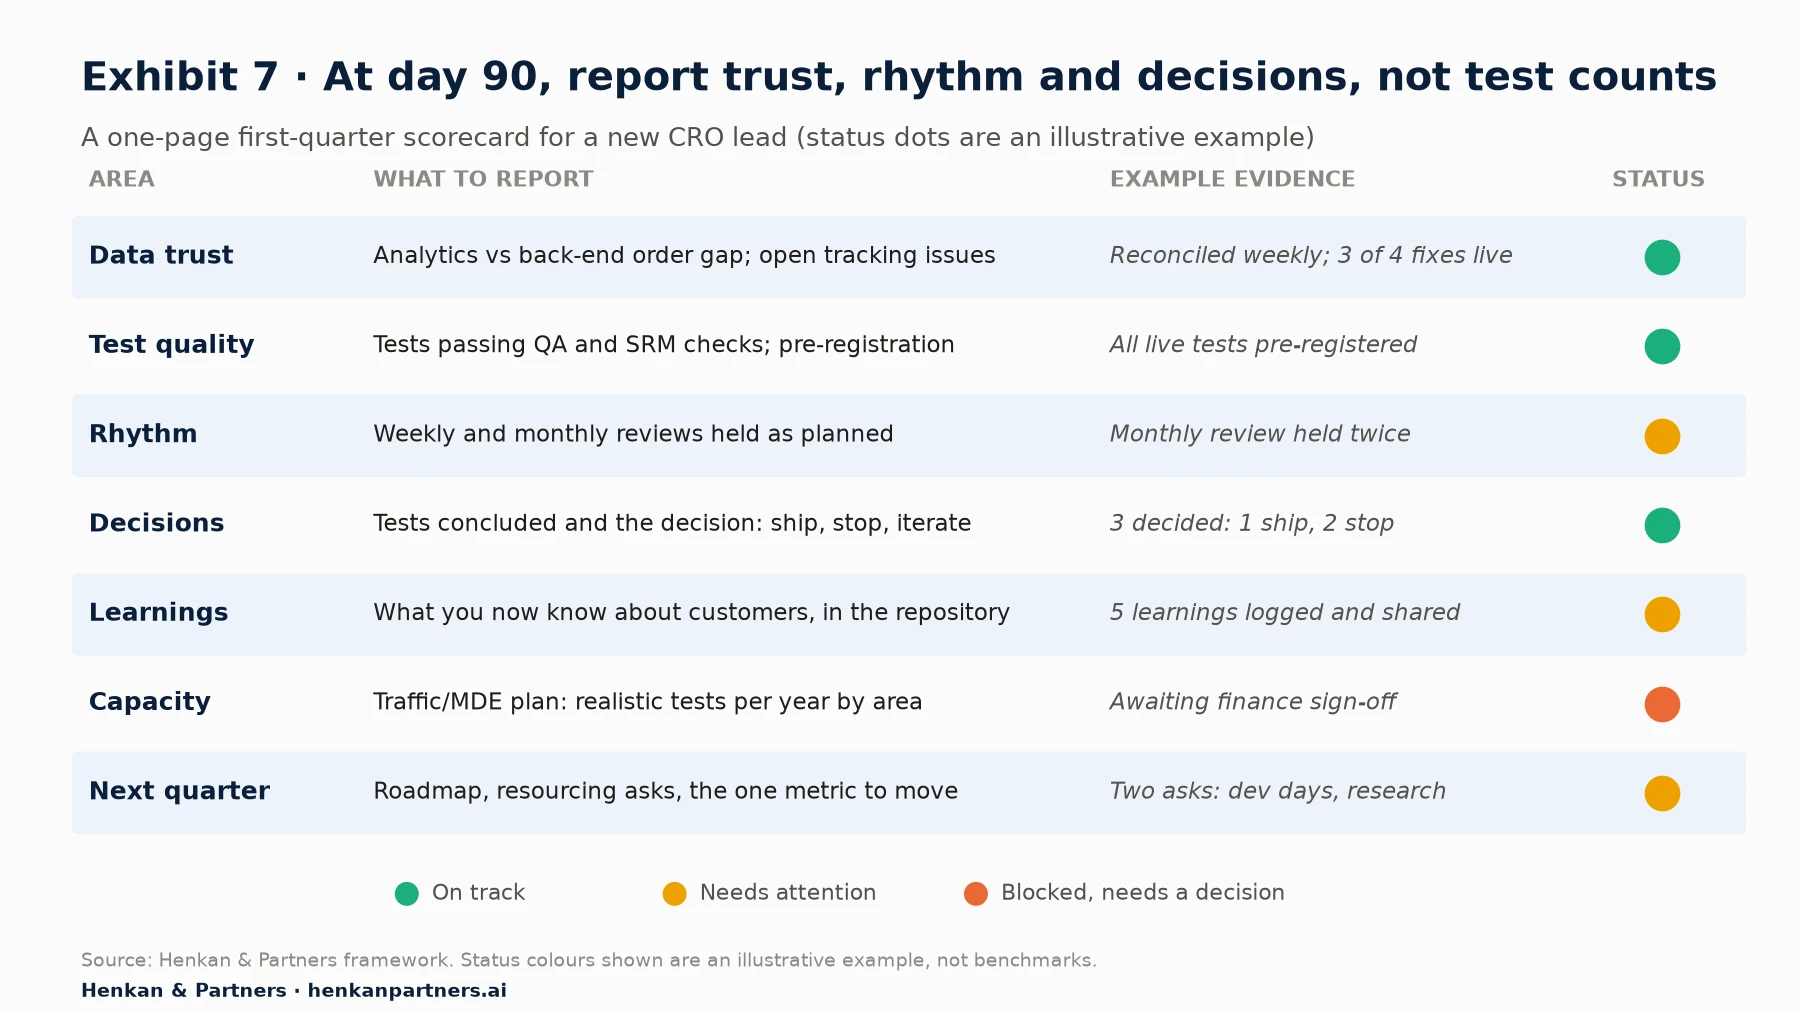
What this shows. The scorecard fits on one page and every line can be checked. The example evidence and status colours are illustrative; yours will differ. What matters is that amber and red lines come with a specific ask, such as developer days, research budget or a finance sign-off, so the review ends with decisions rather than applause.
What to include in the day-90 review
- The audit scorecard, updated. Which red and amber lines from day 30 are now green, and which remain.
- The first tests. For each: hypothesis, result with its uncertainty, decision, and what the business learned. Include the ones that lost.
- The operating model. Rituals running, repository live, QA checklist in use, intake form adopted.
- The capacity plan. How many tests a year the site can support, where, and at what effect size.
- Next quarter. Three priorities, the one metric the programme will focus on, and specific resourcing asks.
For benchmarks on the e-commerce metrics your scorecard will reference, see our deep dive on e-commerce KPIs and benchmarks, and for the wider optimisation discipline, the guide to conversion rate optimization.
Section 10 · What to do next
What to do next
1. This week: book your 1:1s and request the test archive
Send meeting requests to 15 to 20 people across the teams in Exhibit 3, using the questions in Section 3. In the same week, ask for every test from the last two years and read access to analytics, the testing tool and back-end order data.
2. Week two: reconcile orders and check SRM
Compare daily analytics orders with back-end orders for the last 8 to 12 weeks, and run an SRM check on the last 10 to 20 tests. These two checks tell you more about the programme's health than any dashboard.
3. Day 30: share the audit scorecard and your playback
Fill in Table 1, name the situation you have walked into, and play back what you heard. Agree the success metric and guardrails for the programme with your sponsor.
4. Day 60: launch two or three first tests and the capacity plan
Choose tests using the criteria in Section 4, run them through your new QA checklist, and publish the traffic and MDE capacity plan so everyone knows what the site can support.
5. Day 90: present the scorecard and ask for what you need
Use the structure in Exhibit 7. End with specific asks. If you would like a second pair of eyes on your audit, capacity plan or first-quarter roadmap, we are happy to help. Talk to us.
Disclosure: Henkan & Partners is a CRO and experimentation consultancy and sells audit, programme set-up and fractional experimentation services related to the topics in this article. We partner with several testing vendors, including Kameleoon.
FAQ
Frequently asked questions about the first 90 days in a CRO role
Frequently asked questions
What is a CRO 90-day plan?
A CRO 90-day plan is a structured plan for a new conversion rate optimisation or experimentation lead's first three months. It typically covers an audit of data, tools and past tests (days 1–30), fixes and first tests (days 31–60), and an operating model with a first scorecard (days 61–90).
What should a new CRO manager do in the first 30 days?
Listen and audit. Hold 15 to 20 stakeholder 1:1s, reconcile analytics orders with back-end orders, check the testing tool set-up and recent tests for sample ratio mismatch, review the test archive and backlog, and find out design, development, brand and legal constraints. Summarise it on a one-page scorecard.
Should I run A/B tests in my first month in a new CRO role?
Usually not, unless the data and tool are already known to be trustworthy. A few weeks spent checking tracking and QA avoids disputed results later. You can ship obvious fixes, such as bugs or accessibility defects, without testing them.
What is a realistic A/B test win rate?
Published figures for mature programmes range from about 8% (Airbnb Search) to 33% (Microsoft), with around 10% at Booking.com, Google Ads and Netflix (Kohavi, Deng and Vermeer, 2022). Optimizely reports 12% across 127,000 experiments in its customer base (vendor data).
How many A/B tests can my website run per year?
It depends on traffic, baseline conversion rate and the size of effect you want to detect. In our illustrative example, a page area with 100,000 weekly users at a 2.5% conversion rate can run about one test a year to detect a 2% relative lift, but around 25 a year to detect 10%. Build a capacity plan for your own traffic.
Which stakeholders matter most for a CRO programme?
Those who can block you: tech or engineering, brand and creative, legal and privacy, and finance. Your sponsor, product and e-commerce leaders are usually natural partners. Map everyone by influence and support in week two.
What should I report to leadership after 90 days in a CRO role?
Report data trust, test quality, operating rhythm, decisions taken, learnings, testing capacity and next-quarter priorities and asks. Avoid leading with test counts or headline uplifts, which set the wrong standard for the programme.
How can AI help a new head of CRO?
AI can speed up research synthesis, hypothesis drafting, test building (for example prompt-based experimentation) and reporting. The risks are hallucinated insights, weaker QA and generic ideas, so every insight should trace back to real evidence and every launch should pass human QA.
What is sample ratio mismatch and why check it in an audit?
Sample ratio mismatch (SRM) is when the observed split of visitors between variants differs significantly from the configured split, for example 52/48 instead of 50/50. It signals that something is excluding users from one variant, so the result cannot be trusted. Microsoft found SRM in about 6% of its experiments.
Key terms
- Conversion rate optimisation (CRO)
- The practice of improving the share of visitors who complete a goal, using research and experiments. It matters because it turns existing traffic into more revenue without extra acquisition spend.
- Experimentation programme
- The people, process, tools and governance an organisation uses to run controlled experiments. It matters because results are only as trustworthy as the programme that produces them.
- A/B test
- A controlled experiment that randomly splits visitors between a control and one or more variants and compares outcomes. It matters because it separates the effect of a change from everything else going on.
- Win rate
- The share of experiments that significantly improve their primary metric. It matters because realistic win rates (8–33% at mature companies) set honest expectations.
- Learning rate
- Spotify's measure of the share of experiments that give a valid, decision-ready answer, whether ship, stop or neutral. It matters because it values tests that prevent bad changes, not only wins.
- Minimum detectable effect (MDE)
- The smallest true effect a test can reliably detect with its sample size, significance level and power. It matters because it determines how long tests take and how many a site can run.
- Statistical power
- The probability that a test detects an effect of a given size if it really exists, usually set at 80%. It matters because underpowered tests miss real effects and inflate the share of false wins.
- False positive risk
- The probability that a statistically significant result is not a real effect. It matters because it rises sharply when true win rates are low, which is the norm.
- Sample ratio mismatch (SRM)
- A significant difference between the configured and observed split of visitors across variants. It matters because it signals a bug that makes the result untrustworthy.
- Flicker
- The brief display of the original page before a client-side variant loads. It matters because it biases results and damages the customer experience.
- Consent mode and behavioural modelling
- Google's mechanism for adjusting tag behaviour to user consent and estimating the behaviour of users who decline analytics cookies. It matters because it changes how much of your traffic is observed directly.
- Guardrail metric
- A metric a test must not harm, such as page speed, returns or average order value. It matters because it protects stakeholders' concerns and makes approvals easier.
- Test repository
- A searchable record of every concluded test with hypothesis, result, decision and learning. It matters because it turns individual tests into institutional knowledge.
- Capacity plan
- An estimate of how many tests each area of the site can support per year at a given effect size. It matters because it replaces arbitrary test-count targets with arithmetic.
- 30-60-90 day plan
- A plan that splits a new role's first quarter into three phases with goals and deliverables. It matters because it makes progress visible before results exist.
Sources
All sources were checked in September 2026. Optimizely and Kameleoon figures are vendor data from their own customer bases; Speero figures are agency data from a self-assessment benchmark; Ascend2 figures come from a survey of marketing decision-makers. Exhibits 3, 5, 6 and 7 and Tables 1 to 3 are Henkan & Partners frameworks based on our experience; stakeholder positions and scorecard statuses are illustrative. Table 4 is our own illustrative calculation using the standard two-proportion sample-size formula.
- Keller, S., McKinsey & Company (2018). Successfully transitioning to new leadership roles.
- Watkins, M. D. (2013). The First 90 Days, Updated and Expanded. Harvard Business Review Press · IMD book page.
- Watkins, M. D., Harvard Business Review (2009). Picking the right transition strategy (the STARS model).
- IMD (n.d.). Hit the ground running: transitioning to new leadership roles.
- Kohavi, R., Deng, A. & Vermeer, L. (2022). A/B Testing Intuition Busters. KDD 2022.
- Optimizely (n.d.). Top 10 takeaways from running 127,000 experiments (vendor data).
- Bellato, M., Schultzberg, M. & Ankargren, S., Spotify Engineering (2025). Beyond winning: Spotify's experiments with learning framework.
- Fabijan, A., Gupchup, J., Gupta, S., Omhover, J., Qin, W., Vermeer, L. & Dmitriev, P. (2019). Diagnosing Sample Ratio Mismatch in Online Controlled Experiments: A Taxonomy and Rules of Thumb for Practitioners. KDD 2019.
- Speero (2025). Experimentation Maturity Benchmark Report 2025, Methods & Process (agency data).
- Ascend2 (2025). A/B Testing in Marketing research report.
- Google (n.d.). Behavioral modeling for consent mode. Analytics Help.
- Kameleoon (2025). Introducing Prompt-Based Experimentation (vendor).
- De Todaro, F., Kameleoon (2025). What we learned from 1,000 prompt-based experiments (vendor data).
- Kohavi, R., Tang, D. & Xu, Y. (2020). Trustworthy Online Controlled Experiments. Cambridge University Press.
- Deng, A., Xu, Y., Kohavi, R. & Walker, T. (2013). Improving the Sensitivity of Online Controlled Experiments by Utilizing Pre-Experiment Data (CUPED). WSDM 2013.
- Henkan & Partners. Illustrative sample-size and capacity calculations (two-proportion formula, α = 0.05 two-sided, 80% power).