Focus
Experimentation ROI: How to Build the Business Case for an A/B Testing Programme
Alexandre Suon · 2026-09-29
Sooner or later, every CRO or product lead is asked what the testing programme is worth. This deep dive shows how to calculate experimentation ROI honestly: the three sources of value, a programme model you can fill in with your own numbers, the biases that inflate most business cases, a worked example, and how to present the ROI of A/B testing to a CFO as scenarios and a payback period rather than a single heroic number.
Executive summary
- An experimentation programme earns money in three ways, and most business cases count only one. Wins shipped are the obvious source. Losses avoided matter as much: at Microsoft about one-third of tested ideas had negative results, and at Spotify 42% of experiments ended with a decision not to ship. Learning and speed come third and should be counted cautiously.
- Start from realistic win rates, not from your best test. Published win rates range from 8% (Airbnb Search) to 33% (Microsoft), and Optimizely reports 12% across 127,000 experiments (vendor data). Gains are also concentrated: in 1,450 Bing experiments, the top 2% of ideas produced 74.8% of historical gains.
- A programme ROI model multiplies a handful of drivers and subtracts the full cost. Tests per year × win rate × true uplift × revenue exposed × durability × margin, plus losses avoided, minus tools, people, development and the traffic spent on losing variants. Every driver can be estimated from your own history or a sourced range.
- Naive business cases overstate value by several times. Summing the measured lifts of winning tests ignores the winner's curse, novelty decay, overlap between tests, timing and margin. In our illustrative example, a naive sum of EUR 4.8 million becomes EUR 744,000 of realised first-year revenue and EUR 260,000 of margin. A holdout group is the only way to measure the real total.
- The same budget can pay back in five months or not within two years. In our illustrative model of a EUR 50 million online business spending EUR 345,000 a year, the base case pays back in month 11 and returns 90% over 24 months; the cautious case does not pay back within two years. Win rate, revenue exposed and margin move the answer most.
- Present a range, a payback period and a measurement plan to your CFO. Show three scenarios, the break-even revenue base, and how a holdout will confirm the result within two or three quarters. Then fund the programme in stages against that evidence.
Section 1 · Definition
Experimentation ROI is the margin a programme adds, net of its full cost, compared with not testing at all
Experimentation ROI (return on investment of an experimentation or A/B testing programme) is the incremental profit the programme creates over a period, minus everything it costs to run, divided by that cost. It counts the value of changes shipped because tests proved them, the value of harmful changes stopped because tests caught them, and, where it can be evidenced, the value of faster and better decisions.
Two words in that definition do most of the work. Incremental means the profit you would not have made without the programme, not all the revenue that passed through a tested page. Programme means the portfolio of tests over a year, not the single test that went well. A business case built on one spectacular win is an anecdote; a business case built on the portfolio is something a finance team can underwrite.
The question is harder than it looks because most teams do not measure it. Speero's 2025 maturity benchmark, based on 154 respondents surveyed during 2024, found that 66% have no programme-level metrics at all and only 8% strongly agree they have them (agency data). If you cannot say what the programme delivered last year, you cannot credibly say what it will deliver next year.
This article is about the programme as a whole. If your question is specifically about personalisation, our deep dive on measuring personalisation ROI covers holdout sizing, incrementality and the personalisation P&L in detail. If you are new in the role and need to set expectations first, start with your first 90 days in a new CRO role.
Disclosure: Henkan & Partners sells experimentation programmes and fractional experimentation teams. We have tried to make the model below vendor- and agency-neutral: every input can be replaced with your own data, and the worked example shows a scenario in which a programme does not pay back.
Section 2 · Sources of value
A programme earns money in three ways, and most business cases count only one
Ask a team what their programme is worth and they will usually add up their winning tests. That captures one branch of the value tree and misses two others. Exhibit 1 sets out the full tree we use with clients.
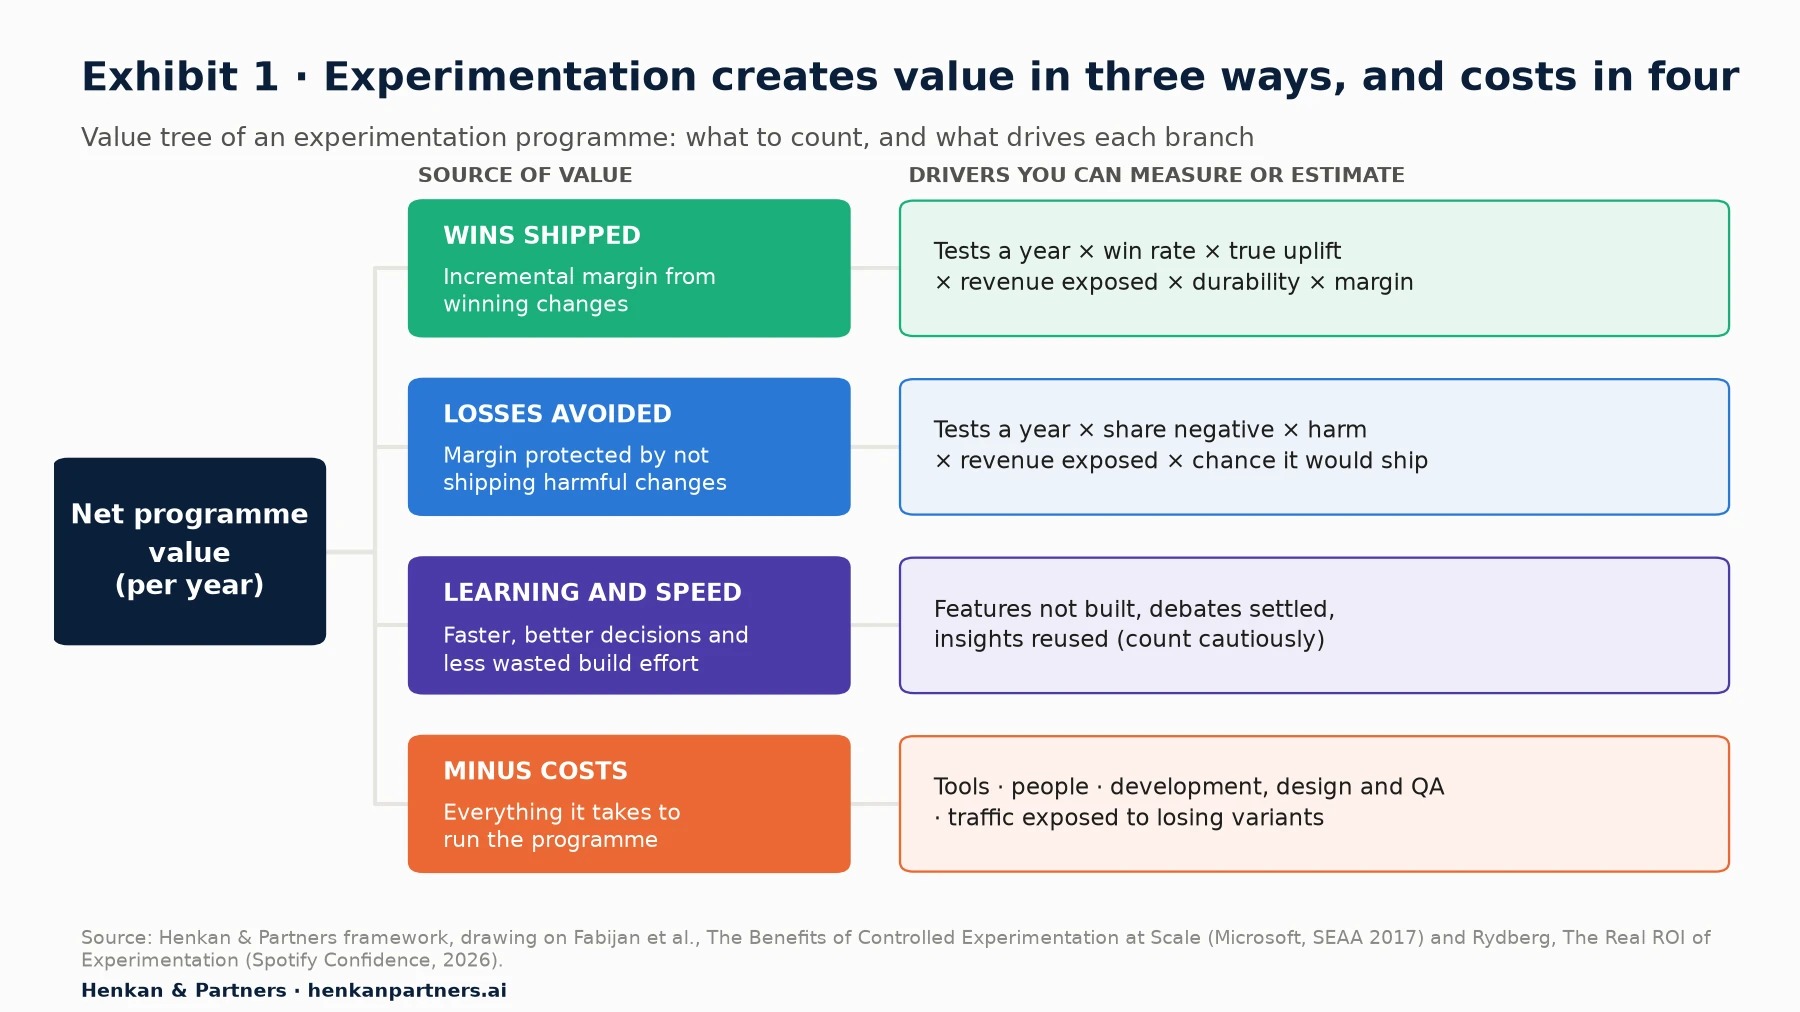
What this shows. Wins shipped and losses avoided can both be expressed in money with the same inputs: how many tests you run, how often they win or lose, by how much, and on how much revenue. Learning and speed are real but harder to price, so we keep them outside the headline number. Costs include the traffic you spend showing customers variants that turn out to be worse.
1. Wins shipped
This is the familiar branch: a variant beats the control, you ship it, and it keeps earning. Its value depends on the true size of the uplift, the share of revenue that passes through the page or feature you changed, how long the gain lasts, and your margin. Most of Section 7 is about why the measured uplift overstates the true one.
2. Losses avoided
Many of the changes a team is confident about make things worse. Kohavi and Thomke reported in the Harvard Business Review that at Microsoft, one-third of tested ideas proved effective, one-third were neutral and one-third had negative results. Spotify's experimentation team reports that roughly 12% of its experiments win, while 42% end with the team deciding not to ship.
Without a test, a share of those harmful changes would have been launched on opinion. The value of catching them is the margin you would otherwise have lost, for as long as the change would have stayed live. It is the least visible branch, because nobody sees the loss that did not happen, and it is often the one a CFO finds most persuasive once it is explained: testing is insurance against your own roadmap.
3. Learning and speed
Microsoft's experimentation researchers list benefits that go beyond individual wins: validating where value lies across a portfolio, catching quality problems before a wide rollout, and "stabilizing and lowering product complexity" by not deploying features that do not improve metrics (Fabijan et al., 2017). In practice this shows up as features you did not build, debates settled in a fortnight instead of a quarter, and insights reused across teams.
We recommend listing these benefits in the business case but not putting a number on them unless you have evidence, such as developer days saved by killing a feature after a painted-door test. A business case that stands on wins and losses alone is stronger; learning becomes the upside.
Our view. If your current report only lists winning tests and their lifts, add two lines before anything else: the number of tests that were stopped because they lost, and an estimate of what those changes would have cost if shipped. It changes the conversation from "how many winners?" to "what did we decide better?", which is the question a culture of experimentation is built on.
Section 3 · Public evidence
The public evidence shows large returns at scale, but it comes from a few very large companies
The best-documented returns on experimentation come from companies that run thousands of tests a year and publish their methods. They are useful as proof that the mechanism works, and dangerous as benchmarks for anyone else.
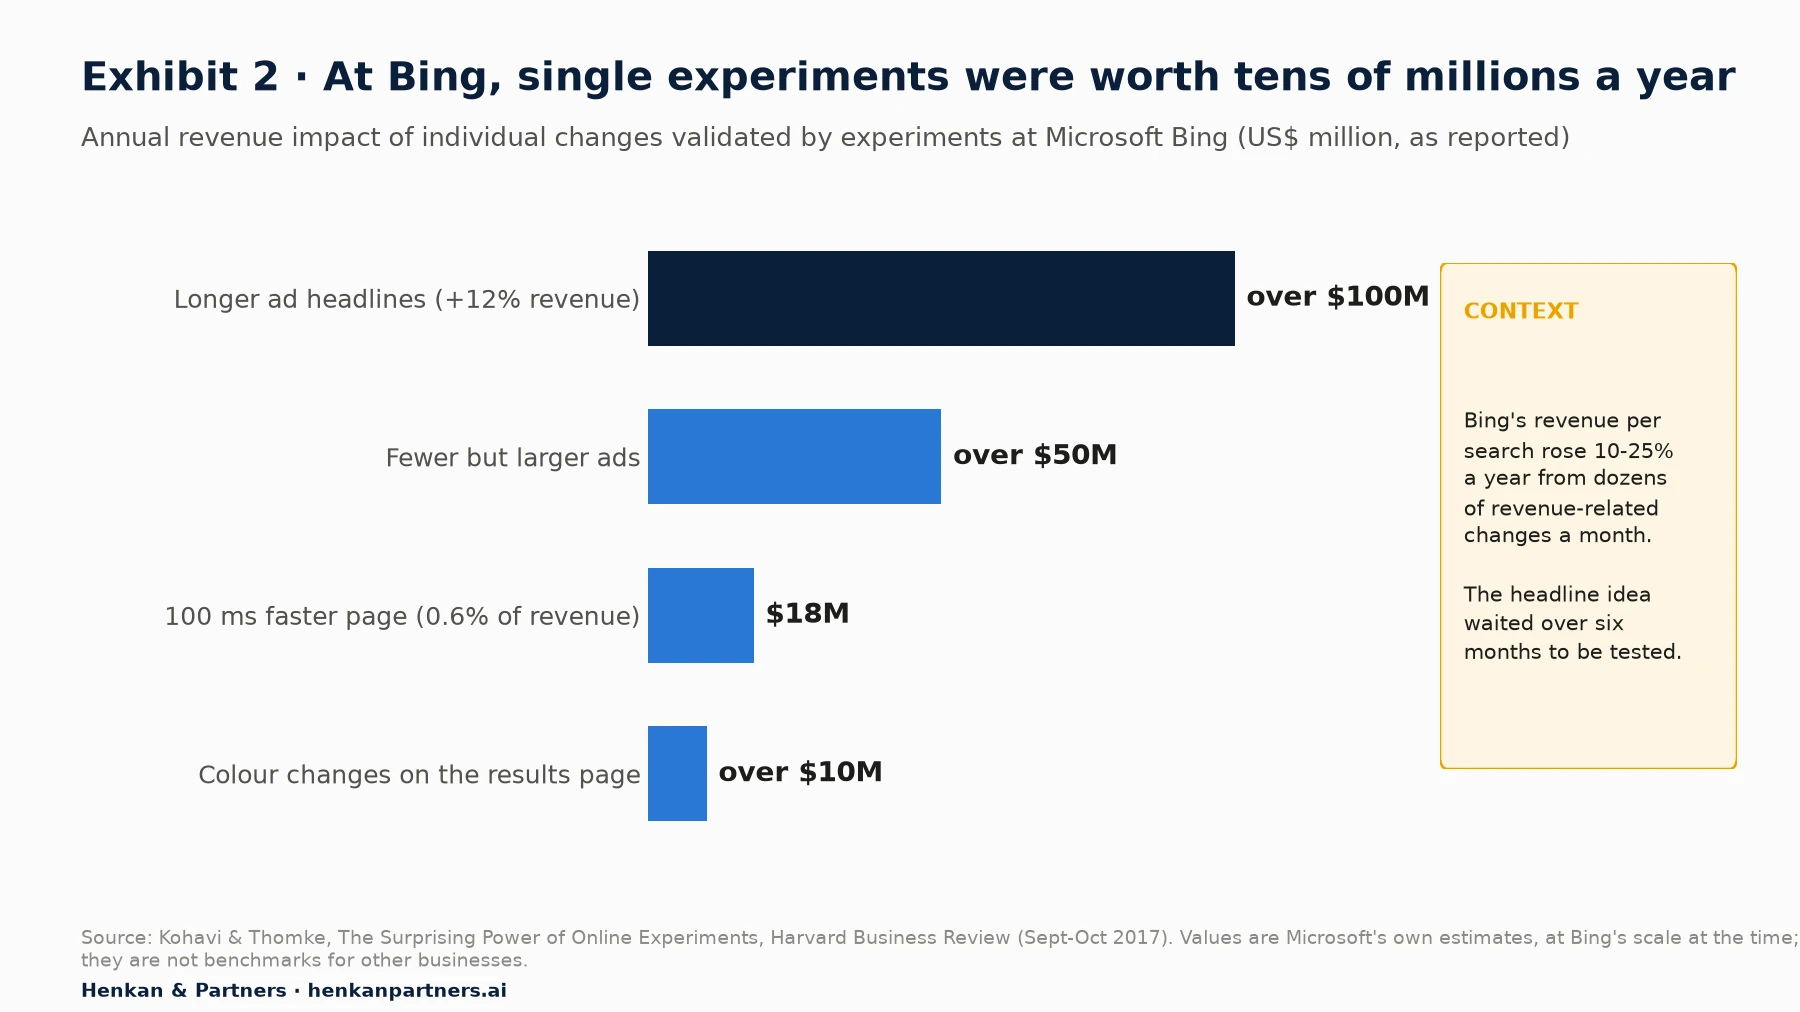
What this shows. The headline test is famous because it was an idea that had waited more than six months in the backlog and turned out to be, in the authors' words, the best revenue-generating idea in Bing's history. The more important number is in the context box: most of Bing's progress came from dozens of small revenue-related changes each month, which together increased revenue per search by 10% to 25% a year.
Other public examples point the same way. The same HBR article reports that moving credit card offers from Amazon's home page to the shopping cart page boosted profits by tens of millions of dollars annually. Microsoft's researchers state that experimentation generates "hundreds of millions of dollars of additional revenue annually" across its products. Stefan Thomke credits Booking.com's growth partly to running some 25,000 tests a year.
Google's work on long-term effects shows that value is not only about revenue lifts. Hohnhold, O'Brien and Tang (KDD 2015) measured how users learned to ignore ads over time, with a learning half-life of about 60 days. Their studies led to a sequence of launches that cut the ad load on Google's mobile search traffic by 50%, a change that was substantially revenue-negative in the short term but, once the long-term effect was measured, proved roughly revenue-neutral while markedly improving the user experience. Long-term measurement made it possible to launch a change that a short test would have rejected.
For marketers. Use these cases to explain the mechanism, never as a forecast. "Bing made USD 100 million from a headline" tells a board that small changes can matter; it says nothing about your site.
For leaders. The common thread is not the size of any single win but the volume of trustworthy decisions. Bing runs over 10,000 experiments a year, and even there, simple changes with such a big impact happen only once every few years (Kohavi, Tang & Xu, 2020).
Section 4 · Win rates
Most tests lose, so the model must start from a realistic win rate
The win rate is the share of experiments that significantly improve the metric they targeted. It is the first input to any programme model, and the one most often overstated in business cases. Exhibit 3 compiles the published figures we trust.
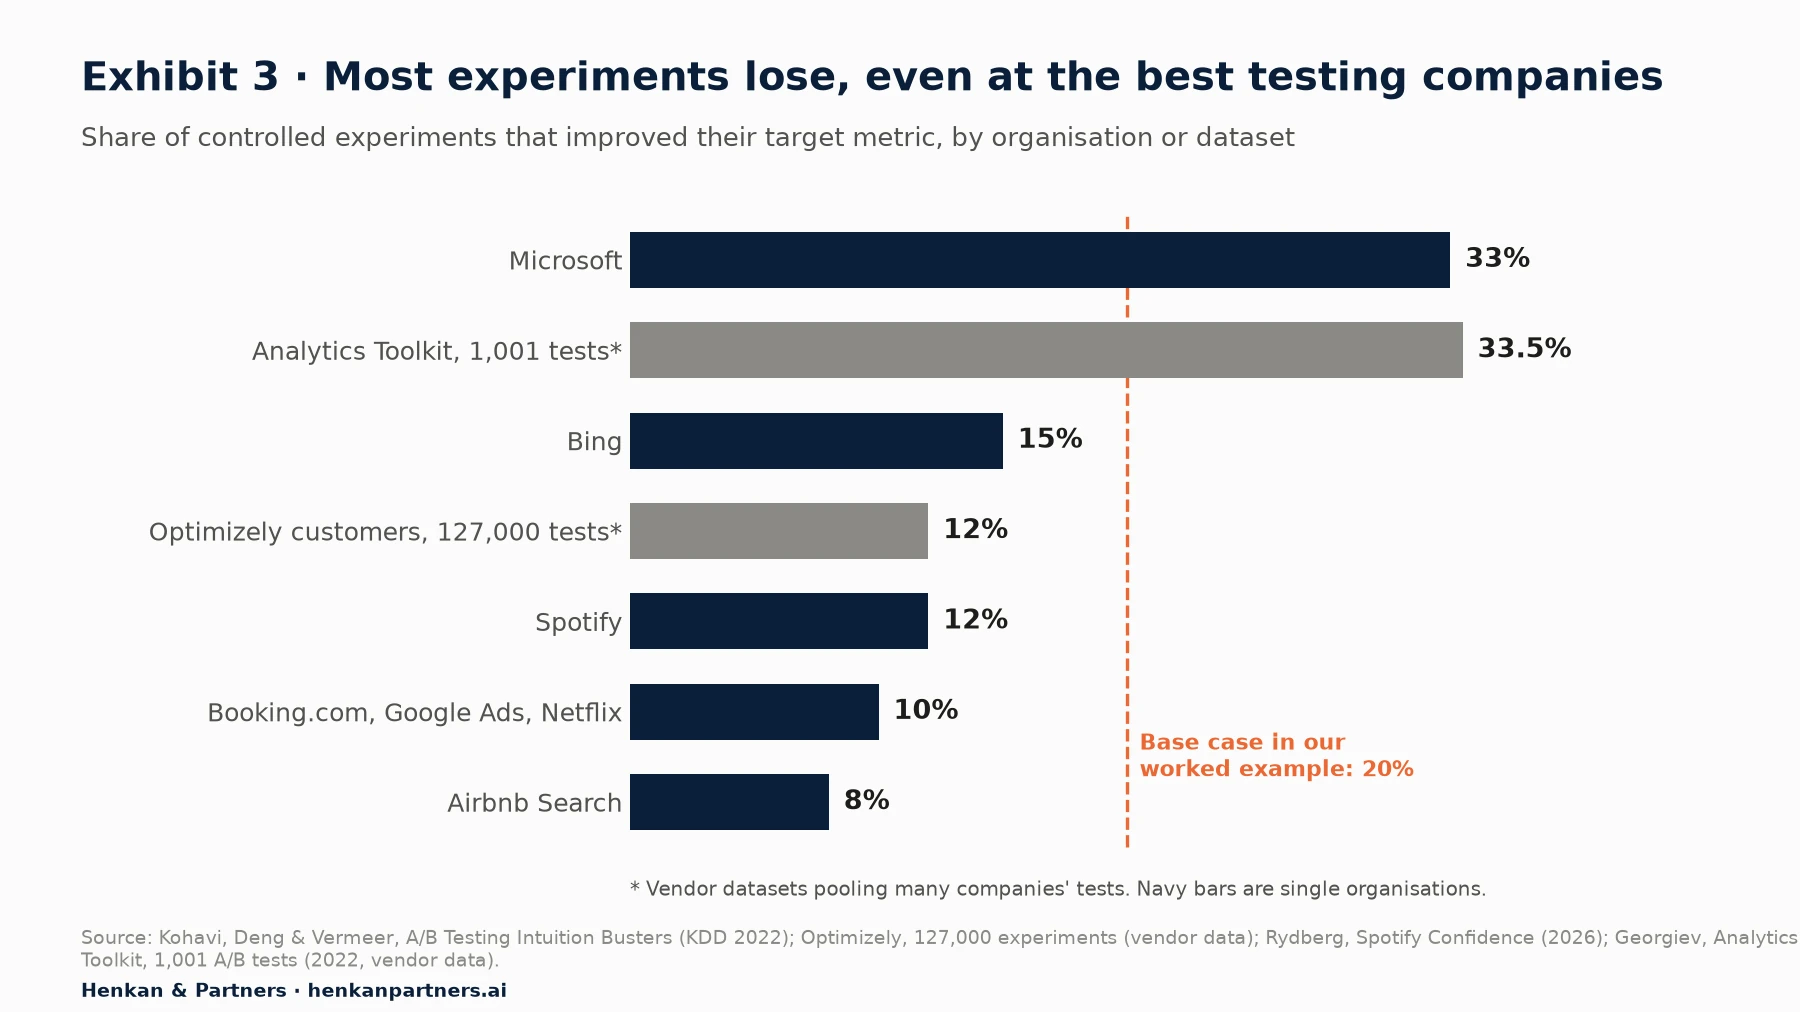
What this shows. Mature programmes at Booking.com, Google Ads, Netflix and Airbnb Search report 8% to 10%. Microsoft's one-third is an aggregate across many different products. The two pooled datasets disagree because they measure different populations: Optimizely's figure covers its customer base, while Analytics Toolkit's covers tests run through its statistical tool, which tend to be planned with power calculations. We use 20% as a base case and 10% to 30% as the range.
Win rates also interact with statistics. When few ideas truly work, a larger share of the "significant" results are false positives. Kohavi, Deng and Vermeer estimate the false positive risk, the probability that a statistically significant result is not real, at standard settings (80% power, 5% two-sided significance).
| Win rate (success rate) | Example | False positive risk at 80% power | False positive risk at 20% power |
|---|---|---|---|
| 33% | Microsoft | 5.9% | 20.0% |
| 10% | Booking.com, Google Ads, Netflix | 22.0% | 52.9% |
| 8% | Airbnb Search | 26.4% | 59.0% |
Two practical consequences follow for the ROI model. First, use your own historical win rate if you have at least 30 to 50 concluded tests; otherwise use a range. Second, if your programme runs underpowered tests, discount the value of its wins more heavily, because a meaningful share of them are noise. Our guide to A/B test statistical models explains the trade-offs between frequentist, Bayesian and sequential approaches.
Section 5 · Distribution of gains
Gains are concentrated in a few big winners, so model ranges, not averages
The second input, the average uplift of a winning test, is misleading in a different way. Uplifts are not normally distributed around a typical value. A few tests produce very large gains and most produce small ones.
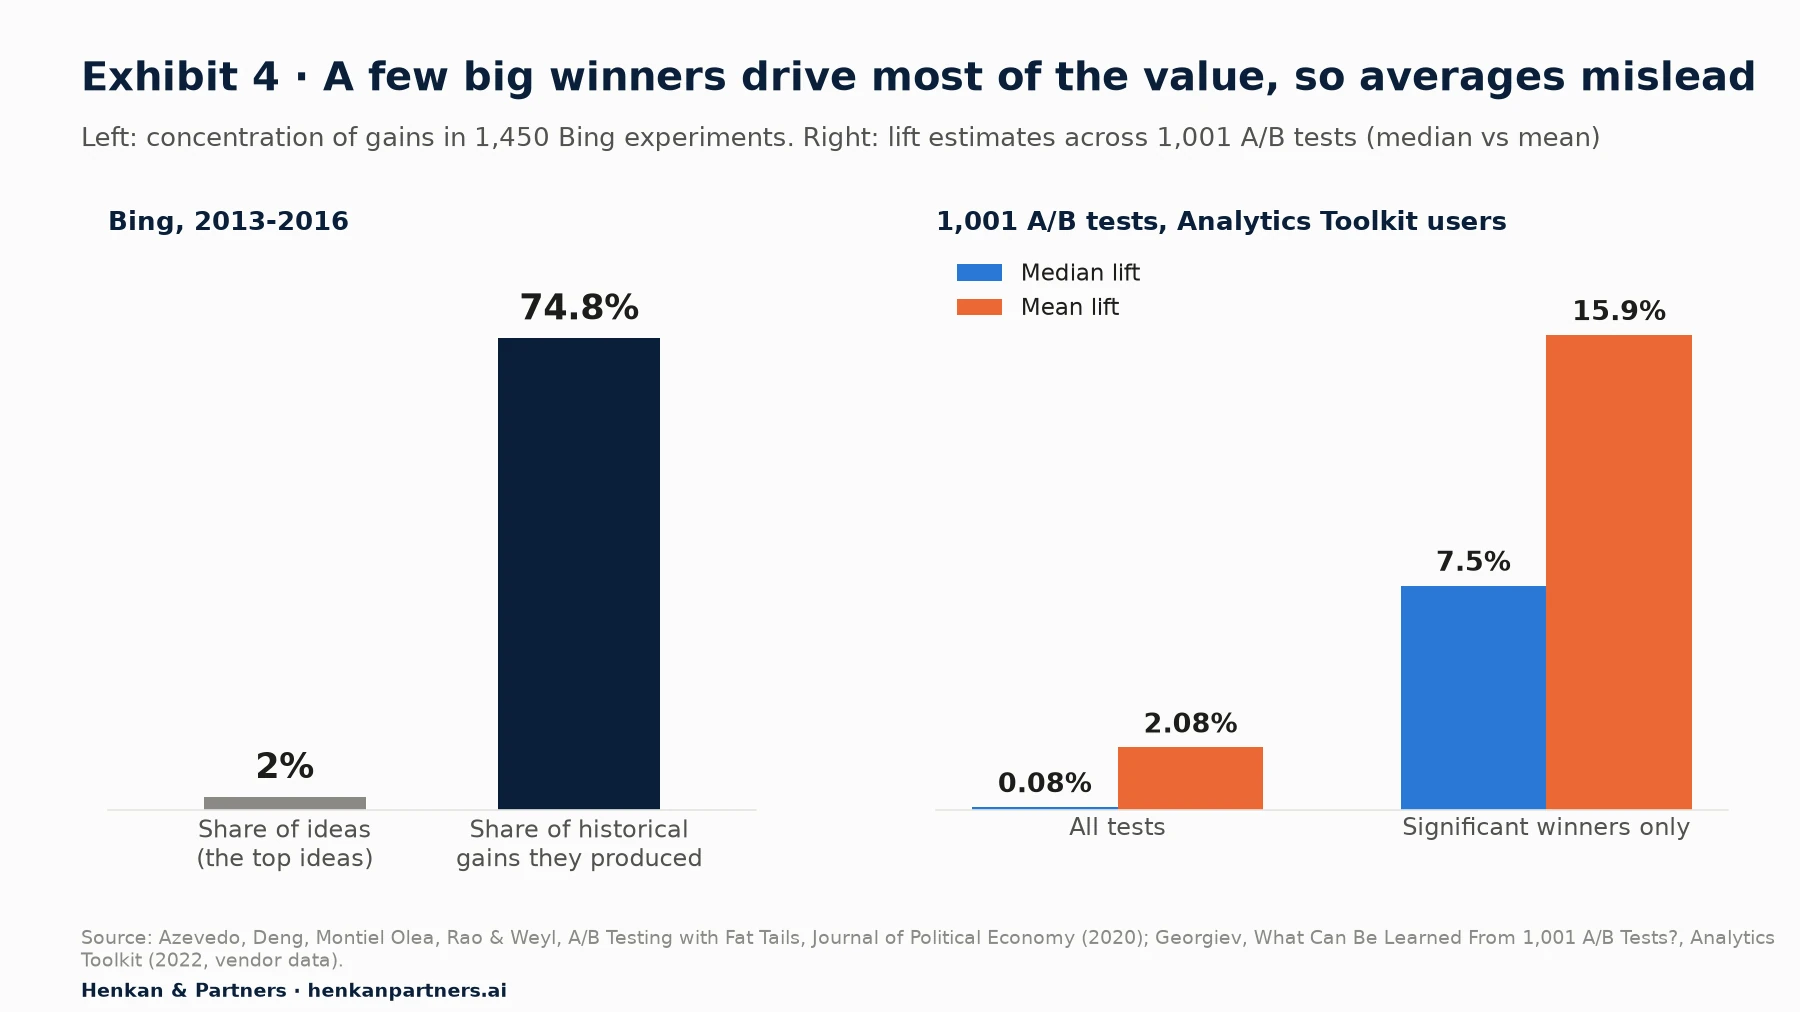
What this shows. Azevedo and colleagues found that the distribution of idea quality at Bing has fat tails, so a small number of ideas account for most of the value. In the Analytics Toolkit dataset, the typical test moved the metric by less than a tenth of a percent, and among winners the mean was pulled up by a few very large results. If you build a business case on the mean lift of past winners, you are implicitly assuming you will find the big ones again, at the same rate.
This has three implications for your model.
- Use the median, or a shrunk mean, for the typical win. The mean of past winners is inflated both by the tail and by the winner's curse (Section 7). Treat the occasional large win as upside in the strong scenario, not as the base case.
- Volume and breadth of ideas matter. Because big wins are rare and unpredictable, the paper recommends "lean" experimentation: many smaller tests rather than a few very large ones. In the authors' model, testing 20% more ideas with the same total traffic would raise productivity by about 17%.
- Vendor averages are portfolio averages. Optimizely reports that each revenue-focused experiment delivers an average incremental 0.4% lift in digital revenue "when results are applied, refined, and built upon", and that experiments with four variations deliver 3.5 times the expected impact of a typical A/B test (vendor data). Read these as averages across revenue-focused experiments in its customer base, calculated with the vendor's own methodology.
For leaders. Fat tails change how you judge a programme over a short period. A quarter without a big win is normal; a year without one is a signal that the ideas are too timid or too narrow. Ask to see the distribution of results, not only the total.
Section 6 · The ROI model
A programme ROI model multiplies a handful of drivers and subtracts four types of cost
The model below is the one we use in client business cases. It translates the value tree into arithmetic that a finance team can audit. It is deliberately simple: every input is a number you can look up, estimate from your own test history, or bracket with a range.
Annual value of wins = N × w × u × s × o × d × c × R × m

Annual value of losses avoided = N × l × h × p × c × R × m

Annual cost = tools + people + (N × build days × day rate) + design and QA + traffic cost of losing variants

ROI = (value − cost) ÷ cost        Payback = first month in which cumulative value ≥ cumulative cost

N = tests concluded per year        w = win rate        l = share of tests with a significant negative result
u = measured lift of a typical win on the exposed revenue        h = typical harm of a losing change
s = shrinkage factor for the winner's curse        o = overlap factor for tests that do not add up
d = share of the lift that survives novelty decay        c = share of online revenue exposed to tests
R = annual online revenue        m = contribution margin        p = chance the losing change would have shipped without a test

In year one, wins ship through the year and each gain erodes over time (half-life H), so realised value is lower than the annual run-rate.
Three choices in this formula matter more than they appear.
- Margin, not revenue. A 1% revenue lift is not worth 1% of revenue to the business. Multiply by contribution margin, after cost of goods, returns, payment fees and fulfilment. Our e-commerce market equation shows how much of each order these costs take before it earns anything.
- Revenue exposed, not total revenue. A test on the product page of one category only touches the revenue that flows through that page. If you run most tests on the checkout, exposure is high; if you test on low-traffic content pages, it is low. Estimate it from your analytics for the areas you plan to test.
- Durability. Gains do not last forever. Redesigns replace winning variants, competitors copy them, and customers adapt. We express this as a half-life: the time after which a shipped gain is worth half its settled value. Twelve months is our default; test your assumption against old winners you can still measure.
| Driver | Where to get it | Typical range to test |
|---|---|---|
| Tests per year (N) | Your test log, or capacity from traffic and minimum detectable effect | Median Optimizely customer: 34 a year (vendor data) |
| Win rate (w) | Your concluded tests; else published rates | 10% to 30% (Exhibit 3) |
| Measured lift of a typical win (u) | Median lift of your past winners on the exposed metric | Use the median, not the mean (Exhibit 4) |
| Shrinkage factor (s) | Replication tests, holdout reads, or a Bayesian shrinkage estimate | Keep 50% to 70% of measured lift (our assumption) |
| Overlap factor (o) | Holdout versus sum of individual effects | Keep 80% to 100% (our assumption) |
| Novelty decay (d) | Re-read winners weeks after launch; long-running holdout | Keep 60% to 85% (our assumption) |
| Revenue exposed (c) | Analytics: revenue through the pages and features you test | 20% to 40% for most retail programmes (our experience) |
| Contribution margin (m) | Finance | Varies widely by sector |
| Share negative (l), harm (h), chance it ships (p) | Your test log; interviews with product owners on what would have shipped | l around 20%; p 30% to 70% (our assumption) |
On the cost side, count everything the programme uses, including what is already on someone else's budget. The testing tool licence is usually the smallest line. People, development and design time dominate, and the traffic you expose to losing variants is a real, if modest, cost. Our A/B testing tool selection scorecard explains how to build a three-year total cost of ownership for the tool itself.
| Cost line | What to include | Common mistake |
|---|---|---|
| Tools | Testing platform, analytics add-ons, survey and session replay used for research | Counting only the testing licence |
| People | CRO lead, analysts, researchers, programme manager, at fully loaded cost | Leaving out part-time contributors from product and brand |
| Build | Front-end development, design and QA per test | Using the vendor's build estimate instead of your own |
| Traffic cost | Margin lost while customers see variants that turn out worse | Ignoring it, or counting the full test period instead of the losing share only |
Section 7 · Avoiding inflation
Four biases inflate the business case, and only a holdout group can measure the real total
The most common error in experimentation business cases is to add up the lifts of all winning tests and multiply by revenue. It feels rigorous because each lift came from a controlled experiment. It is not, for four reasons.
1. The winner's curse
When you ship only the tests that looked best, the ones that got lucky are over-represented. Etsy's engineers put it simply: "conditional upon being reported as a win, the observed lift is now expected to overestimate its true lift." Kohavi, Deng and Vermeer note that when statistical power is low, a significant result is likely to exaggerate the size of the effect considerably. Airbnb (Lee and Shen, KDD 2018) proposed a correction for this bias when estimating the total effect of launched features, and Etsy (2022) uses Bayesian shrinkage that discounts each lift according to its credibility rather than applying one fixed haircut. If you cannot run such a model, apply a fixed haircut and say so.
2. Novelty decay
Some lifts shrink after launch as the novelty wears off or customers adapt. Google's long-term studies measured a learning half-life of about 60 days for ads, and estimated that a 90-day experiment captures about 65% of the long-term learning effect. Not every change behaves like this, and early daily results are noisy, so do not read a trend into the first few days. The safe assumption is that the settled lift is somewhat lower than the test result.
3. Tests that do not add up
Ten winning tests with a 1% lift each rarely add up to 10%. Several changes often chase the same purchase, and some interfere with each other. Etsy's experimentation team, which runs quarterly holdouts, states that "the effect of the combined treatment is generally not equal to the sum of the individual effects." Our personalisation ROI deep dive covers the evidence on interaction effects, which are rarer than teams fear. Either way, treat the sum as an optimistic estimate to check, not a result.
4. Timing, erosion and margin
A win shipped in November contributes one month to this year, not twelve. Gains erode as the site changes around them. And revenue is not profit. These are not statistical biases, but they are the largest correction in most first-year business cases, as Exhibit 5 shows.
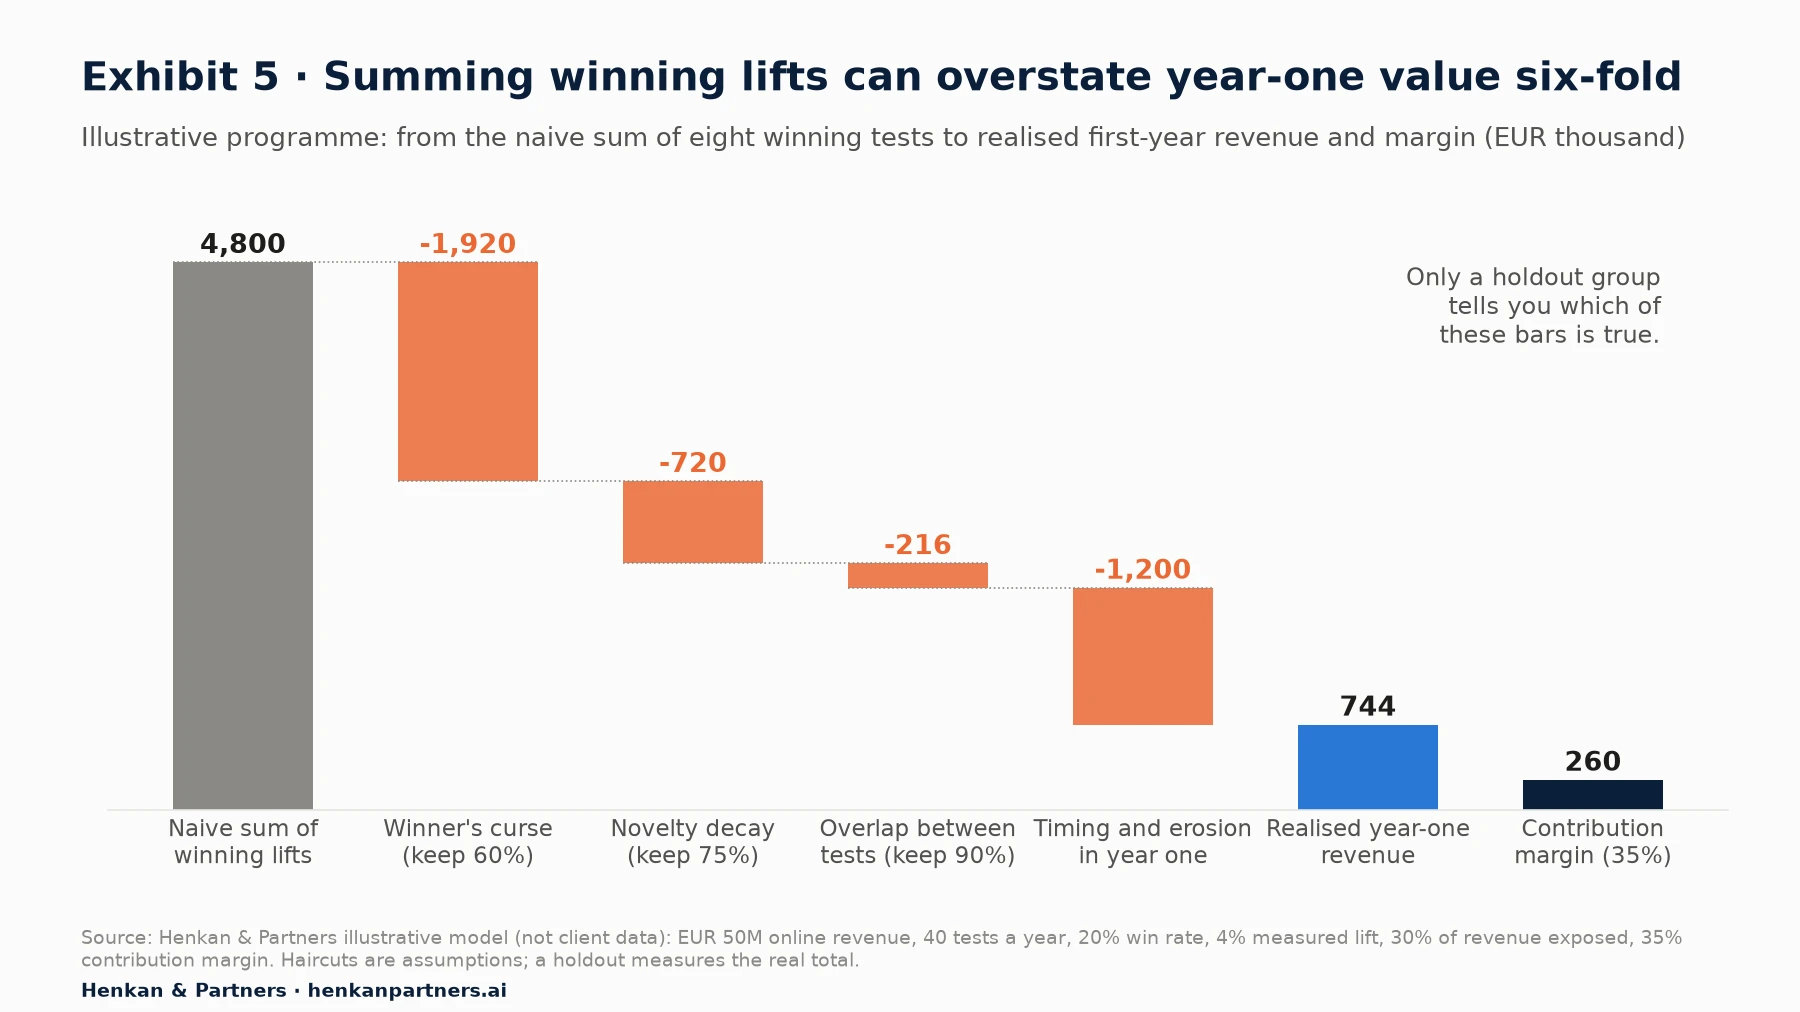
What this shows. Each haircut is an assumption, and yours may be smaller or larger. The point is that they compound. A business case that quotes the first bar will not survive the first quarterly review, and the programme's credibility goes with it. The realised figure is lower but defensible, and it still pays back in the base case (Section 8).
Measure the cumulative impact with a holdout group
A holdout (also called a holdback or universal holdout) is a small, random share of customers who do not receive any of the changes the programme ships for a set period. Comparing them with everyone else measures the combined, real effect of all shipped changes, after overlap, decay and the winner's curse. Etsy, for example, excludes about 8% of traffic each quarter from all experiments; at the end of the quarter it exposes half of that group to all adopted treatments for a few weeks and compares the two halves.
A holdout is the evidence that turns an ROI model into an ROI measurement. It has a cost (the held-out customers miss the improvements) and it needs enough traffic to detect a small combined effect, which is why vendor guidance mostly falls between 5% and 10% of traffic, and many teams reset it every quarter or half-year. The sizing arithmetic and vendor guidance are set out in our personalisation ROI deep dive; it applies equally to A/B testing programmes.
For marketers. Report two numbers each quarter: the model estimate built from individual tests after haircuts, and the holdout read. When they diverge, the holdout wins, and you recalibrate the haircuts.
For leaders. If a programme reports a cumulative uplift that is simply the sum of its winners, ask for the holdout. If there is no holdout, the number is an unverified estimate, and usually too high.
Section 8 · Worked example
In an illustrative worked example, a EUR 50 million retailer pays back its programme in about 11 months
The example below applies the model to a fictional online retailer. All inputs are illustrative, chosen to be plausible for a mid-sized European e-commerce business, and are not drawn from any client. Replace them with your own.
| Input | Base case value | Reasoning |
|---|---|---|
| Annual online revenue (R) | EUR 50 million | Illustrative mid-sized retailer |
| Tests concluded per year (N) | 40 | Slightly above Optimizely's median of 34 (vendor data) |
| Win rate (w) | 20% | Mid-point of the 10% to 30% range (Exhibit 3) |
| Measured lift of a typical win (u) | 4% on exposed revenue | More conservative than the 7.5% median lift of Analytics Toolkit winners (vendor data) |
| Shrinkage (s), overlap (o), novelty (d) | Keep 60%, 90%, 75% | Haircuts from Section 7 |
| Revenue exposed (c) | 30% | Tests concentrated on product pages, basket and checkout |
| Contribution margin (m) | 35% | After cost of goods, returns, payment and fulfilment |
| Losses: share (l), harm (h), chance it ships (p) | 20%, 1.5%, 50% | Conservative versus Microsoft's one-third negative |
| Half-life of a win (H) | 12 months | Site redesigns and adaptation |
With these inputs, each winning test is worth about EUR 85,000 a year in contribution margin once its gain has settled (4% × 60% × 90% × 75% × 30% × EUR 50 million × 35%). Each harmful change caught is worth about EUR 39,000 a year (1.5% × 50% × 30% × EUR 50 million × 35%). The programme produces eight winners and catches eight losers a year.
| Cost line | Annual cost (EUR) | Assumption |
|---|---|---|
| Tools | 60,000 | Testing platform and research tools |
| People | 135,000 | 1.5 full-time equivalents at EUR 90,000 fully loaded |
| Build | 96,000 | 40 tests × 4 developer days × EUR 600 a day |
| Design and QA | 30,000 | Shared design and QA time |
| Traffic cost of losing variants | 24,000 | Eight losing tests, half the exposed traffic for four weeks, 1.5% harm, at margin |
| Total | 345,000 |
Because winners ship throughout the year and take time to accumulate, first-year value is modest: about EUR 381,000 of contribution margin (EUR 260,000 from wins, EUR 120,000 from losses avoided) against EUR 345,000 of cost, a first-year ROI of about 10%. The programme pays back in month 11. In year two, the gains shipped in year one are still earning while new ones are added, so value rises to about EUR 929,000 and the return over 24 months reaches about 90%.
How confident should you be in that 90%? Exhibit 6 moves each input, one at a time, to the cautious and strong values used in the scenarios below.
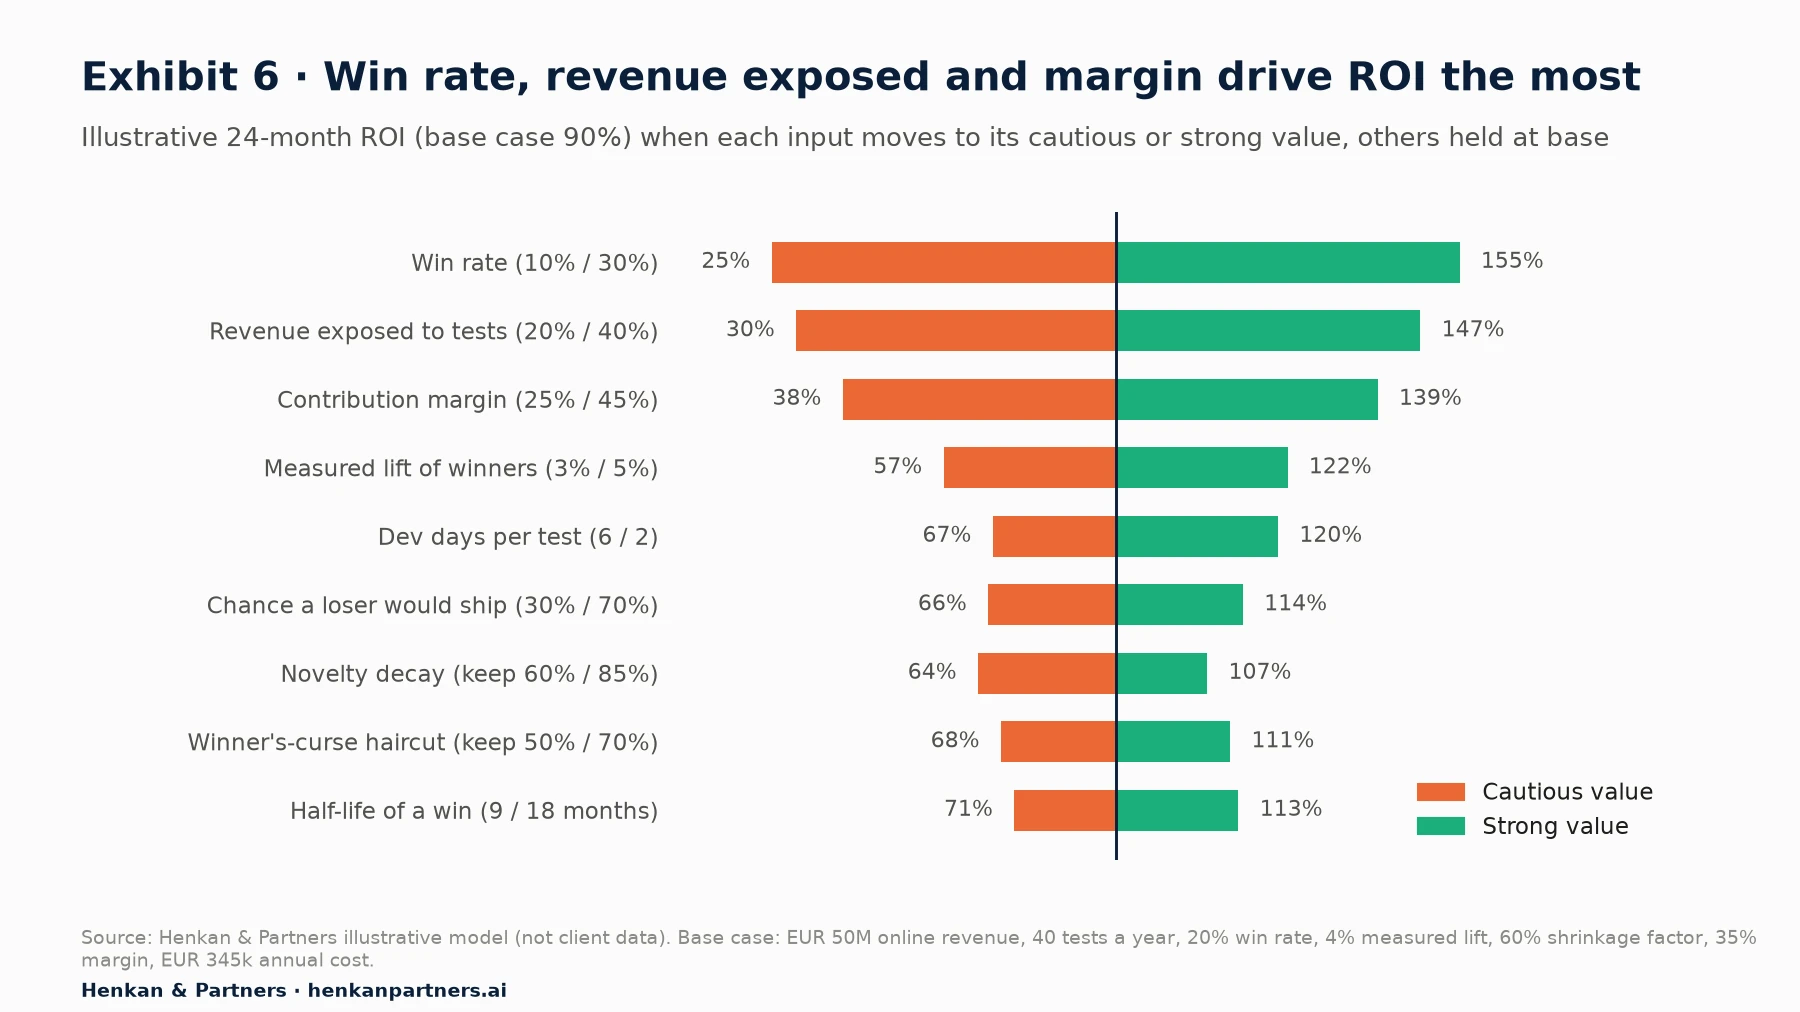
What this shows. Two of the three biggest levers are choices, not luck. The share of revenue exposed depends on where you test: a programme that tests on the checkout and product pages reaches more revenue than one testing on blog templates. The win rate depends largely on the quality of research behind each hypothesis. Margin is outside the programme's control, which is why it belongs in the conversation with finance from day one.
Our view. The worked example is intentionally unspectacular. A programme that returns 10% in its first year and 90% over two years, with a clear path to measure it, is a better investment case than one that promises ten times its cost and cannot show a holdout.
Section 9 · Presenting to a CFO
Present the ROI of A/B testing to a CFO as scenarios, a payback period and a measurement plan
Finance teams are used to evaluating uncertain investments. What they distrust is false precision. Present experimentation the way any other investment is presented: a range of outcomes, the assumptions behind each, the payback period, and how you will know which scenario is unfolding.
| Input or result | Cautious | Base | Strong |
|---|---|---|---|
| Win rate | 10% | 20% | 30% |
| Measured lift of a typical win | 3% | 4% | 5% |
| Keep after winner's curse / overlap / novelty | 50% / 80% / 60% | 60% / 90% / 75% | 70% / 100% / 85% |
| Chance a loser would ship; half-life of a win | 30%; 9 months | 50%; 12 months | 70%; 18 months |
| Year-one value (margin) | EUR 123,000 | EUR 381,000 | EUR 938,000 |
| Year-two value (margin) | EUR 280,000 | EUR 929,000 | EUR 2,481,000 |
| Annual cost | EUR 345,000 | EUR 345,000 | EUR 345,000 |
| 24-month ROI | -42% | 90% | 395% |
| Payback | Not within 24 months | Month 11 | Month 5 |
| Break-even online revenue (24 months) | About EUR 91 million | About EUR 25 million | About EUR 10 million |
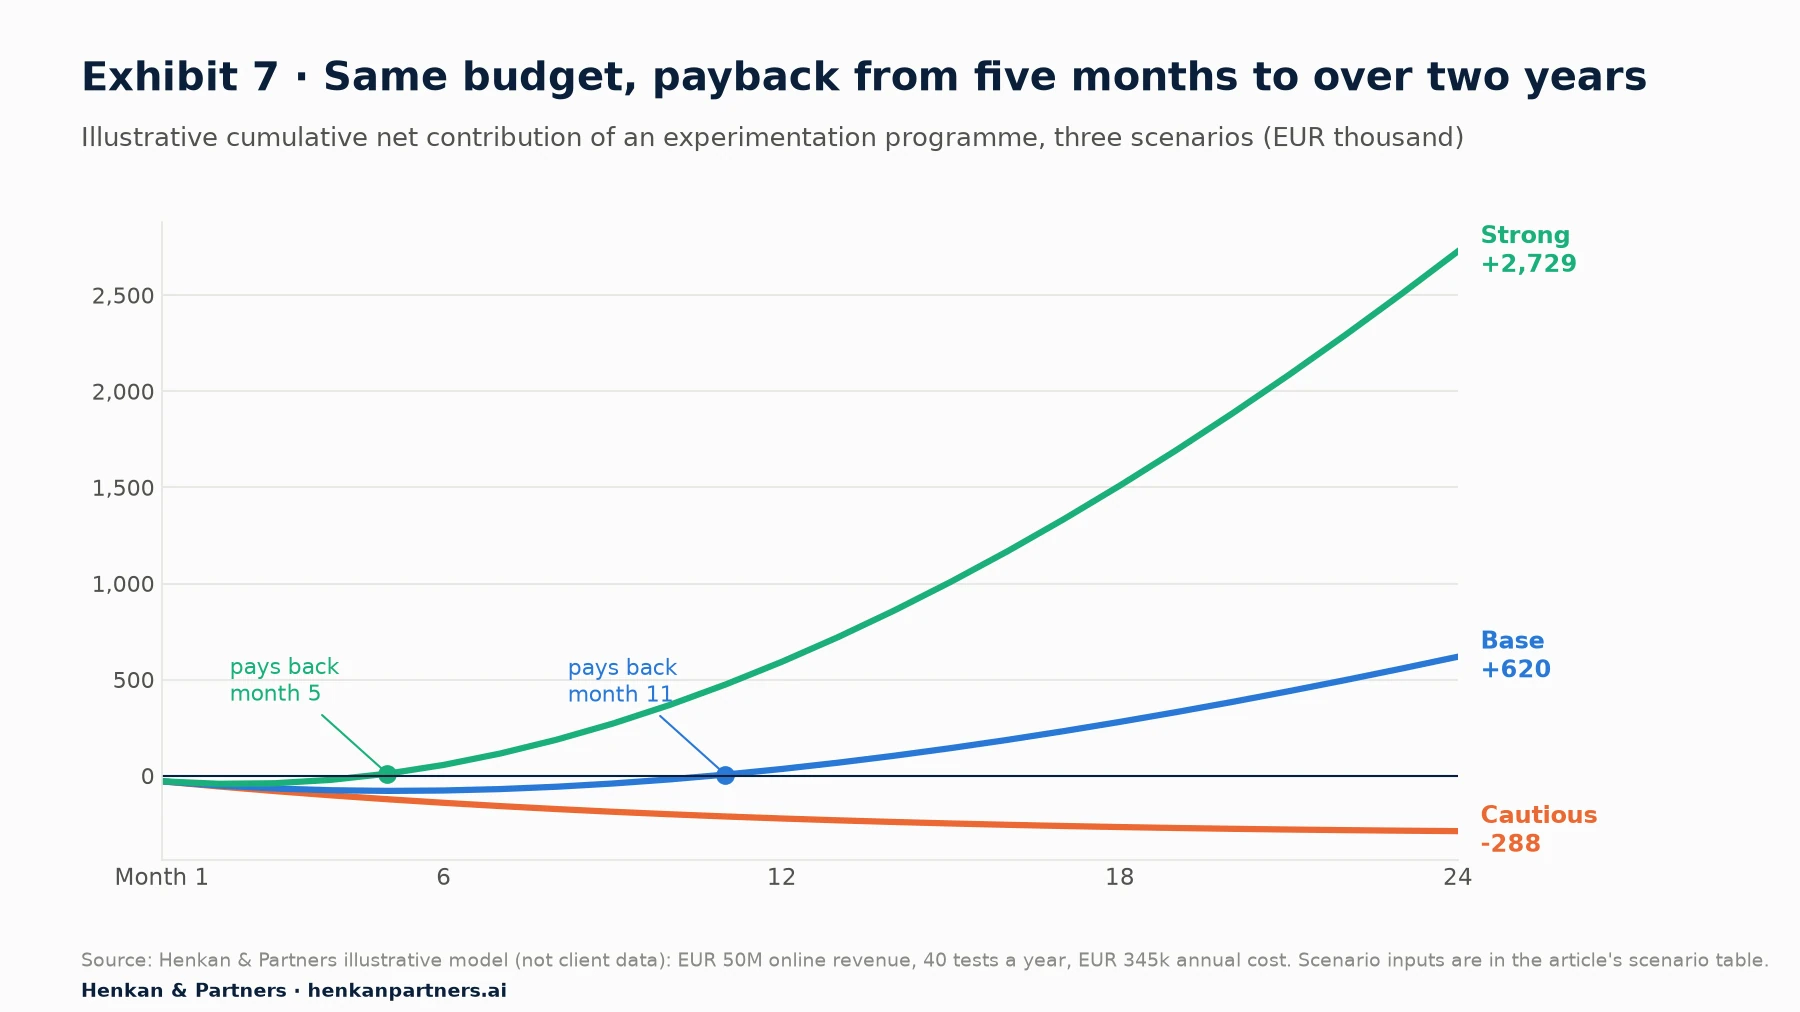
What this shows. The cautious line is the one to show first. It tells the CFO what happens if your ideas are weaker than hoped, and it reveals the real question: at this cost, the programme needs roughly EUR 25 million of online revenue to break even over two years in the base case, and far more in the cautious case. Smaller businesses can still test profitably, but with a leaner cost base or a narrower scope.
Five questions a CFO will ask, and how to answer them
- "Is this revenue or profit?" Profit. Show contribution margin throughout, and state the margin you used.
- "Why should I believe the uplift?" Because each input comes from your own test history or a sourced range, the winning lifts have been shrunk for the winner's curse, and a holdout will measure the real total within two or three quarters.
- "What if it does not work?" Show the cautious scenario and the stage gate: if the holdout read after two quarters is below the cautious line, you reduce scope or stop.
- "What does it cost in total?" Every cost line in Table 5, including people from other budgets and the traffic cost of losing variants.
- "Why not just ship the ideas?" Because at Microsoft a third of tested ideas had negative results, and losses avoided are part of the return. In our base case they are about a third of first-year value.
In our experience, stage-gated funding is the structure finance teams are most comfortable with. Fund two quarters, agree the metrics and the holdout design up front, and release the next tranche against the result. It also protects the programme: a team that has pre-agreed how it will be judged is not judged on the one quarter without a big win. Our memo on why prompt-based experimentation belongs on the C-level agenda explains how to report experimentation to an executive team in revenue terms.
For leaders. Ask for the break-even revenue base alongside the ROI. It tells you whether the programme is sized for the business, and it is a number finance can check without trusting any single test result.
Section 10 · Improving the return
Raise the return by testing bigger ideas on more revenue at lower cost, not by counting more tests
The sensitivity analysis points to where effort pays. It rarely points to the number of tests on its own.
Better ideas raise the win rate
The win rate is largely a function of research. Hypotheses grounded in analytics, customer feedback and session evidence win more often than ideas from a meeting room. Our guide to turning customer insights into a test backlog shows how to build that pipeline. Remember the fat tails: some bolder ideas are needed to find the rare large wins.
Test where the revenue is
A programme that spends half its capacity on low-traffic pages caps its own return. Map revenue by page type and feature, then direct most tests to the areas that carry the most revenue and have enough traffic to detect realistic effects.
Lower the cost per test
Build time is often the largest variable cost. AI-assisted test building is changing this: Kameleoon, for example, reports a 97% reduction in test creation time across more than 1,000 prompt-based experiments, calculated against an assumed three developer days per test (vendor data). Treat such figures as vendor claims to verify in a pilot on your own site. The same logic applies to tools: a platform that is cheaper to licence but slower to build on can lower the return.
Use AI to speed up analysis, but watch the false positives
AI assistants and agents connected to your testing tool and analytics, for example through the Model Context Protocol (MCP), can now pull test histories, compute win rates and median lifts, and refresh the ROI model in minutes. That makes the business case easier to maintain. It also creates two risks. First, cheaper tests invite more low-quality tests, and with a low true win rate, more of the "wins" are false (Table 1). Second, an agent summarising results will happily add up lifts unless you tell it not to. Keep the haircuts and the holdout in the process, and keep a human accountable for the numbers presented to finance.
Volume only helps within guardrails. The Experimentation Manifesto argues that high-impact initiatives beat numerous disconnected tests because learning compounds only when tests build on each other, and that argument is also an ROI argument.
Section 11 · Next steps
What to do next
1. Pull your test history this week
List every concluded test from the last 12 to 24 months with its result, lift, confidence interval and the area of the site it touched. Compute your own win rate, the share of negative results and the median lift of winners. If fewer than 30 tests are available, use the published ranges.
2. Fill in the model with finance
Agree revenue exposed, contribution margin and fully loaded costs with your finance partner before you show any result. Numbers they helped choose are numbers they will defend.
3. Build three scenarios and a break-even
Produce cautious, base and strong cases, the payback month for each, and the break-even revenue base. Lead with the cautious case.
4. Start a holdout
Set up a programme-level holdout of 5% to 10% of traffic, reset each quarter or half-year, so that within two or three quarters you can replace the model estimate with a measurement.
5. Ask for stage-gated funding
Request two quarters of funding against pre-agreed metrics, and report the model estimate and the holdout read side by side at each gate. If you would like an independent view of your model or help setting up the holdout, talk to us.
FAQ
Frequently asked questions about experimentation ROI
Frequently asked questions
What is experimentation ROI?
Experimentation ROI is the incremental profit an experimentation or A/B testing programme creates over a period, minus its full cost, divided by that cost. It includes the value of winning changes shipped, the value of harmful changes stopped, and, where evidenced, faster and better decisions.
How do you calculate the ROI of A/B testing?
Multiply tests per year by win rate, the true uplift of a typical win, the share of revenue exposed, durability and contribution margin; add the value of losses avoided; subtract tools, people, build time and the traffic cost of losing variants; and divide by cost. Shrink measured lifts for the winner's curse and novelty decay, and confirm the total with a holdout.
What is a good win rate for A/B tests?
Published win rates range from about 8% (Airbnb Search) to 33% (Microsoft). Booking.com, Google Ads and Netflix report around 10%, and Optimizely reports 12% across 127,000 experiments (vendor data). In our experience, a win rate far above a third more often signals underpowered tests or loose criteria than exceptional ideas.
Can you add up the uplifts of winning tests?
No. Summed uplifts overstate impact because of the winner's curse, novelty decay, overlap between tests, timing and the difference between revenue and margin. Treat the sum as an optimistic estimate and measure the real cumulative effect with a holdout group.
What is a holdout group in experimentation?
A holdout is a small random share of users, typically 5% to 10%, who do not receive any of the changes a programme ships for a set period. Comparing them with everyone else measures the combined effect of all shipped changes. Etsy, for example, holds out about 8% of traffic each quarter.
How long does an experimentation programme take to pay back?
It depends on revenue, win rate, uplift and cost. In our illustrative model of a EUR 50 million online retailer spending EUR 345,000 a year, payback ranges from five months in a strong scenario to more than two years in a cautious one, with month 11 in the base case.
What costs should be included in experimentation ROI?
Tool licences, people at fully loaded cost, development, design and QA time per test, and the margin lost while customers see variants that turn out worse. People and build time are usually far larger than the tool licence.
Is experimentation worth it for smaller e-commerce sites?
It can be, but the fixed costs of a programme need enough revenue to pay them back. In our illustrative base case the break-even is about EUR 25 million of online revenue over two years. Smaller sites can improve the return by testing fewer, bigger ideas on high-revenue pages with a leaner team.
How do you present experimentation ROI to a CFO?
Show contribution margin rather than revenue, three scenarios with their assumptions, the payback period and the break-even revenue base, and a holdout-based measurement plan. Ask for stage-gated funding against pre-agreed metrics.
Key terms
- Experimentation ROI
- The incremental profit of an experimentation programme minus its full cost, divided by that cost. It matters because it is the number that decides whether the programme is funded.
- Win rate
- The share of experiments that significantly improve their target metric. It matters because it is the most influential input to the ROI model and the most often overstated.
- Losses avoided
- The margin protected by not shipping changes that tests showed to be harmful. It matters because it is a large, often uncounted part of a programme's value.
- Winner's curse
- The tendency of the measured lift of tests selected as winners to overstate their true lift. It matters because summing measured lifts inflates the business case.
- Shrinkage
- A statistical correction that pulls each measured effect towards zero according to its credibility. It matters because it gives a more realistic estimate of what a winning change will deliver.
- Novelty effect
- A temporary lift that appears because a change is new and fades as users get used to it. It matters because it makes short tests overstate long-term value.
- Holdout group
- A random share of users kept away from all shipped changes for a period to measure their combined effect. It matters because it is the only direct measure of a programme's cumulative impact.
- False positive risk
- The probability that a statistically significant result is not a real effect. It matters because it rises sharply when true win rates are low.
- Fat tails
- A distribution in which rare, very large outcomes account for a big share of the total. It matters because averages of past winners are poor predictors of the typical future win.
- Revenue exposed
- The share of total revenue that flows through the pages or features a programme tests. It matters because it caps how much any lift can be worth.
- Contribution margin
- Revenue minus variable costs such as goods, returns, payment and fulfilment. It matters because ROI should be measured in profit, not revenue.
- Payback period
- The time until cumulative value equals cumulative cost. It matters because finance teams compare investments on how quickly they return cash.
- Break-even revenue base
- The online revenue at which a programme's value equals its cost over a period. It matters because it shows whether the programme is sized for the business.
Sources
All sources were checked in September 2026. Optimizely and Analytics Toolkit figures are vendor data from their own customer or user bases, and Kameleoon figures are vendor claims; Speero figures are agency data from a maturity benchmark. Microsoft, Bing, Amazon and Google figures are those companies' own published estimates. Exhibit 1 and Tables 2 and 3 are Henkan & Partners frameworks. Exhibits 5, 6 and 7 and Tables 4 to 6 come from a Henkan & Partners illustrative model with fictional inputs, not client data.
- Kohavi, R. & Thomke, S., Harvard Business Review (2017). The Surprising Power of Online Experiments.
- Kohavi, R., Deng, A. & Vermeer, L. (2022). A/B Testing Intuition Busters. KDD 2022.
- Kohavi, R., Tang, D. & Xu, Y. (2020). Trustworthy Online Controlled Experiments, chapter 1 excerpt. Cambridge University Press.
- Fabijan, A., Dmitriev, P., Olsson, H. H. & Bosch, J. (2017). The Benefits of Controlled Experimentation at Scale. SEAA 2017, Microsoft.
- Thomke, S., Harvard Business Review (2020). Building a Culture of Experimentation.
- Rydberg, J., Confidence by Spotify (2026). The Real ROI of Experimentation.
- Optimizely (n.d.). Top 10 takeaways from running 127,000 experiments (vendor data).
- Georgiev, G., Analytics Toolkit (2022). What Can Be Learned From 1,001 A/B Tests? (vendor data).
- Azevedo, E. M., Deng, A., Montiel Olea, J. L., Rao, J. & Weyl, E. G. (2020). A/B Testing with Fat Tails. Journal of Political Economy 128(12) · author PDF.
- Hohnhold, H., O'Brien, D. & Tang, D. (2015). Focusing on the Long-term: It's Good for Users and Business. KDD 2015, Google.
- Lee, M. & Shen, M. (2018). Winner's Curse: Bias Estimation for Total Effects of Features in Online Controlled Experiments. KDD 2018, Airbnb.
- Shao, S., Etsy Engineering (2022). Mitigating the winner's curse in online experiments.
- Shao, S. & Burke, C., Etsy Engineering (2022). Understanding the collective impact of experiments.
- Speero (2025). Experimentation Maturity Benchmark Report 2025, Methods & Process (agency data).
- De Todaro, F., Kameleoon (2025). What we learned from 1,000 prompt-based experiments (vendor data).
- Henkan & Partners. Illustrative programme ROI model (monthly simulation over 24 months; inputs in Tables 4 to 6).