Focus
How to Choose an A/B Testing Tool and the Rest of Your Optimisation Stack: A Vendor-Neutral Selection Scorecard
Alexandre Suon · 2026-09-29
Choosing an A/B testing tool, or any analytics, personalisation or Voice of Customer platform, is less about features than about fit: your use cases, your team's capacity and the three-year cost of making the tool work. This buyer's guide to A/B testing tool selection gives you a vendor-neutral process, a weighted scorecard with criteria for each tool family, and the red flags to catch in demos and contracts before you sign.
Executive summary
- The tools are not the bottleneck; the capacity to use them is. Gartner found marketers used 33% of their martech stack's capabilities in 2023, down from 58% in 2020, and, as reported by TechRepublic, 60% of software buyers in a 2023 Gartner Digital Markets survey regretted a purchase made in the previous 12 to 18 months. Start every selection from use cases and team capacity, not from a feature list.
- Run a structured process that ends in evidence, not in a demo. Seven steps over roughly 12 weeks: needs, longlist, RFP, scripted demo, proof of concept with an A/A test and one real test, reference calls, then negotiation. The proof of concept is the step most buyers skip and the one that prevents most regret.
- Use a weighted scorecard, with privacy and security as pass/fail gates. Ten criteria cover capabilities, statistics, implementation and page speed, data integration and portability, AI, privacy, security, usability, support and cost. When totals are within about five points, treat it as a tie and let the proof of concept decide.
- Price the three-year total cost of ownership, not the licence. Vendors bill on events, users, sessions, seats or custom contracts, so quotes are only comparable on your own volumes. People and implementation usually cost more than the licence; Avinash Kaushik's old 10/90 rule put the tool at $10 for every $90 spent on analysts.
- Negotiate the exit before you sign. Google Optimize was switched off on 30 September 2023, and the market has since consolidated fast (OpenAI bought Statsig, Datadog bought Eppo, VWO and AB Tasty now trade as Wingify). The EU Data Act removes switching and data egress charges for data processing services from 12 January 2027; write data export, notice periods and transition help into the contract anyway.
- Weight the criteria by maturity. Early teams should buy ease of use and support; advanced teams should buy statistical rigour, warehouse integration and control. Consolidate into a suite where data must be shared across tools; stay best-of-breed where one capability is a competitive advantage.
Section 1 · The real problem
Optimisation tools are now commodities, so the constraint is your capacity to use them
A/B testing tool selection is the structured process of choosing an experimentation platform, and by extension the analytics, personalisation and Voice of Customer (VoC) tools around it, by scoring shortlisted vendors against weighted criteria that reflect your use cases, team capacity, data architecture, privacy constraints and three-year total cost of ownership, and confirming the choice with a proof of concept on your own site.
Twenty years ago, choosing a testing or analytics tool was a technical bet: few products existed and they did very different things. Today the problem is the opposite. Scott Brinker's 2025 Marketing Technology Landscape counts 15,384 solutions, up from 150 in the first edition in 2011. Almost every serious A/B testing, analytics, personalisation and VoC product can run a test, build a funnel, target a segment or send a survey. The demo will look good whichever vendor you invite.
What separates a good choice from a bad one is whether your team will actually use the tool, to the depth you are paying for, three years from now. The evidence says most teams do not. Gartner's marketing technology surveys found that marketers used 58% of their stack's capabilities in 2020, 42% in 2022 and just 33% in 2023 (a survey of 405 marketing leaders). Gartner named the complexity of the stack, customer data challenges and inflexible governance as the main barriers, not missing features.
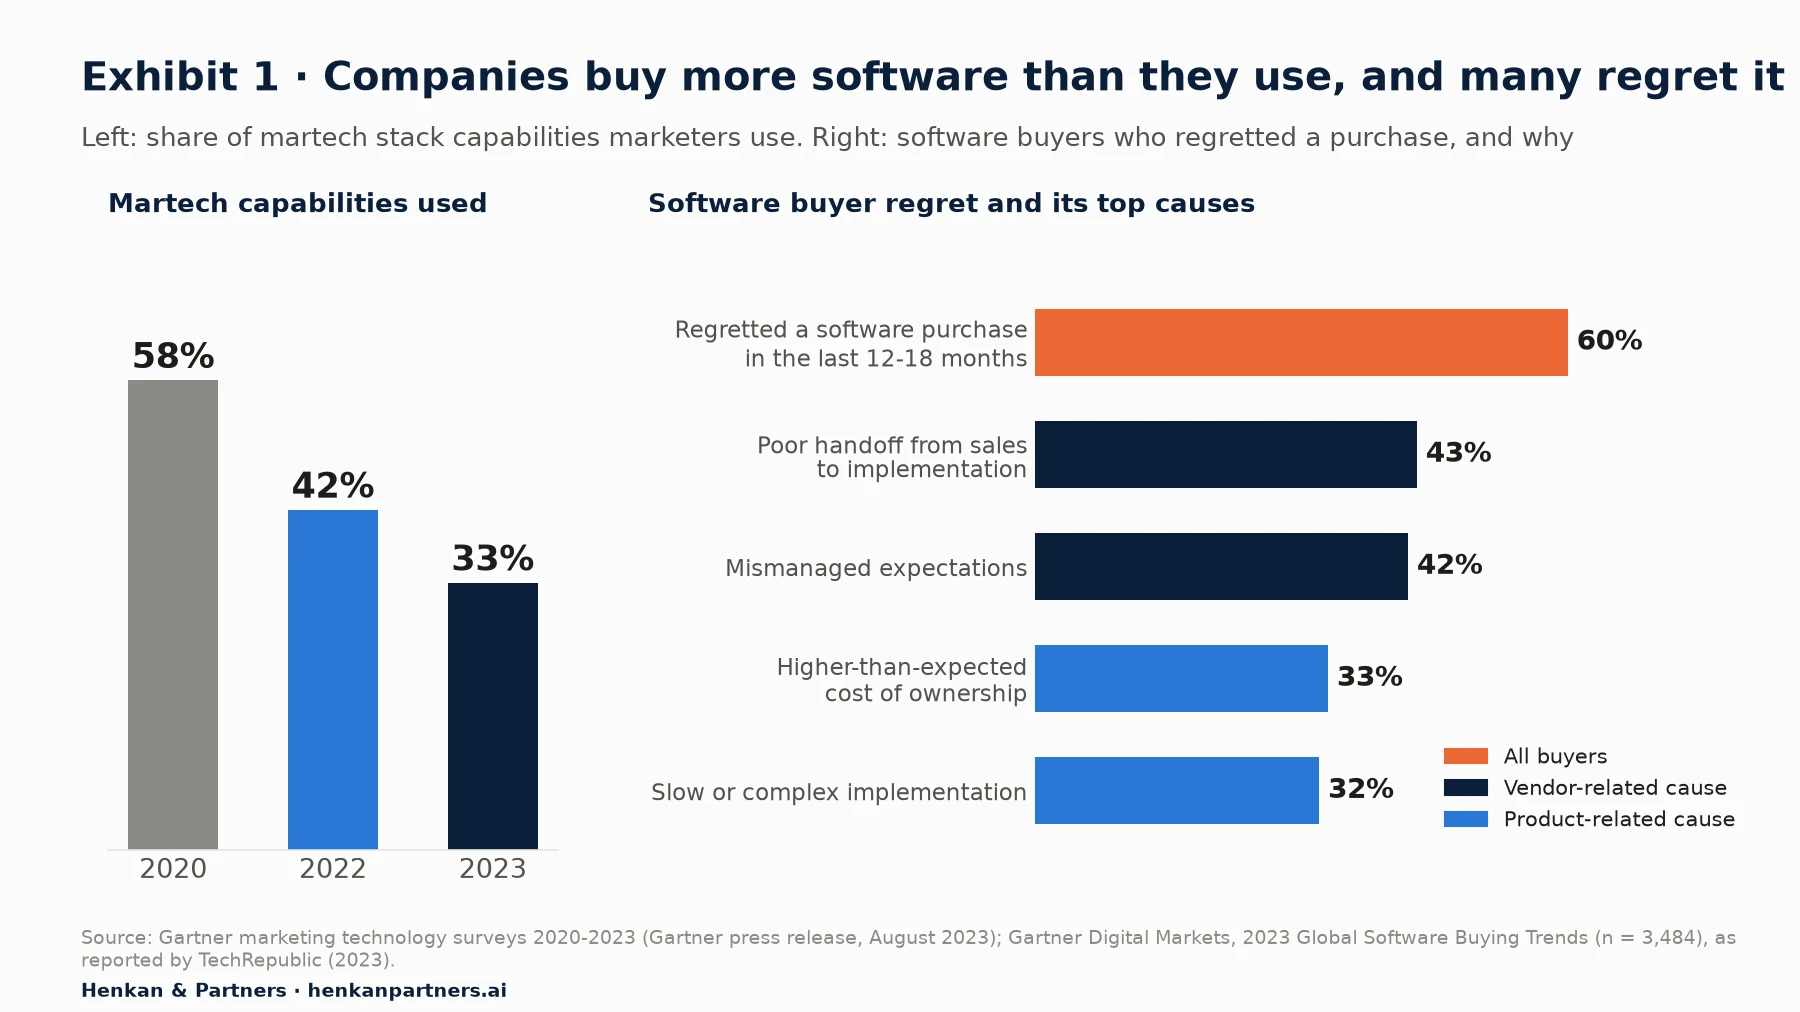
What this shows. Buying the tool is the easy part. Regret comes from what happens after the contract: implementation that takes longer than promised, a sales team that promised more than delivery can give, and a total cost that grows beyond the licence. According to TechRepublic's report of the study, Gartner Digital Markets surveyed 3,484 software buyers in nine countries; 24% of those who regretted a purchase cancelled the contract and 33% switched vendor. A selection process should be designed to prevent exactly these failures.
This is the point we make to our own clients: web analytics, A/B testing and personalisation tools have become commodities, and everyone has them, but few teams have the time to use them well. The tool matters. The operating model around it matters more. As Avinash Kaushik put it in his 10/90 rule for web analytics in 2006, for every $10 spent on tools and vendor services you need to invest $90 in the people who turn data into decisions.
Disclosure: Henkan & Partners is a Kameleoon Platinum partner and works with many other analytics, experimentation, personalisation and VoC vendors. This scorecard is vendor-neutral and names no winner. Vendor facts quoted in this article come from each vendor's own public pages and are labelled as vendor data.
Section 2 · Use cases first
Start from use cases and team capacity, not from feature lists
A feature checklist is the most common starting point and the least useful. Every vendor ticks every box, because the checklist was written from the vendors' own marketing. The result is a spreadsheet of 150 rows where everyone scores 90%, and a decision that ends up being made on the demo's charm or the price.
Start instead from two questions: what decisions do you need to make in the next three years, and who will do the work?
Write use cases as decisions and jobs, not as features
A use case describes a job someone needs to do, with a frequency and an owner. "Visual editor" is a feature. "Our two CRO specialists launch four to six client-side tests a month on product and checkout pages without a developer, and QA them on Safari and Chrome" is a use case. The second version tells you what to test in the demo, what skills the tool must fit, and what volume to price.
Aim for 10 to 20 use cases across the tool families you are buying. Typical examples:
- Analytics: reconcile online orders with the back office every week; build a checkout funnel by device and traffic source in under ten minutes; export raw events to the data warehouse daily.
- Experimentation: run client-side tests on templates the marketing team controls; run server-side tests on pricing, search ranking or delivery promises; roll out features behind flags with an automatic rollback when a guardrail metric degrades.
- Personalisation: show different home-page content to new and returning visitors; recommend products on the product page; measure every campaign against a holdout group.
- Voice of Customer: trigger a short survey after checkout; tag and summarise thousands of open-text answers each month; link survey answers to behaviour and to test results.
Size the team that will run the tool before you size the tool
The same product is a good choice for one team and a poor one for another. A developer-first, warehouse-native experimentation platform is excellent if you have data engineers and analysts who write SQL. It is a costly mistake if your programme is two marketers and an agency. Before you look at vendors, write down how many people will use the tool, how many hours a week, with which skills, and who will own implementation and QA.
| Question | Why it matters for selection | What to write down |
|---|---|---|
| Who will build tests or campaigns? | Decides between visual editors, code editors, SDKs and AI-assisted building | Roles, skills, hours per week |
| Who will analyse results? | Decides how much statistical control and data access you need | Analysts, SQL skills, stats literacy |
| Where does your data live? | Decides whether warehouse-native analysis is an advantage or a burden | Warehouse, CDP, analytics tool of record |
| How much traffic do you have? | Decides how many tests a year you can run and which pricing model suits you | Monthly users, sessions, events by site and app |
| Who owns consent and privacy? | Decides which gates a vendor must pass | DPO, legal, consent platform |
| What is the budget ceiling, including people? | Stops a selection from ending on an unaffordable winner | Three-year budget, internal and external |
If you are unsure how the markets you are buying into evolved, our market reports give the background: the A/B testing tool market, the digital analytics market, the personalisation market and the Voice of Customer market. They explain why some vendors are strong in one family and thin in others.
For marketers. Write use cases in your own words and bring them to every demo. If a vendor cannot show your use case on a realistic page, that is your answer.
For leaders. Ask for the capacity plan before the vendor shortlist. A tool the team cannot operate is a licence you pay for twice: once in fees and once in lost time.
Section 3 · The process
A seven-step selection process turns a beauty contest into evidence
A good selection takes about 12 weeks for a mid-size e-commerce company and less for a single, simple tool. It is not bureaucracy. Each step exists to remove one specific cause of regret, from mismanaged expectations to hidden implementation costs.
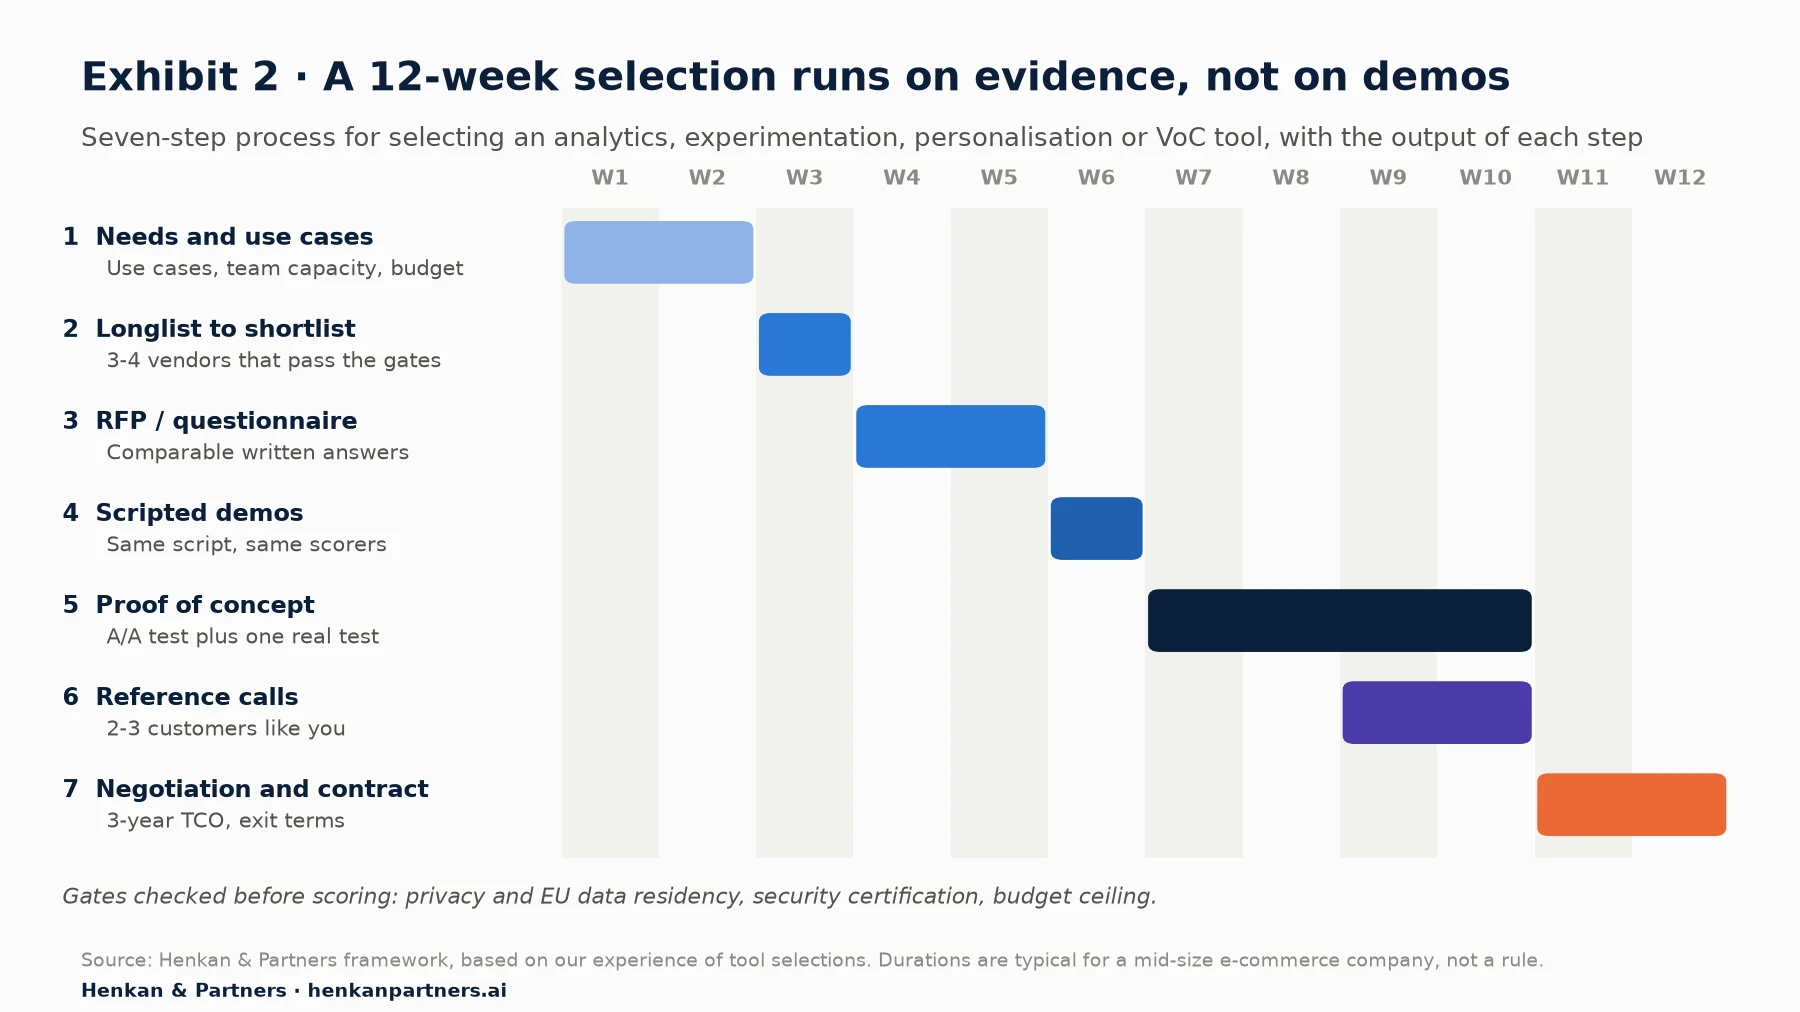
What this shows. The proof of concept takes the most time, and it should. It is the only step where you see the tool working on your own site, with your own data and your own team. Reference calls run in parallel with it so that you can ask customers about the problems the proof of concept reveals.
Step 1: define needs, use cases and gates
Turn your use cases into a requirements document of two to four pages, not a 300-line spreadsheet. Add your gates: the conditions a vendor must meet to be considered at all. Typical gates are data processing in the EU or under a valid transfer mechanism, a current security certification, support for your consent management platform and a budget ceiling.
Step 2: build a longlist, then cut it to three or four
Start with eight to twelve vendors from analyst reports, peer recommendations and our market reports, then cut to three or four using the gates and a quick desk review. More than four finalists makes the rest of the process too slow to run well.
Step 3: send a short RFP that asks for evidence
A request for proposal (RFP) should ask how, not whether. "Do you support server-side testing?" gets a yes from everyone. "Show how a server-side test is set up in a Node.js application, and what a developer must change" gets an answer you can compare. Ask for a pricing proposal on your own volumes, the security documentation, the data processing agreement and the list of sub-processors.
Step 4: run scripted demos, not vendor showreels
Give every vendor the same script, built from your use cases, a week in advance. Ask them to show it on a page similar to yours, and have the same three or four people score every demo against the same criteria. Keep the last 15 minutes for the questions the sales team does not want: what customers complain about, what is on the roadmap but not built, and who will support you after signature.
Step 5: run a proof of concept with an A/A test and one real test
The proof of concept (PoC) is where selections are won or lost. For an experimentation tool, install it on your site, run an A/A test (two identical variants, which should show no significant difference and a balanced split), then run one real, low-risk A/B test end to end. Measure page speed before and after, check the split for sample ratio mismatch, reconcile conversions with your analytics tool and time how long your team takes to build and QA the test. For analytics, personalisation and VoC tools, use the same logic: one real dashboard, one real campaign, one real survey, built by your own people.
Ask for a free or paid PoC of four to six weeks with a named vendor engineer. A vendor that refuses any hands-on trial for a six-figure contract is telling you something about the support you will receive later.
Step 6: call references that look like you
Ask for two or three references of a similar size, industry and technical set-up, and ideally one customer who left. Ask what took longer than planned, what the real cost was after year one, how support responded to an incident, and what they would negotiate differently.
Step 7: negotiate on three-year cost and exit terms
Negotiate on the three-year total cost, not the first-year discount. Section 7 covers pricing models, total cost of ownership and exit terms in detail, and Section 8 lists the contract clauses that most often cause problems.
Section 4 · The scorecard
A weighted scorecard forces trade-offs into the open
A weighted scorecard is a simple tool: a list of criteria, a weight for each that reflects what matters to you, a score for each vendor on each criterion, and a weighted total. Its value is not the final number. It is the discussion it forces before the demos, when the team has to agree what matters most and write it down.
What buyers say they value is a useful starting point. In the 2024 MarTech Replacement Survey, teams that had replaced a marketing technology application in the previous year rated cost, integration and customer experience highest when choosing the replacement.
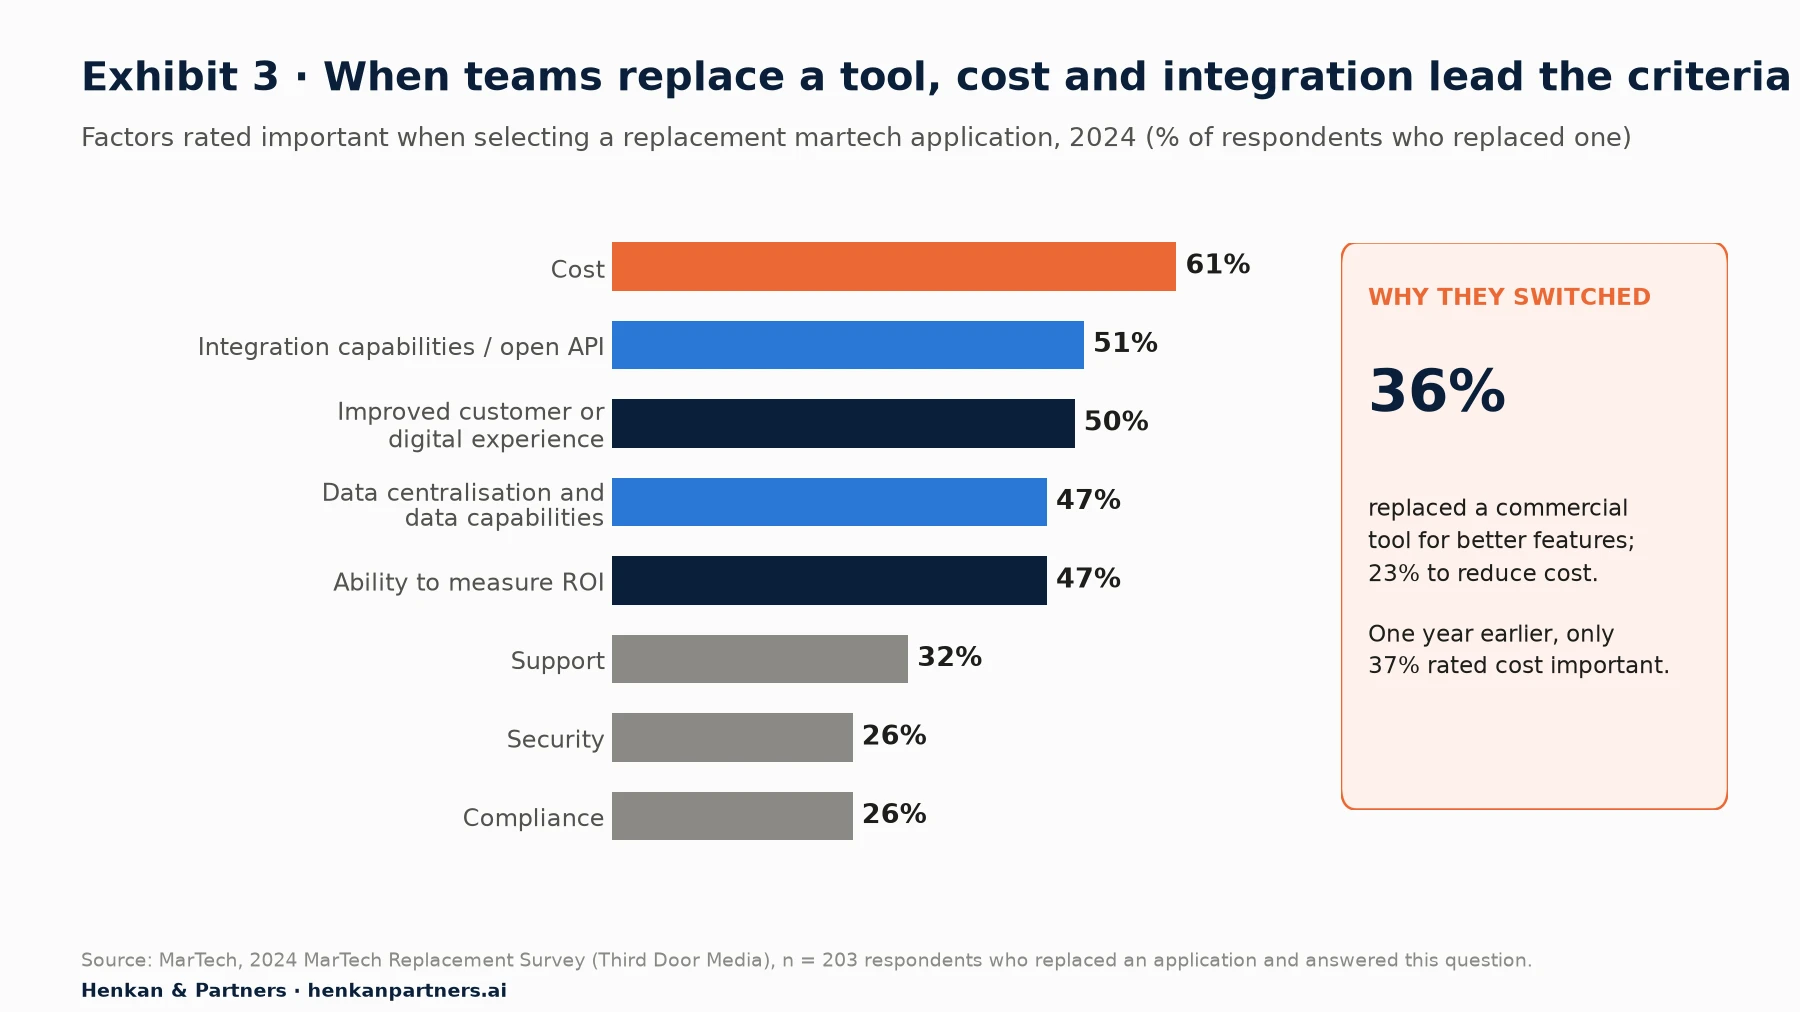
What this shows. Cost jumped from 37% to 61% in a year. Integration and data centralisation rank almost as high, which matches what we see: the tool that fits the data architecture is used, and the one that does not becomes shelfware. Security and compliance score low here; in our experience that is often because buyers treat them as pass/fail conditions rather than as factors to trade off, which is how we recommend treating them.
Use ten criteria and agree the weights before the first demo
Our scorecard uses ten criteria. Weights add up to 100, and each vendor is scored from 0 to 5 on each criterion. Anchor the scores in advance so that different scorers mean the same thing: 0 means the capability is absent, 3 means it meets the use case with workarounds, and 5 means it meets the use case fully, as shown in the PoC.
Weighted score (out of 100) = Σ (weight of criterion × score from 0 to 5) ÷ 5

Example: a criterion weighted 15% where a vendor scores 4 contributes 15 × 4 ÷ 5 = 12 points.
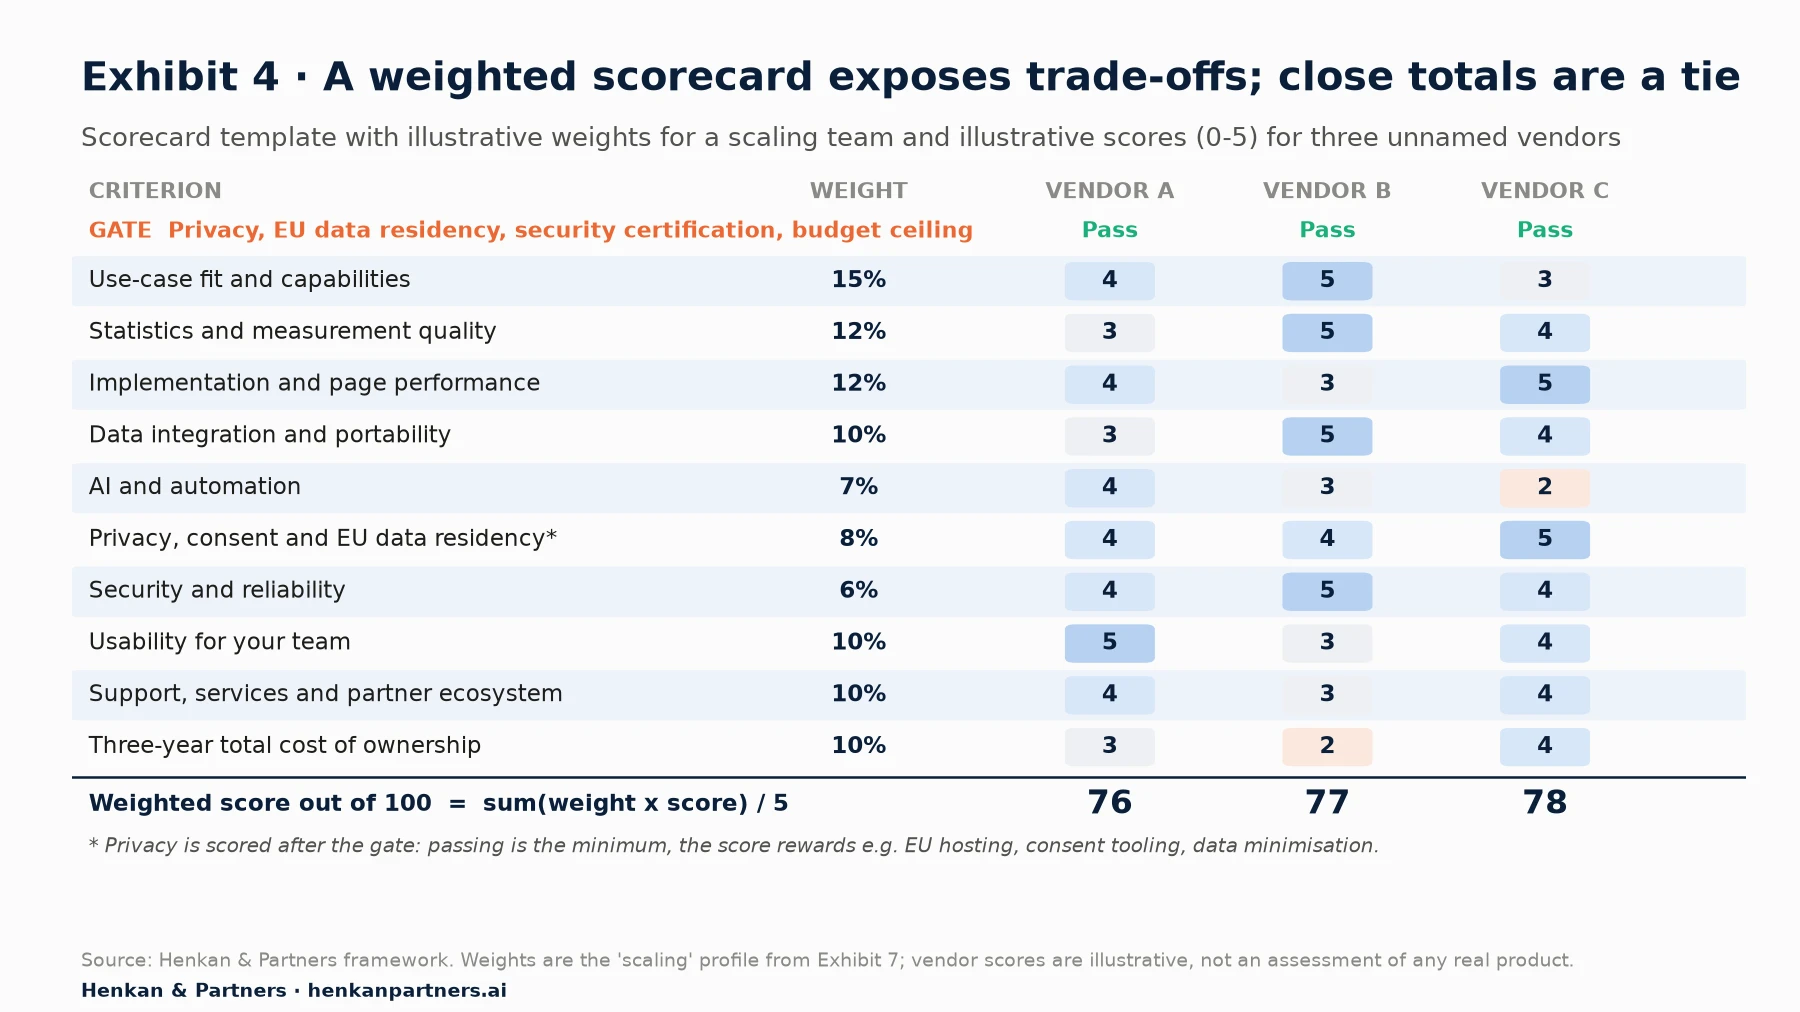
What this shows. The three illustrative vendors have very different profiles: B is strongest on statistics and data, A on usability, C on implementation and cost. Yet the totals land within two points of each other. That is normal, and it is the most important lesson of any scorecard: a difference of a few points is noise in the scoring, not a real preference. When totals are within about five points, treat the result as a tie and let the proof of concept and reference calls decide.
Keep gates outside the weights
Some criteria should never be traded off. A vendor that cannot process data lawfully for your EU customers, has no current security certification, or costs twice your budget should not be rescued by a brilliant visual editor. Put these conditions in a gate row that each vendor must pass before the weighted scoring starts. Privacy then appears twice: as a gate (the minimum) and as a weighted criterion that rewards doing better than the minimum, for example EU hosting by default or built-in consent handling.
Our view. The scorecard is a thinking tool, not a calculator. If the team's gut preference and the weighted total disagree, do not adjust the scores until they match. Ask which criterion the gut is really weighting, and whether the weights should change for everyone.
Section 5 · Criteria by tool family
How to choose an A/B testing tool: each tool family needs its own criteria
The ten criteria apply to every family of optimisation tool, but what you check under each one differs. Table 2 shows the questions we ask for analytics, experimentation, personalisation and VoC tools.
| Criterion | Analytics | Experimentation | Personalisation | Voice of Customer |
|---|---|---|---|---|
| Capabilities | Funnels, cohorts, paths, e-commerce reporting, raw data access | Client-side, server-side and feature flag tests; multivariate; bandits | Audiences, rules, recommendations, AI decisioning, holdouts | On-site and email surveys, feedback widgets, text analytics |
| Statistics and measurement | Sampling, data freshness, modelled data under consent | Frequentist, Bayesian or sequential engine; CUPED; SRM checks | Holdout groups and incrementality reporting | Sample sizes, response bias, significance of score changes |
| Implementation | Tag or SDK, server-side collection, tag manager fit | Snippet weight, flicker, SPA support, SDKs, edge | Page speed, caching, content delivery | Script weight, targeting rules, mobile SDKs |
| Data integration | Warehouse export, APIs, CDP connectors | Warehouse-native analysis, analytics integrations | Real-time data sources, product catalogue feed | Links to analytics, CRM and test results |
| AI features | Natural-language queries, anomaly alerts, MCP server | AI test building, AI analysis, agents | AI decisioning, generated content | Theme detection, summarisation, sentiment |
| Privacy | Consent handling, IP truncation, EU hosting | Consent-aware bucketing, cookie lifetime | Profile data minimisation | Personal data in free text, retention |
Check the statistics engine, not only the reports
For an experimentation tool, the statistics engine decides how often you will be wrong. Ask which method the tool uses (frequentist, Bayesian or sequential), how it handles peeking at results before the planned end, how it controls false discoveries across many metrics, and whether it supports variance reduction. Optimizely, for example, documents that its Stats Engine uses two-tailed tests because they are required for its false discovery rate control. Statsig documents CUPED (Controlled-experiment Using Pre-Existing Data), which adjusts each user's metric with the same metric in the seven days before exposure; its simulations showed variance fell for 98.3% of metrics (vendor data).
No method is right for every team. What matters is that the method is documented, that your analysts understand it, and that you can export raw data to check a result independently. Our guide to A/B test statistics explains the main models.
Test implementation and page speed on your own site
Implementation is a common source of regret: 32% of regretful software buyers in the Gartner Digital Markets survey cited slow or complex implementation. For experimentation and personalisation, the main choice is between client-side (JavaScript that changes the page in the browser), server-side (the variant is decided on the server or in the application) and edge delivery (decided at the content delivery network). Each has trade-offs in speed, flicker, and who must do the work; our comparison of client-side and server-side A/B testing covers them in depth.
Flicker, the flash of the original page before a variant appears, is usually hidden with an anti-flicker snippet that blanks the page until the tool has loaded. That protects the test but can slow the page. DebugBear measured one site's Largest Contentful Paint (LCP) at 6.0 seconds with the snippet and 2.7 seconds without it. In your PoC, measure LCP and other Core Web Vitals with and without the tool, on mobile, before you believe any vendor's performance claims. Check how the tool is deployed through your tag manager as well; our tag management market report explains why that layer matters.
Decide early whether the tool should be warehouse-native
Warehouse-native tools analyse data where it already lives, in your cloud data warehouse, instead of copying it into the vendor's platform. GrowthBook, for instance, runs read-only queries in your warehouse so that only aggregated statistics leave it, and supports BigQuery, Snowflake, Databricks, Redshift and others. Optimizely agreed in September 2024 to buy the warehouse-native analytics company NetSpring to tie experiments to business metrics held in customers' warehouses, and Statsig offers warehouse-native deployment on its Enterprise plan.
The advantage is one version of the truth: tests are measured on the same revenue, margin and returns data finance uses. The cost is that someone must maintain the data models and pay for the warehouse compute. If your analytics team already works in the warehouse, it is a strong criterion. If it does not, weight it lower and check instead that the tool can export raw data to your warehouse, so you keep the option. For analytics tools, check limits as well as features: the free version of Google Analytics 4 exports up to 1 million events a day to BigQuery and keeps detailed data for up to 14 months, while Analytics 360 raises these to billions of events and up to 50 months.
Judge AI features on your use cases, and on their risks
Every vendor now leads its demo with AI. Some of it is useful. Kameleoon's prompt-based experimentation, launched in June 2025, lets users describe a change in natural language and have the AI build a testable variant on the live site. Optimizely's Opal added agents for tasks including experimentation analysis in May 2025. Amplitude launched an MCP (Model Context Protocol) server in October 2025 so that AI assistants such as Claude or Cursor can query its behavioural data directly.
Score AI features like any other capability: against a use case, in the PoC. Ask four questions. Does the AI-built variant pass your QA and brand checks without rework? Can you see and edit what the AI generated? Is your data used to train the vendor's models, and can you opt out? Does the tool expose an API or MCP server so that your own AI agents can work with it, instead of locking AI inside one interface? Our article on AI agents in the experimentation workflow covers the wider picture.
Section 6 · Privacy and security
Privacy, EU data residency and security are gates to pass, not points to trade
For European companies, in our experience, privacy is where tool selections most often go wrong late in the process. The legal ground has moved several times in a few years. In February 2022 the French data protection authority, the CNIL, ruled that a French website's use of Google Analytics breached GDPR because of data transfers to the United States, weeks after a similar Austrian ruling. The European Commission adopted a new adequacy decision for the EU-US Data Privacy Framework on 10 July 2023, and on 3 September 2025 the EU General Court dismissed a challenge to it in the Latombe case. The decision can still be appealed, and its two predecessors, Safe Harbor and Privacy Shield, were both struck down.
You do not need to predict the courts. You need a tool whose data flows you understand and can change. Ask each vendor:
- Where is data processed and stored by default, and can you choose EU-only hosting?
- Which sub-processors receive personal data, in which countries, under which transfer mechanism?
- Is the vendor certified under the EU-US Data Privacy Framework if data goes to the US, and what is the fallback if the framework falls?
- How does the tool behave when a visitor refuses consent? Does it stop, anonymise, or keep bucketing users?
- Can the tool qualify for consent exemption? In France, the CNIL's guidance allows audience measurement and A/B testing cookies to be exempt from consent under strict conditions, including a single site, no cross-referencing with other data, truncated IP addresses and a cookie lifetime of at most 13 months. Many tools' default set-ups do not meet them.
Our guide to user consent in e-commerce goes through consent management in more detail.
Ask for current security certifications and read the scope
Two certifications cover most enterprise requirements. ISO/IEC 27001 is the international standard for information security management systems; the current edition is from 2022. A SOC 2 report is an independent auditor's report, under AICPA standards, on a service organisation's controls for security, availability, processing integrity, confidentiality and privacy. Ask for the report or certificate itself, check its date and check its scope: a certificate that covers the vendor's head office but not the platform you are buying is not much use. Add single sign-on, role-based permissions, audit logs and a published uptime service level agreement to the security criterion.
For leaders. Bring your data protection officer and security team in at step 1, not at step 7. A legal veto after the proof of concept costs three months and the team's goodwill.
Section 7 · Pricing and TCO
Price the three-year total cost of ownership, not the licence
The top product-related cause of regret in the Gartner Digital Markets survey, cited by 33% of regretful buyers, was a higher-than-expected cost of ownership. Part of the problem is that vendors bill on different units, so a quote cannot be compared with another until you translate both into your own volumes.
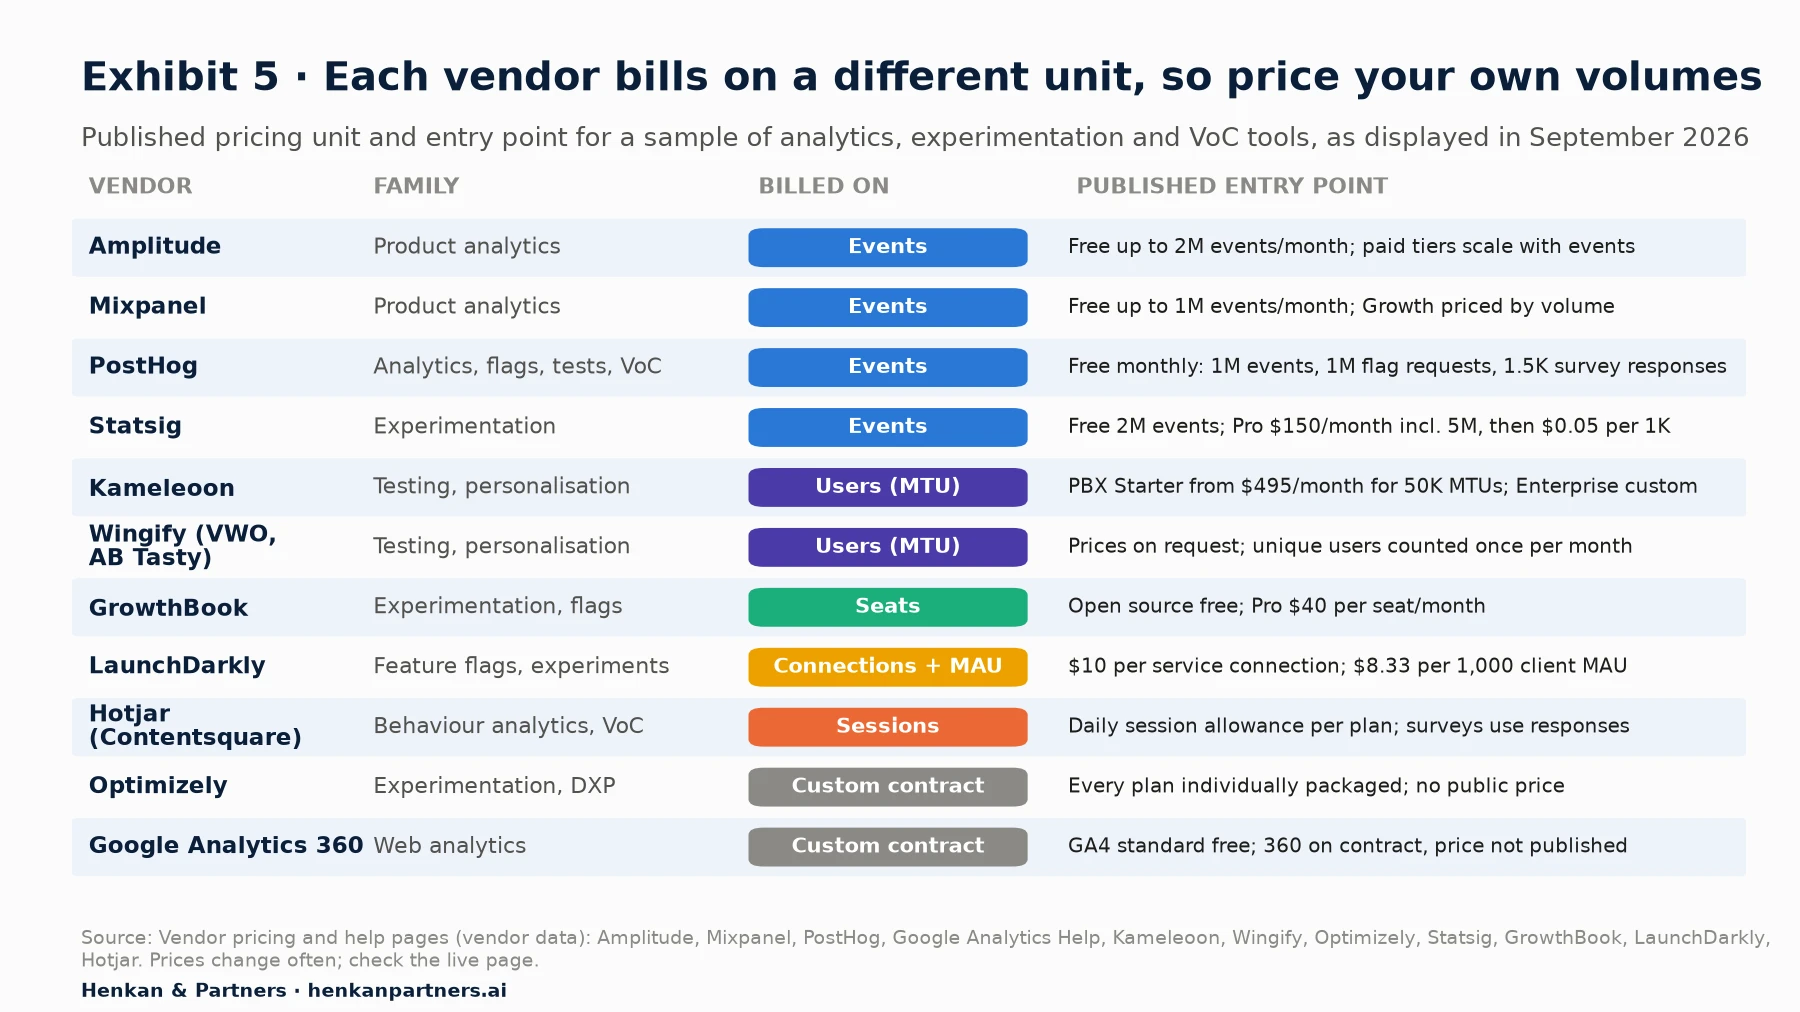
What this shows. In this sample, four pricing units dominate: events, users, sessions and seats, with enterprise contracts negotiated on top. Entry prices are low or free almost everywhere, which makes trials easy but tells you little about the cost at your scale. The only way to compare is to model your own monthly events, users and sessions, with growth, against each vendor's price grid.
| Pricing model | What you pay for | Works well when | Watch out for |
|---|---|---|---|
| Monthly tracked users (MTU/MUV) | Unique users exposed to tests or tracked in a month | Traffic is stable and you test on a large share of it | How users are counted across domains and apps; overage fees; unused quota does not roll over |
| Events | Every tracked action or metered call | You control what you track and have a lean tracking plan | Event volume grows with each new metric and feature; exposure events can be billed |
| Sessions | Visits recorded or analysed, often per day | Behaviour analytics with sampling you can live with | Data is sampled or recording stops when the daily allowance runs out |
| Seats | Named users of the tool | Small expert team, high traffic | Cost rises as you open the tool to more teams |
| Impressions / service connections | Variant views or connected server SDKs | Server-side testing and feature flags | Hard to forecast; ask for a usage report from the PoC |
| Custom enterprise contract | A bundle of the above, negotiated | Multi-product deals and large volumes | Opaque unit prices; renewal uplifts; bundled modules you never use |
Build a three-year total cost of ownership model
Total cost of ownership (TCO) adds everything it costs to get value from the tool over its likely life. Three years is a sensible horizon: the 2024 MarTech Replacement Survey found that 43% of replaced applications had been in use for three to five years.
Three-year TCO = Σ over 3 years (licence + usage overages + warehouse compute + internal people + agency and vendor services + training)
+ one-off implementation and migration
+ exit reserve (data export, parallel running, re-implementation)
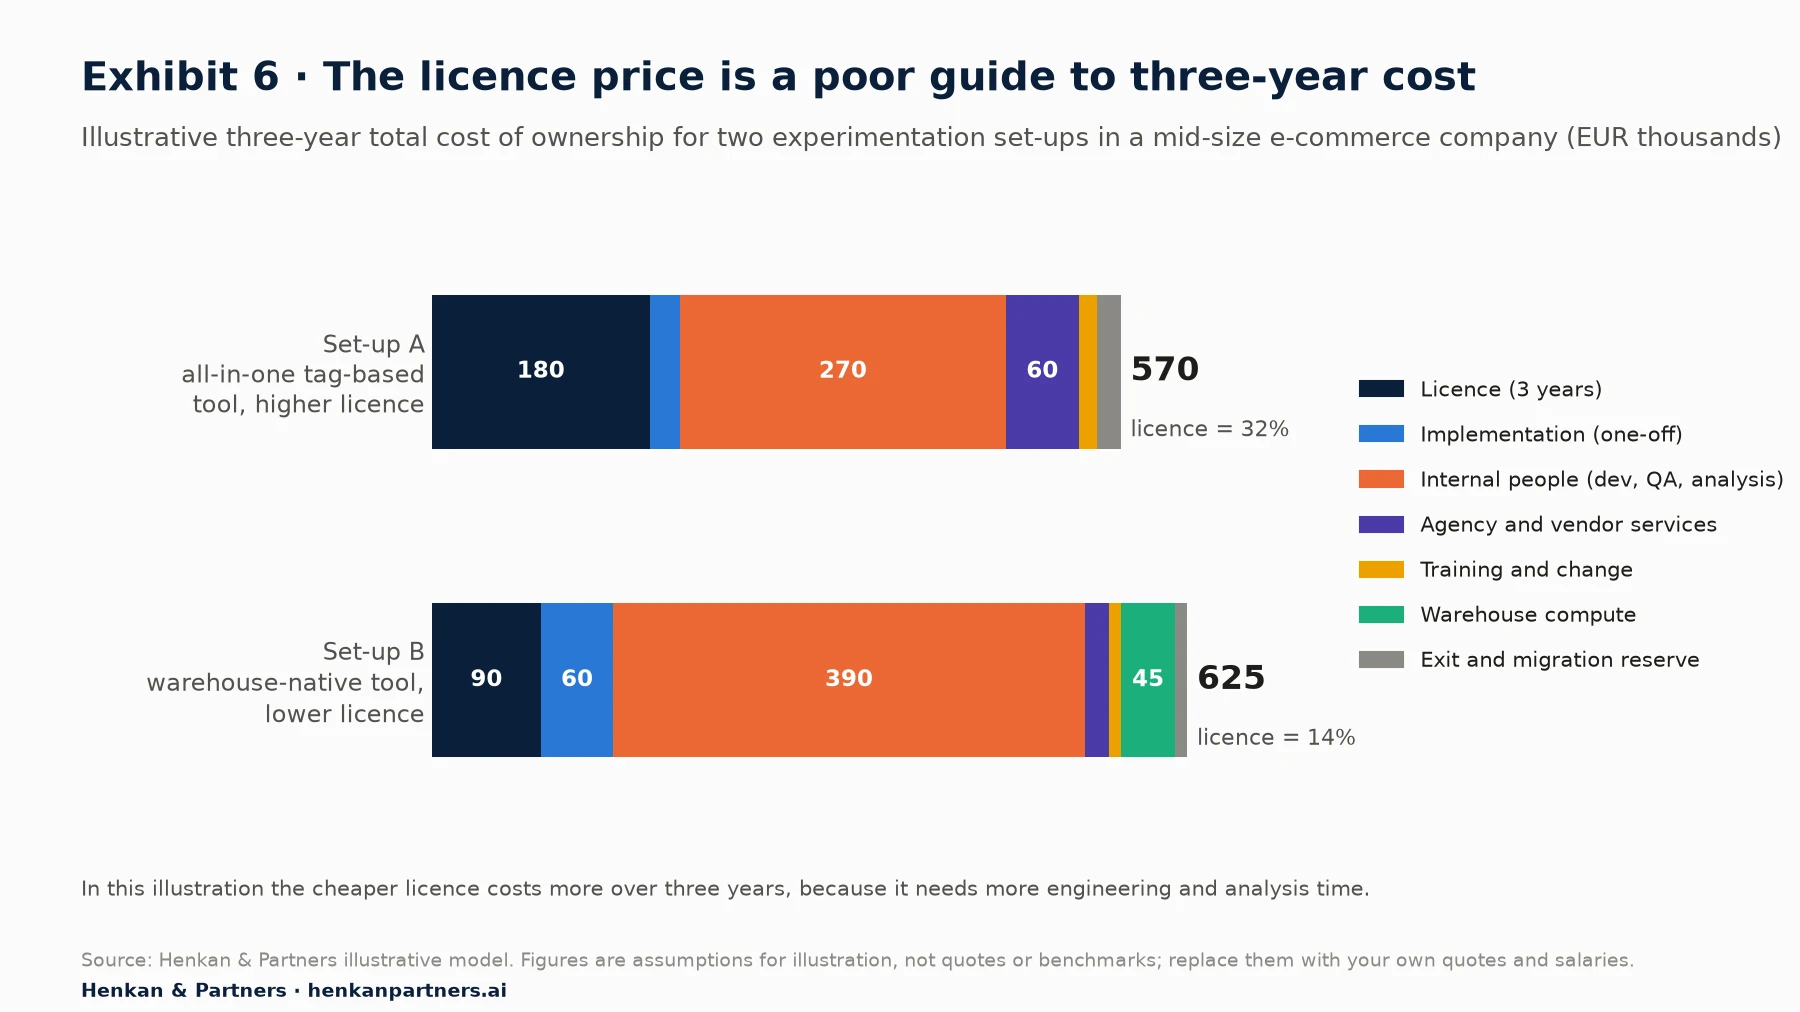
What this shows. In this illustration, the tool with half the licence price costs about 10% more over three years, because it needs more engineering and analysis time and adds warehouse compute. The reverse can be true for a team with data engineers already in place. The point is not which set-up wins; it is that internal people are the largest cost in both, and the licence is between a seventh and a third of the total. Replace every figure with your own quotes and salaries.
Price the exit before you sign
Tools disappear, change owners and change prices. Google switched off Optimize and Optimize 360 on 30 September 2023, and every customer had to migrate. Since then OpenAI has bought Statsig (September 2025), Datadog has bought Eppo (May 2025) and VWO and AB Tasty have united under the Wingify brand (September 2026). Acquired products often continue, as OpenAI said Statsig would, but road maps and pricing can change.
Regulation now helps. The EU Data Act has applied since 12 September 2025 and requires providers of data processing services to make switching possible; it removes switching charges, including data egress fees, entirely from 12 January 2027. Do not rely on the law alone. Write into the contract: full export of raw data and test history in an open format, at no extra cost; a transition period after termination; and help from the vendor during migration. Keeping your own copy of raw data in your warehouse is the cheapest insurance of all.
Section 8 · Red flags
Red flags in demos and contracts are predictable, so script them out
The top vendor-related cause of regret in the Gartner Digital Markets survey was the handoff between sales and implementation (43%), followed by mismanaged expectations (42%). Both show up early, if you know where to look.
Red flags in demos
- The vendor will not follow your script and returns to its standard demo.
- Everything is shown on a demo site built for the tool, never on a page like yours.
- AI features are shown only as recorded videos, or "coming next quarter".
- Nobody can explain the statistics engine in plain words, or results cannot be exported for checking.
- Page-speed questions are answered with a single average figure rather than a measurement on your site.
- The implementation team is not in the room and will be "introduced after signature".
Red flags in contracts
- Automatic renewal with a long notice period and an uncapped price increase at renewal.
- Overage fees without alerts or a spending cap, especially on event-based pricing.
- Multi-year commitments on usage you have never measured, with no right to reduce volume.
- No clause on data export at termination, or export only in a proprietary format.
- Bundled modules priced into the deal that no use case requires.
- Sub-processor lists that can change without notice or outside the EU without your approval.
- A service level agreement with no service credits, or support hours that do not cover your trading peaks.
For marketers. Ask the question that sales teams dislike most: "What do customers who leave say about you?" A clear, honest answer is a good sign.
For leaders. Tie part of the first-year payment to milestones in the implementation plan, such as the first live test or the first reconciled dashboard.
Section 9 · Build, buy, suite or best-of-breed
Build only what differentiates you, and consolidate only where data must be shared
Build versus buy
A handful of companies build their own experimentation platforms. Spotify started its internal platform in the early 2010s and grew from fewer than 20 priority experiments a year to thousands a year by 2020, before announcing Confidence, a commercial version, as a private beta in 2023. Companies that build usually run thousands of experiments a year and have platform engineering teams to maintain them.
For most e-commerce companies, buying is the right answer. The statistics, bucketing, QA, performance and privacy work behind a reliable platform take years to get right, and commercial and open-source tools already do it. In our experience, building makes sense only when three conditions hold together: experimentation is core to the product at very high volume, you have a platform team that will own the tool for years, and no commercial tool can handle your architecture. A middle path is common: buy the platform, and build the thin layer that connects it to your data, your design system and your AI agents.
Suite versus best-of-breed
Suites bundle analytics, experimentation, personalisation and sometimes VoC and content management under one contract. Best-of-breed means choosing the strongest tool in each family and integrating them. Both work. The choice depends on where your data needs to flow.
| Consolidate into a suite when… | Stay best-of-breed when… | |
|---|---|---|
| Data | Audiences, tests and personalisation must share one profile in real time | Your warehouse is already the single source of truth |
| Team | A small team needs one interface, one support contract and one training path | Specialist teams need depth in one discipline |
| Commercial | A bundle is clearly cheaper over three years, including modules you will use | One capability is a competitive advantage and the suite's version is weaker |
| Risk | You want fewer vendors to manage for security and privacy reviews | You want to avoid dependency on a single vendor's road map |
The market is moving towards suites through consolidation, which means your best-of-breed tool may become part of someone else's suite during your contract. That is one more reason to own your raw data and to negotiate exit terms.
Section 10 · Maturity
Weight the criteria by maturity: early teams buy ease, advanced teams buy control
There is no universal set of weights. A team starting out needs a tool it can operate without developers and a vendor that will teach it. An advanced team running more than a hundred tests a year needs statistical depth, warehouse integration and control over how everything works. Exhibit 7 shows the weights we start from with clients, before adjusting them to their use cases.
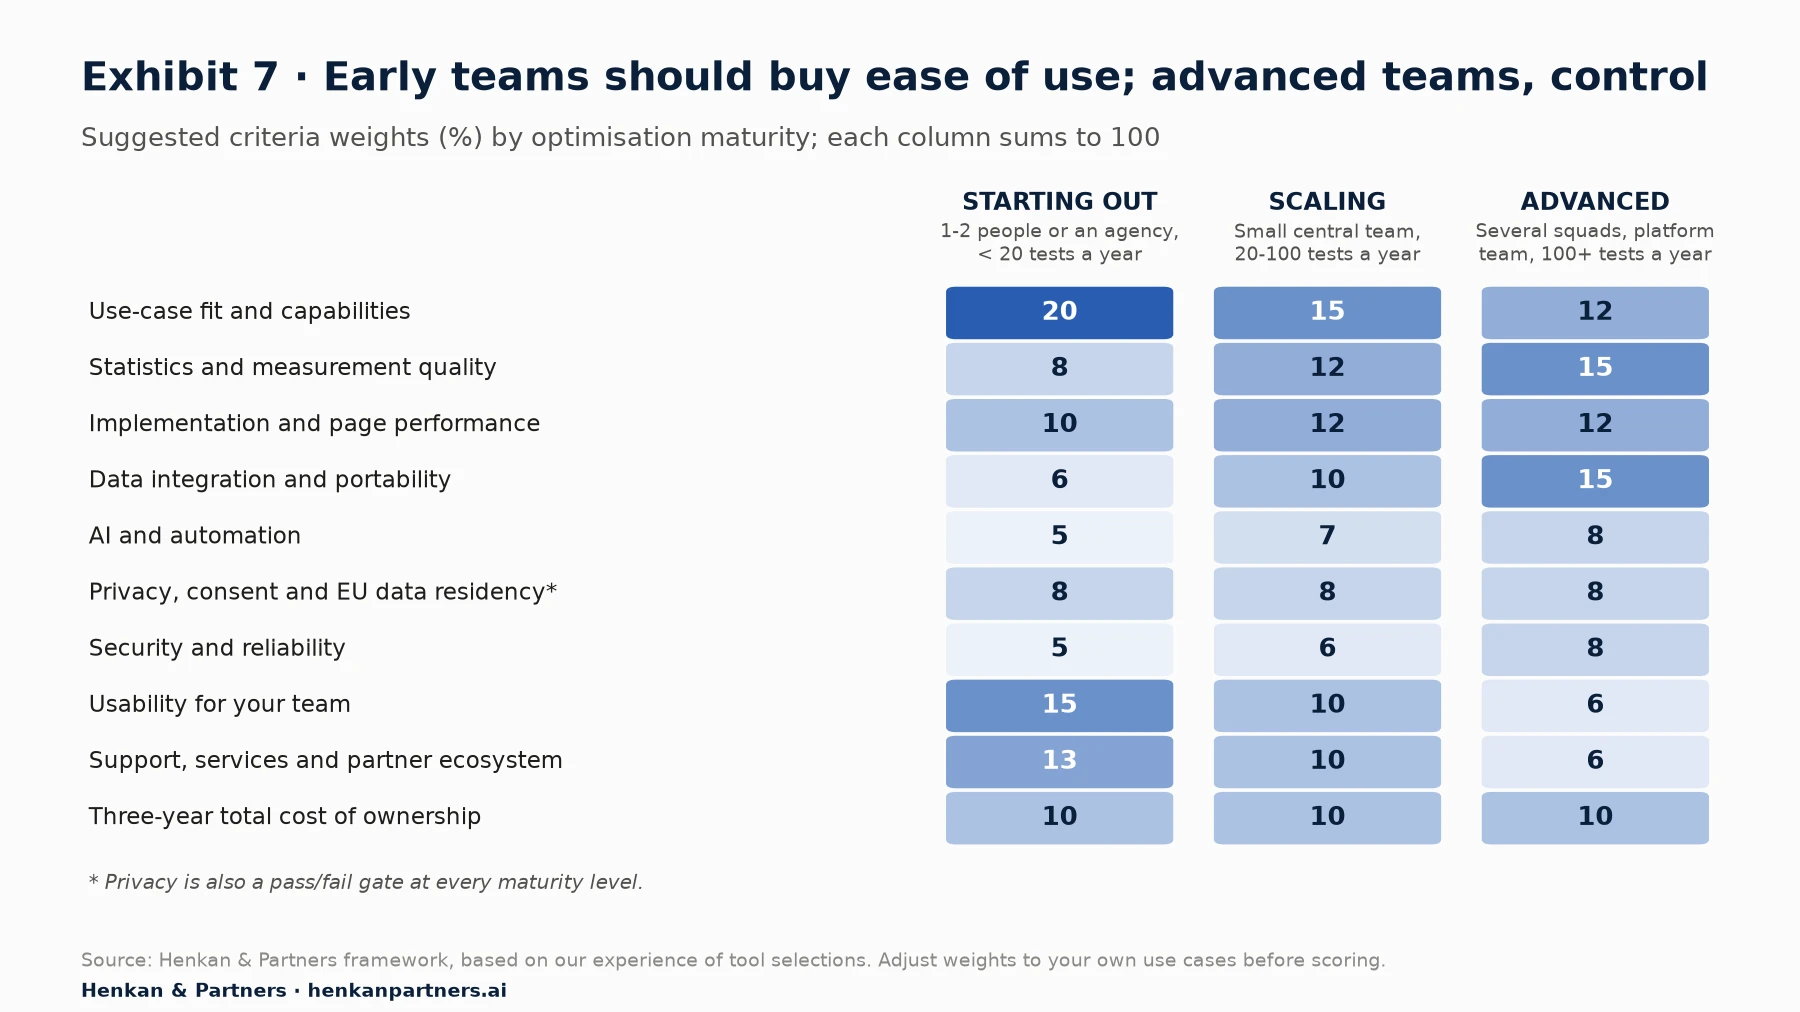
What this shows. Usability and support fall from 28 points to 12 as teams mature, while statistics and data integration rise from 14 points to 30. Three-year cost and privacy stay constant, because they matter at every stage. If your weights look like the 'advanced' column but your team looks like the 'starting out' one, you are about to buy a tool you cannot yet use.
Maturity is about the team, not the company's size. A large retailer with a two-person CRO team is starting out; a scale-up with a strong data team may be advanced. Be honest about where you are today and where you will be in three years, and weight for the middle of that path.
Section 11 · What to do next
What to do next
1. Write your use cases and capacity plan this month
List 10 to 20 use cases across the tool families you are reviewing, with owners and frequencies, and answer the six capacity questions in Table 1. This document is worth more than any vendor comparison you can download.
2. Agree gates and weights with your stakeholders
Start from the maturity profile in Exhibit 7, adjust it, and agree the gates with legal, security and finance before any vendor is contacted. Record the weights so nobody changes them after the demos.
3. Insist on a proof of concept on your own site
Run an A/A test and one real test for experimentation tools, or one real dashboard, campaign or survey for the others. Measure page speed and time spent by your team, and reconcile the numbers with your analytics.
4. Model three-year TCO and the exit
Translate each quote into your own volumes, add people, implementation and warehouse costs, and price the exit. Negotiate data export, notice periods and renewal caps into the contract.
5. Get an independent view before you sign
A second opinion from someone who has implemented several of the shortlisted tools can save months. Henkan & Partners runs vendor-neutral tool selections for analytics, experimentation, personalisation and VoC, from use cases to contract review. Talk to us.
FAQ
Frequently asked questions about A/B testing tool selection
Frequently asked questions
What is A/B testing tool selection?
A/B testing tool selection is the structured process of choosing an experimentation platform by scoring shortlisted vendors against weighted criteria that reflect your use cases, team capacity, data architecture, privacy constraints and three-year total cost, and confirming the choice with a proof of concept on your own site.
How do I choose an A/B testing tool?
Start from your use cases and team capacity, set pass/fail gates for privacy, security and budget, and shortlist three or four vendors. Run scripted demos, then a proof of concept with an A/A test and one real test on your own site. Score vendors on a weighted scorecard, call references and compare three-year total cost of ownership before you negotiate.
What criteria should I use to evaluate an A/B testing tool?
Use ten criteria: use-case fit, statistics engine, implementation and page performance, data integration and portability, AI features, privacy and EU data residency, security, usability for your team, support and partner ecosystem, and three-year total cost of ownership. Weight them according to your maturity.
How long should a tool selection take?
About 12 weeks for a mid-size e-commerce company selecting a core tool, including a four-week proof of concept. A single simple tool, such as a survey tool, can be chosen faster; a multi-product suite deal can take longer.
How are A/B testing tools priced?
Most vendors bill on monthly tracked users, events, sessions or seats, or on a custom enterprise contract. Entry tiers are often free, so compare vendors by modelling your own monthly volumes and growth against each price grid.
What is the total cost of ownership of an analytics or testing tool?
It is the full cost of getting value from the tool over its life: licence and overages, implementation, internal people, agency and vendor services, training, warehouse compute and the cost of exiting. People and implementation are usually larger than the licence.
Should we build our own experimentation platform?
Usually not. Building makes sense only when experimentation is core to your product at very high volume, you have a platform team to maintain the tool for years, and no commercial or open-source tool fits your architecture. Most companies should buy the platform and build the integrations around it.
Is a suite better than best-of-breed tools?
A suite is better when audiences, tests and personalisation must share one profile in real time or a small team needs one interface. Best-of-breed is better when your warehouse is the source of truth or one capability is a competitive advantage.
What is a warehouse-native A/B testing tool?
A warehouse-native tool analyses experiment results directly in your cloud data warehouse, such as BigQuery or Snowflake, instead of copying data into the vendor's platform. It keeps one version of the truth but needs data skills and warehouse compute.
Are A/B testing tools GDPR compliant?
It depends on the tool and how you configure it. Check where data is processed, which sub-processors receive it, the transfer mechanism for any non-EU processing, how the tool behaves without consent and whether it can meet local consent exemptions such as the CNIL's conditions in France.
Key terms
- Weighted scorecard
- A table of criteria, weights and vendor scores that produces a weighted total. It matters because it forces a team to agree what matters before the demos.
- Gate
- A pass/fail condition a vendor must meet before it is scored, such as EU data processing or a security certification. It matters because some risks should never be traded for features.
- Proof of concept (PoC)
- A time-boxed trial of a tool on your own site with your own team and data. It matters because it is the only step that shows how the tool performs in your reality.
- A/A test
- A test in which both variants are identical, used to check that the split and the statistics behave as expected. It matters because it catches implementation and data problems before real tests.
- Request for proposal (RFP)
- A written request asking shortlisted vendors to answer the same questions and price the same volumes. It matters because comparable answers make scoring fair.
- Total cost of ownership (TCO)
- The full cost of using a tool over its life, including people, implementation and exit. It matters because the licence is often the smaller part.
- Monthly tracked users (MTU)
- A pricing unit counting unique users tracked or exposed to tests in a month. It matters because it makes cost depend on how much of your traffic you test.
- Event-based pricing
- A pricing model that charges for each tracked action or metered call. It matters because costs grow with every new metric you track.
- Statistics engine
- The method a testing tool uses to calculate results, such as frequentist, Bayesian or sequential. It matters because it decides how often you declare false winners.
- CUPED
- Controlled-experiment Using Pre-Existing Data, a variance-reduction technique that uses users' pre-test behaviour. It matters because it can shorten tests without losing accuracy.
- Flicker
- The brief display of the original page before a client-side variant loads. It matters because hiding it can slow the page and showing it can bias results.
- Warehouse-native
- A tool design that analyses data inside your own data warehouse. It matters because it gives one version of the truth, at the cost of needing data skills.
- Data Processing Agreement (DPA)
- The contract setting out how a vendor processes personal data on your behalf under GDPR. It matters because it defines sub-processors, locations and your rights.
- SOC 2 and ISO/IEC 27001
- An independent audit report on a service provider's controls, and the international standard for information security management. They matter because they are the usual evidence of a vendor's security.
- Model Context Protocol (MCP)
- An open protocol that lets AI assistants connect to tools and data. It matters because a tool with an MCP server can be used by your own AI agents, not only by the vendor's.
Sources
All sources were checked in September 2026. Pricing, feature and performance facts from Amplitude, Mixpanel, PostHog, Statsig, Kameleoon, Wingify, Optimizely, GrowthBook, LaunchDarkly, Hotjar, Google and DebugBear are vendor data from their own public pages and may change; always check the live page. Gartner martech utilisation figures come from Gartner's own press release; the buyer-regret figures are as reported by TechRepublic, because the Gartner Digital Markets report is not openly accessible. MarTech Replacement Survey figures are self-reported survey data. Exhibits 2, 4, 6 and 7 and Tables 1, 2 and 4 are Henkan & Partners frameworks; the scores in Exhibit 4 and all figures in Exhibit 6 are illustrative, not assessments of real products or benchmarks. Table 3 is our analysis of the vendor pricing pages listed below.
- Brinker, S., chiefmartec (2025). 2025 Marketing Technology Landscape Supergraphic: 100X growth since 2011.
- Gartner (2023). Gartner survey finds 63% of marketing leaders plan to invest in generative AI in the next 24 months (press release; includes martech utilisation figures).
- TechRepublic (2023). Gartner: 60% of software buyers express regret after purchasing products (reporting Gartner Digital Markets' 2023 Global Software Buying Trends survey).
- MarTech / Third Door Media (2024). 2024 MarTech Replacement Survey · summary article.
- Kaushik, A. (2006). The 10 / 90 Rule for Magnificent Web Analytics Success. Occam's Razor.
- Optimizely (n.d.). Stats Engine: how Optimizely calculates results (vendor documentation).
- Statsig (n.d.). CUPED (vendor documentation and data).
- DebugBear (n.d.). Anti-flicker snippets from A/B testing tools and page speed.
- GrowthBook (n.d.). Data sources and warehouses · Pricing (vendor data).
- Optimizely via PR Newswire (2024). Optimizely enters definitive agreement to acquire warehouse-native analytics leader NetSpring.
- Google (n.d.). [[GA4] Google Analytics 360 (Google Analytics 4 properties)](https://support.google.com/analytics/answer/11202874). Analytics Help.
- Kameleoon (2025). Introducing Prompt-Based Experimentation (vendor) · Plans (vendor data).
- Optimizely via PR Newswire (2025). Optimizely Opal undergoes massive transformation to help marketers scale with agentic AI.
- Amplitude (2025). Amplitude brings behavioral data into AI tools with MCP launch · Pricing (vendor data).
- IAPP (2022). CNIL is latest authority to rule Google Analytics violates GDPR.
- IAPP (2025). European General Court dismisses Latombe challenge, upholds EU-US Data Privacy Framework.
- CNIL (n.d.). Sheet n°16: Use analytics on your websites and applications.
- ISO (2022). ISO/IEC 27001:2022 Information security management systems.
- AICPA & CIMA (n.d.). SOC 2: SOC for Service Organizations, Trust Services Criteria.
- European Commission (n.d.). Data Act explained. Shaping Europe's digital future.
- Google (n.d.). Sunset of Google Optimize. Analytics Help.
- OpenAI (2025). Vijaye Raji to become CTO of Applications with acquisition of Statsig.
- TechCrunch (2025). Datadog acquires Eppo, a feature flagging and experimentation platform.
- PR Newswire (2026). AB Tasty and VWO unite under Wingify.
- Spotify Engineering (2023). Coming soon: Confidence, an experimentation platform from Spotify.
- Mixpanel (n.d.). Pricing (vendor data).
- PostHog (n.d.). Pricing (vendor data).
- Statsig (n.d.). Pricing (vendor data).
- Wingify (n.d.). Pricing · Visitor counting logic (vendor data).
- Optimizely (n.d.). Pricing (vendor data).
- LaunchDarkly (n.d.). Pricing (vendor data).
- Hotjar (n.d.). What is a session? (vendor documentation).