Focus
How to Measure AI Search Visibility: Metrics, Tools and a Monthly Reporting Routine
Alexandre Suon · 2026-09-29
Your customers now ask ChatGPT, Gemini, Perplexity and Google's AI Mode what to buy, and the answer may or may not name you. This deep dive shows how to measure AI search visibility with numbers you can defend: the AI visibility metrics that matter, how to build a prompt panel, how to track AI referrals in GA4 and Search Console, which tools to use, and a monthly routine that ties it all to revenue.
Executive summary
- AI search is a small traffic channel with a large influence, so you need to measure both what happens inside the answer and what happens after the click. Conductor found AI referrals were 1.08% of website traffic on average across enterprise sites in 2025 (vendor data), but assistants shape shortlists long before anyone clicks. Measuring only sessions misses most of the effect; measuring only mentions misses the money.
- AI answers change on every run, so visibility is a frequency, not a rank. SparkToro found less than a 1 in 100 chance that ChatGPT or Google's AI returns the same list of brands twice (vendor research). Researchers tracking four engines recommend at least seven runs per prompt per day, aggregated over two to four weeks. Report percentages with a margin of error, and ignore single screenshots.
- Track eight metrics on two sides of the click. Inside the answer: mention rate, share of voice against named competitors, citation rate, prominence, sentiment and factual accuracy. After the click: AI-referred sessions and the conversions and revenue they produce. Accuracy is the most neglected: in a September 2026 test, 14% to 56% of shopping answers contained an error that would cost the buyer money, depending on the assistant (vendor data).
- The platforms now give you some first-party data, but no clicks. Google Analytics added an AI Assistant channel on 13 May 2026. Search Console's generative AI report shows impressions in AI Overviews and AI Mode (worldwide since 31 August 2026) but no clicks or queries. Bing Webmaster Tools shows citations in Copilot. OpenAI tags links with `utm_source=chatgpt.com`. Everything else needs a prompt-tracking tool.
- Build a prompt panel of 50 to 200 real buyer questions, split by intent and journey stage, and run it on the three or four assistants your customers use. Take prompts from Search Console queries, site search, customer service and voice-of-customer data, not from the keywords you already win. In our experience, 100 prompts with seven runs each per engine per month is enough to see a five-point change.
- Tie visibility to revenue with a chain of evidence, and review it monthly. Adobe reports that AI-referred visitors to US retail sites converted 60% better than other traffic in July 2026, having converted worse in early 2025 (vendor data). Combine GA4 revenue, conversion paths, a post-purchase survey question and branded search trends, and run a monthly routine: collect, diagnose, act, report.
Section 1 · Why measure
AI search visibility can be measured, but only as a frequency across many answers, not as a ranking
AI search visibility is how often, how prominently and how accurately AI assistants and AI search features (such as ChatGPT, Gemini, Perplexity, Microsoft Copilot, Google AI Overviews and AI Mode) mention, recommend and link to your brand when people ask questions relevant to what you sell. It is measured as a set of rates across a fixed panel of prompts run many times, plus the traffic and revenue those answers send to your site.
This article is about measurement only. If you need the basics of how AI answers are built and how to earn a place in them, start with our Essential Guide to Generative Engine Optimization. For product feeds, agentic checkout and shopping answers, see AI Search Optimisation for E-commerce Brands. For who sells what in the tool market, see The AI Search Visibility Market, 2023–2026.
Why measure at all, when the traffic is still small? Because the channel's influence is larger than its click share, and because leaders are already asking. Conductor's 2026 benchmark, based on its enterprise customers' sites, puts AI referrals at 1.08% of all website traffic on average between May and September 2025, with ChatGPT sending 87.4% of those referrals (vendor data). The share varies a lot by industry.
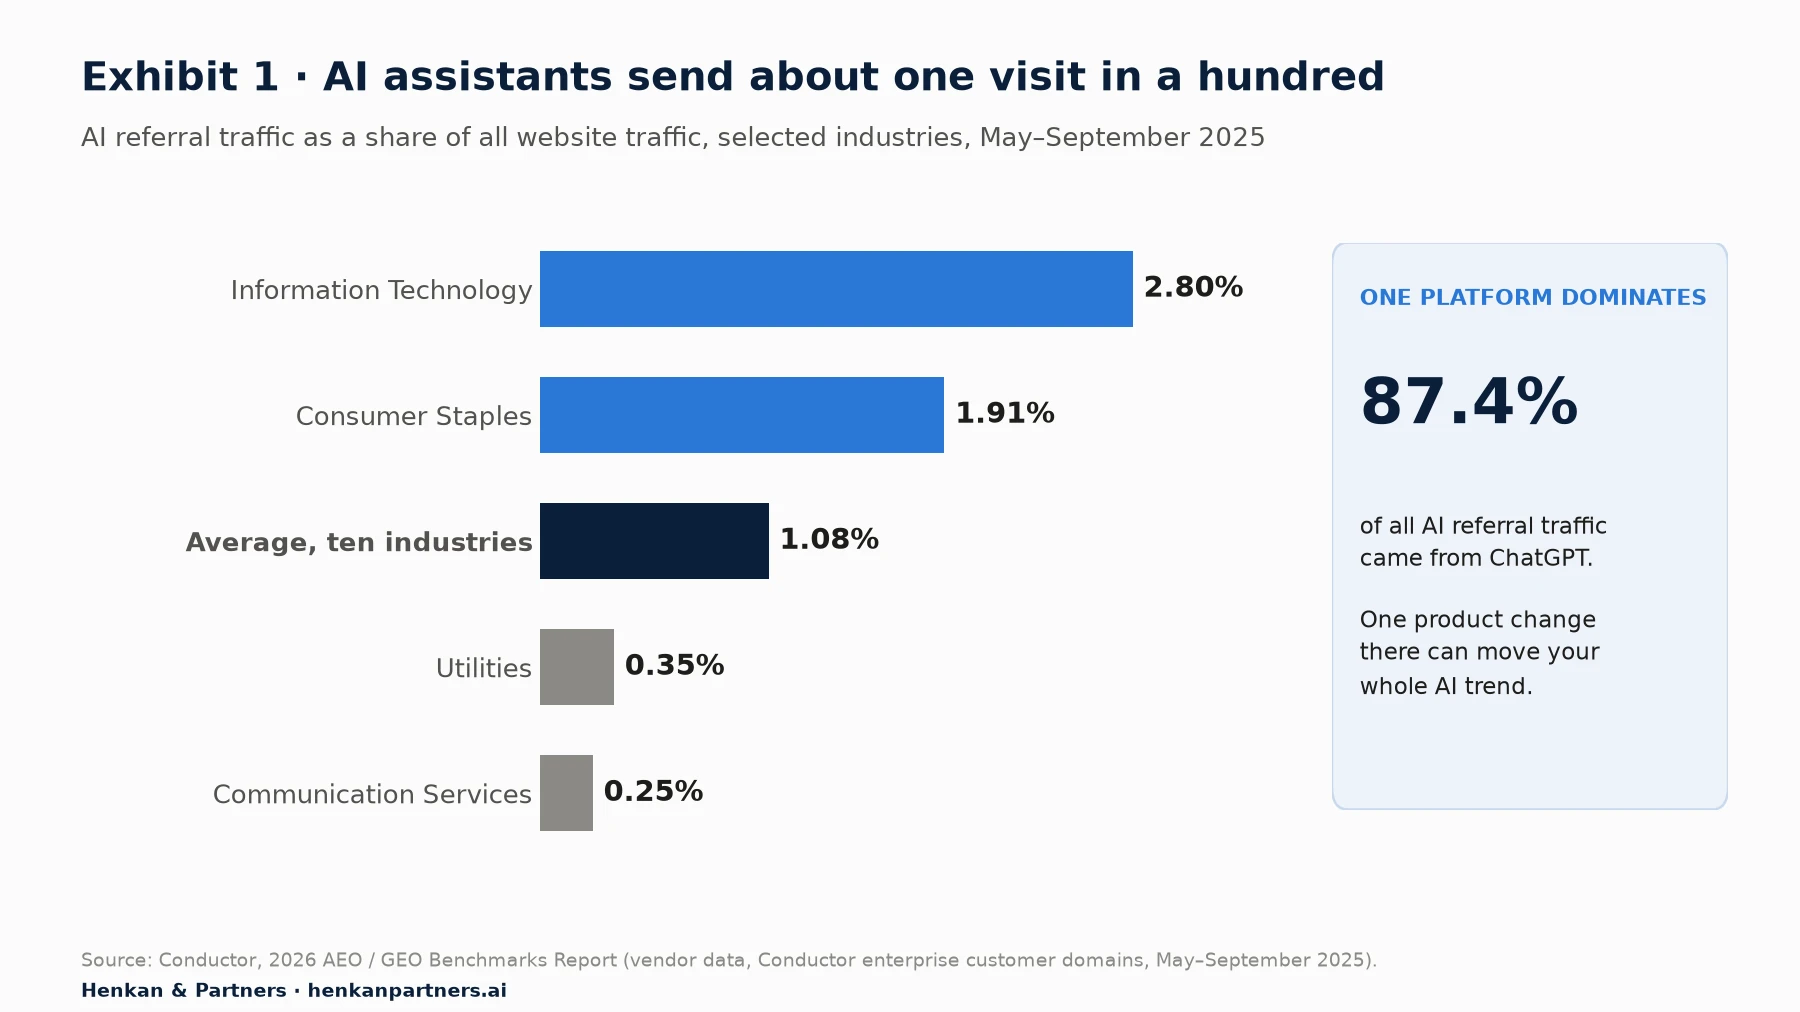
What this shows. AI assistants send around one visit in a hundred on average, from under 0.3% in communication services to almost 3% in information technology. The number is small enough that a single analytics report will not tell you much, and concentrated enough on ChatGPT that one platform's product change can move your whole trend. It is also only the visible part: most AI answers are read without a click.
That last point is why measurement has two halves. What happens inside the answer (are you named, recommended, described correctly, linked?) happens on someone else's platform, where your analytics cannot see. What happens after the click (visits, conversions, revenue) happens on your site, where you already have the tools. A useful measurement programme covers both and connects them.
Our view. Do not wait for AI traffic to become large before measuring it. The baseline you take now is what lets you show, in a year, whether your GEO work changed anything. A programme that starts measuring only when the channel is big will never know what caused the growth.
Section 2 · Why it is hard
Four forces make AI answers hard to measure: randomness, personalisation, constant updates and missing platform data
Classic SEO measurement rests on a stable result page and a free, first-party report (Search Console) that tells you queries, impressions, clicks and position. AI search breaks each of those assumptions.
1. Answers are non-deterministic
Large language models generate text by sampling, so the same prompt can return a different answer each time. Two independent studies measured how much.
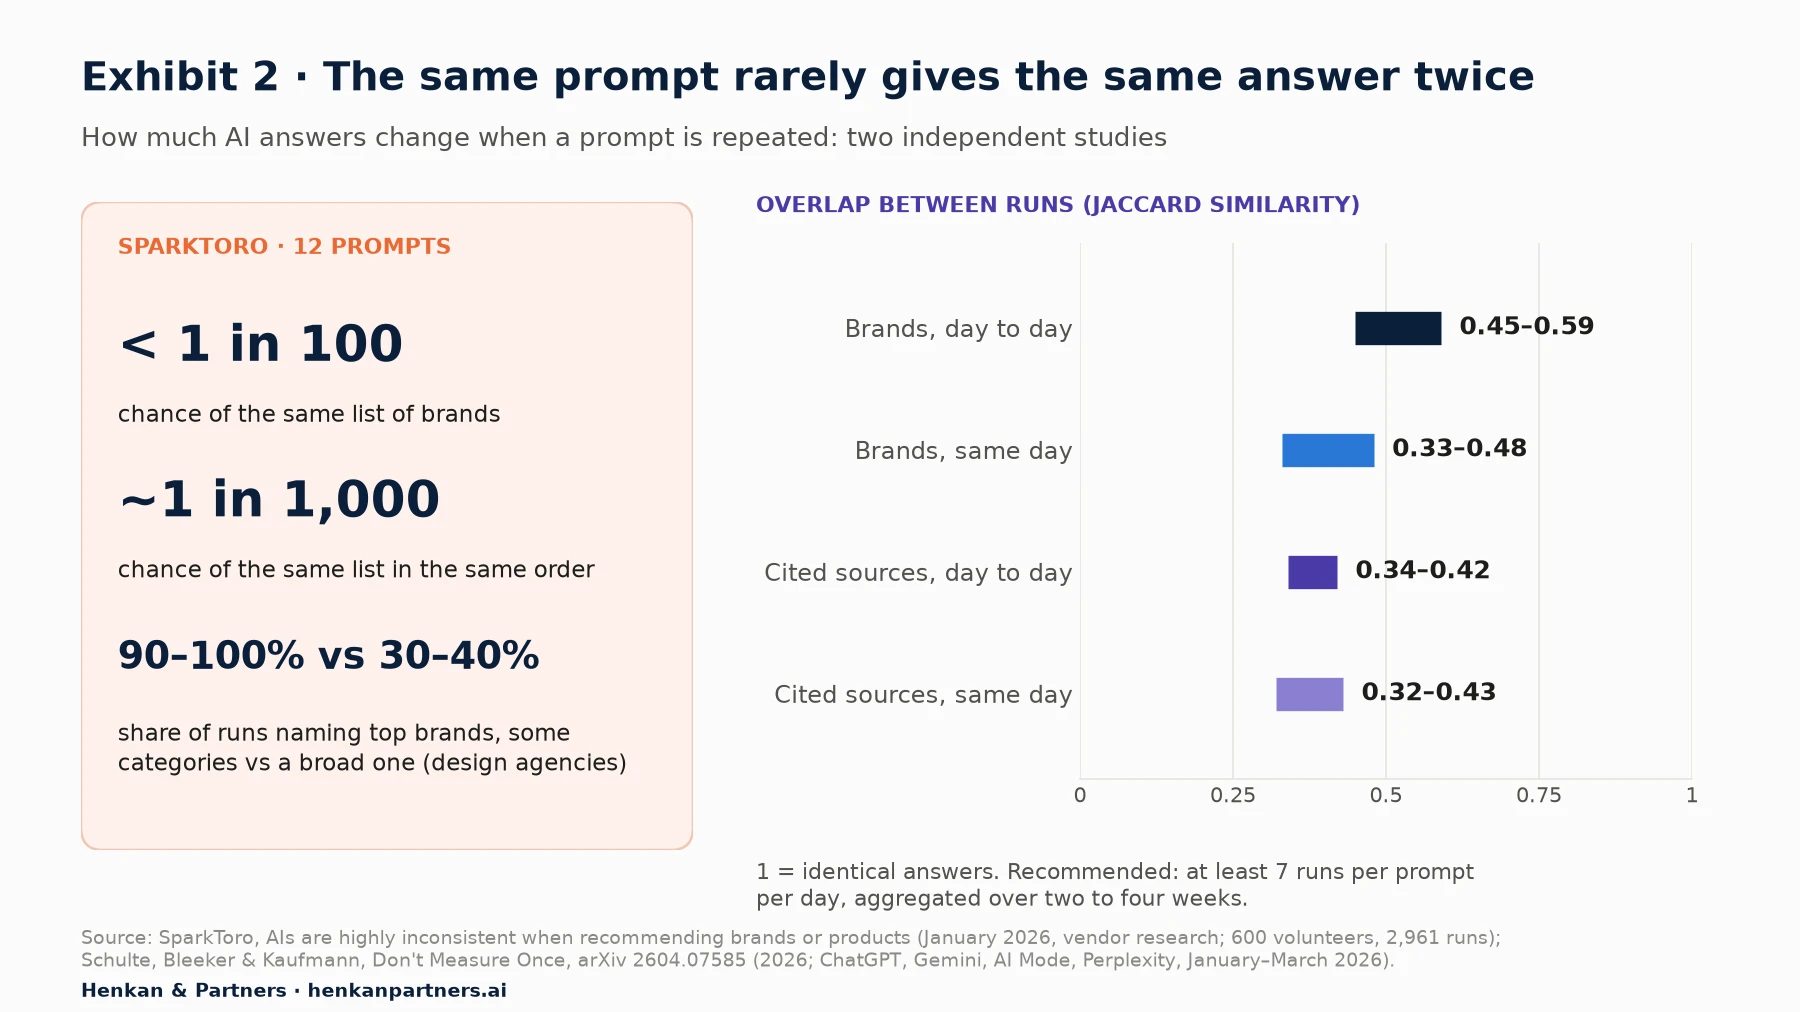
What this shows. Only about a third to a half of the brands and sources in one answer reappear in the next, and most of that change happens within the same day, so it is randomness rather than a real shift. A single check tells you almost nothing. Visibility has to be measured as the share of many runs in which you appear, and trends need weeks of data before they mean anything.
Schulte and colleagues tracked ChatGPT, Gemini, Google AI Mode and Perplexity for four industries in Switzerland, with German-language prompts, between January and March 2026. Their recommendation is a useful default: at least seven runs per prompt per day for brand visibility, eight when you care about which sources are cited, with rolling aggregation over two to four weeks. SparkToro reached a similar conclusion from a different direction: it describes tracking a "ranking position" in AI as meaningless, but treats the percentage of runs in which a brand appears as a reasonable metric, measured over 60 to 100 or more runs per question.
2. Answers depend on who is asking
Assistants adapt to the user's country, language, device and, in some products, their past conversations and saved preferences. Tracking tools cannot see a logged-in customer's history, so they query from clean sessions in the country and language you choose. That is the right design for a benchmark, but be clear about what it measures: a neutral baseline answer, not what every customer sees. Set the location and language deliberately for each market, and keep them fixed from month to month.
3. Models, indexes and interfaces change constantly
Assistants change their models, their search back ends and how they display links, often without notice. One example: Similarweb reports that after a ChatGPT interface change in May 2026, the share of ChatGPT referrals landing on homepages rose from about 26–29% to about 62–63% (vendor data). A change like that moves your landing-page reports without anything changing on your site. Keep a dated log of known platform changes next to your trend lines, so that a jump is not mistaken for the result of your own work.
4. Most assistants give you no first-party data
Google and Microsoft now report some AI data to site owners, and OpenAI tags its links. That is the extent of it in September 2026. There is no equivalent of Search Console's query report for ChatGPT, Gemini (outside Google Search), Claude or Perplexity.
| Platform | What it gives you | What it does not give you |
|---|---|---|
| Google Search Console, generative AI report | Impressions of links to your pages in AI Overviews and AI Mode, by page, country, device and date. Worldwide since 31 August 2026. | Clicks, click-through rate, queries, position, or which passage was used |
| Google Search Console, Performance report (Web) | Clicks and impressions from AI features, included in overall web search totals | A way to separate AI feature clicks from other organic clicks |
| Bing Webmaster Tools, AI Performance (beta since February 2026) | Total citations, average cited pages, grounding queries and page-level citation activity in Copilot, Bing's AI summaries and some partners | Clicks, traffic, ranking or how a page contributed to an answer |
| Google Analytics 4, AI Assistant channel (since 13 May 2026) | Sessions whose referrer matches a recognised AI assistant, with medium `ai-assistant` | Visits without a referrer, and clicks from Google's own AI features (they arrive as Google organic) |
| OpenAI (ChatGPT) | `utm_source=chatgpt.com` added automatically to links in ChatGPT | Any data on mentions, prompts or impressions |
| Gemini app, Claude, Perplexity, Meta AI and others | A referrer when a user clicks, if the browser passes one | Any first-party reporting for site owners |
The practical consequence: inside-the-answer metrics come mostly from sampling, with a prompt-tracking tool or your own scripts, and after-the-click metrics come from your analytics. The free Google and Bing reports sit in between and are the best way to check whether the sampled picture is plausible.
Section 3 · The metric set
AI visibility metrics: track eight measures on both sides of the click, and put accuracy next to share of voice
Most tools offer a single "visibility score". Scores are useful for trend lines but hard to act on, and each vendor calculates theirs differently. Build your reporting on a small set of simple rates you can explain to a finance director, and keep the vendor score as a secondary view.
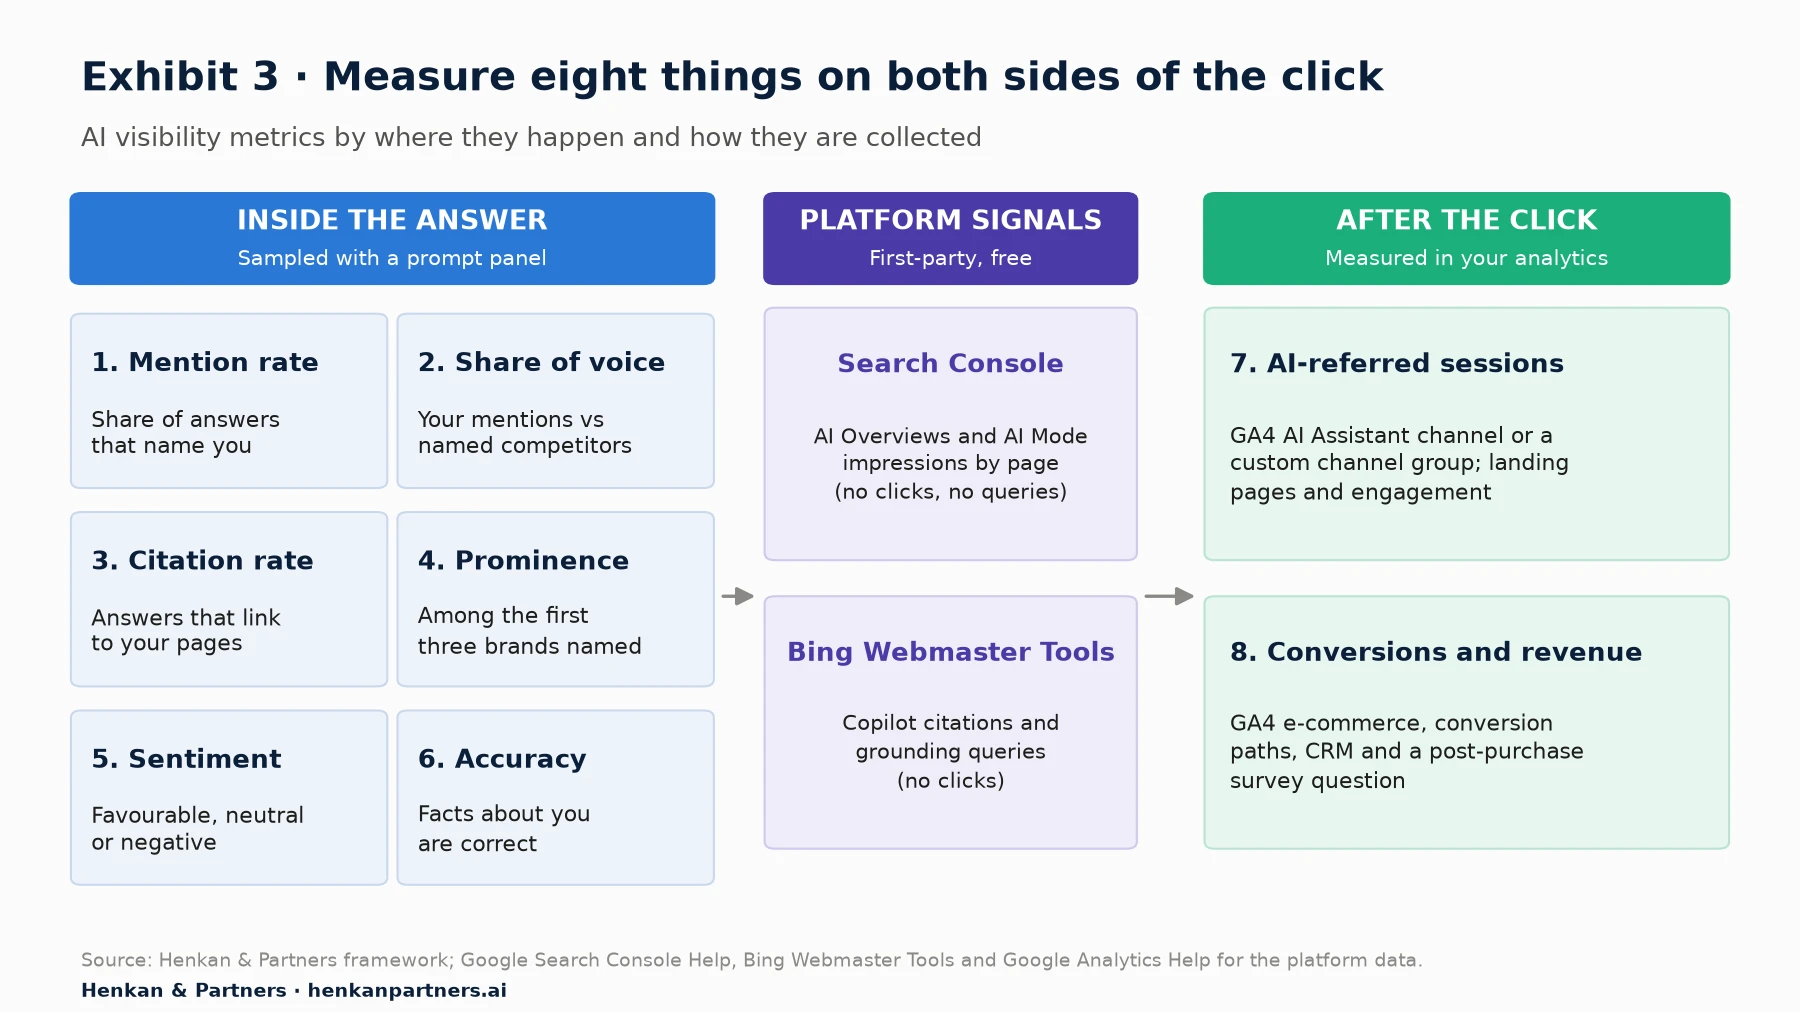
What this shows. Six metrics describe the answer and two describe the business result. The first six need a prompt panel; the last two need clean analytics. The platform signals in the middle are free and first-party, so use them to sanity-check the sampled numbers. No single tool fills every box.
Definitions and formulas
Mention rate = answers that name your brand ÷ all answers sampled
Share of voice = your brand mentions ÷ mentions of you + named competitors (same answers)
Citation rate = answers that link to at least one of your URLs ÷ all answers sampled
Prominence (top-3 rate) = answers where you are among the first three brands named ÷ answers that name you
Net sentiment = (positive mentions − negative mentions) ÷ all mentions
Accuracy rate = answers whose facts about you are all correct ÷ answers that mention you
AI referral share = AI-referred sessions ÷ all sessions
AI revenue per session = revenue from AI-referred sessions ÷ AI-referred sessions
| Metric | What it answers | How to collect it | Watch out for |
|---|---|---|---|
| Mention rate | Are we in the answer at all? | Prompt panel, repeated runs | Brand name variants and product names; count them all |
| Share of voice | Are we named more or less than our competitors? | Same panel; fix the competitor list | Changing the competitor set breaks the trend |
| Citation rate | Does the answer link to our pages? | Panel, plus Bing citations and Search Console AI impressions | A cited URL does not prove the page was used correctly |
| Prominence | When named, are we recommended first? | Panel; record order of brands | Order is even less stable than presence; use a top-3 rate, not an average position |
| Sentiment | Is the description favourable? | Panel; classify each mention | Automated sentiment misreads comparisons; check a sample by hand |
| Accuracy | Are prices, specs, policies and claims about us correct? | Panel; compare facts with your catalogue | Needs a reference fact sheet; errors cost sales |
| AI-referred sessions | Do answers send people to us? | GA4 AI Assistant channel or custom channel group | Missing referrers; Google AI clicks sit in organic |
| Conversions and revenue | Do those visitors buy? | GA4 e-commerce, CRM, post-purchase survey | Last click undercounts AI influence |
Three choices make these numbers comparable over time. First, fix the denominator: always the same prompt panel, engines, locations and number of runs. Second, fix the competitor set for share of voice, typically four to eight named brands. Third, report by segment (engine, market, intent, journey stage) as well as in total, because a flat total often hides a gain on one engine and a loss on another.
Why we use a top-3 rate instead of average position
Many tools report an "average position" in the answer, borrowed from SEO. The SparkToro data show that the order of brands in AI answers is far less stable than their presence: the chance of the same list in the same order was about 1 in 1,000. An average of unstable positions is noisy and easily misread. A top-3 rate, the share of your mentions where you are among the first three brands named, is more robust and closer to what a buyer actually sees.
Accuracy is the metric most teams skip
Mention rate tells you whether you are named; accuracy tells you whether being named helps or hurts. The evidence says errors are common. The Tow Center at Columbia Journalism Review asked eight AI search tools to identify the source of 1,600 news excerpts in 2025: more than 60% of answers were wrong, from 37% for Perplexity to 94% for Grok 3. For shopping, a September 2026 study by Product.ai is more directly relevant.
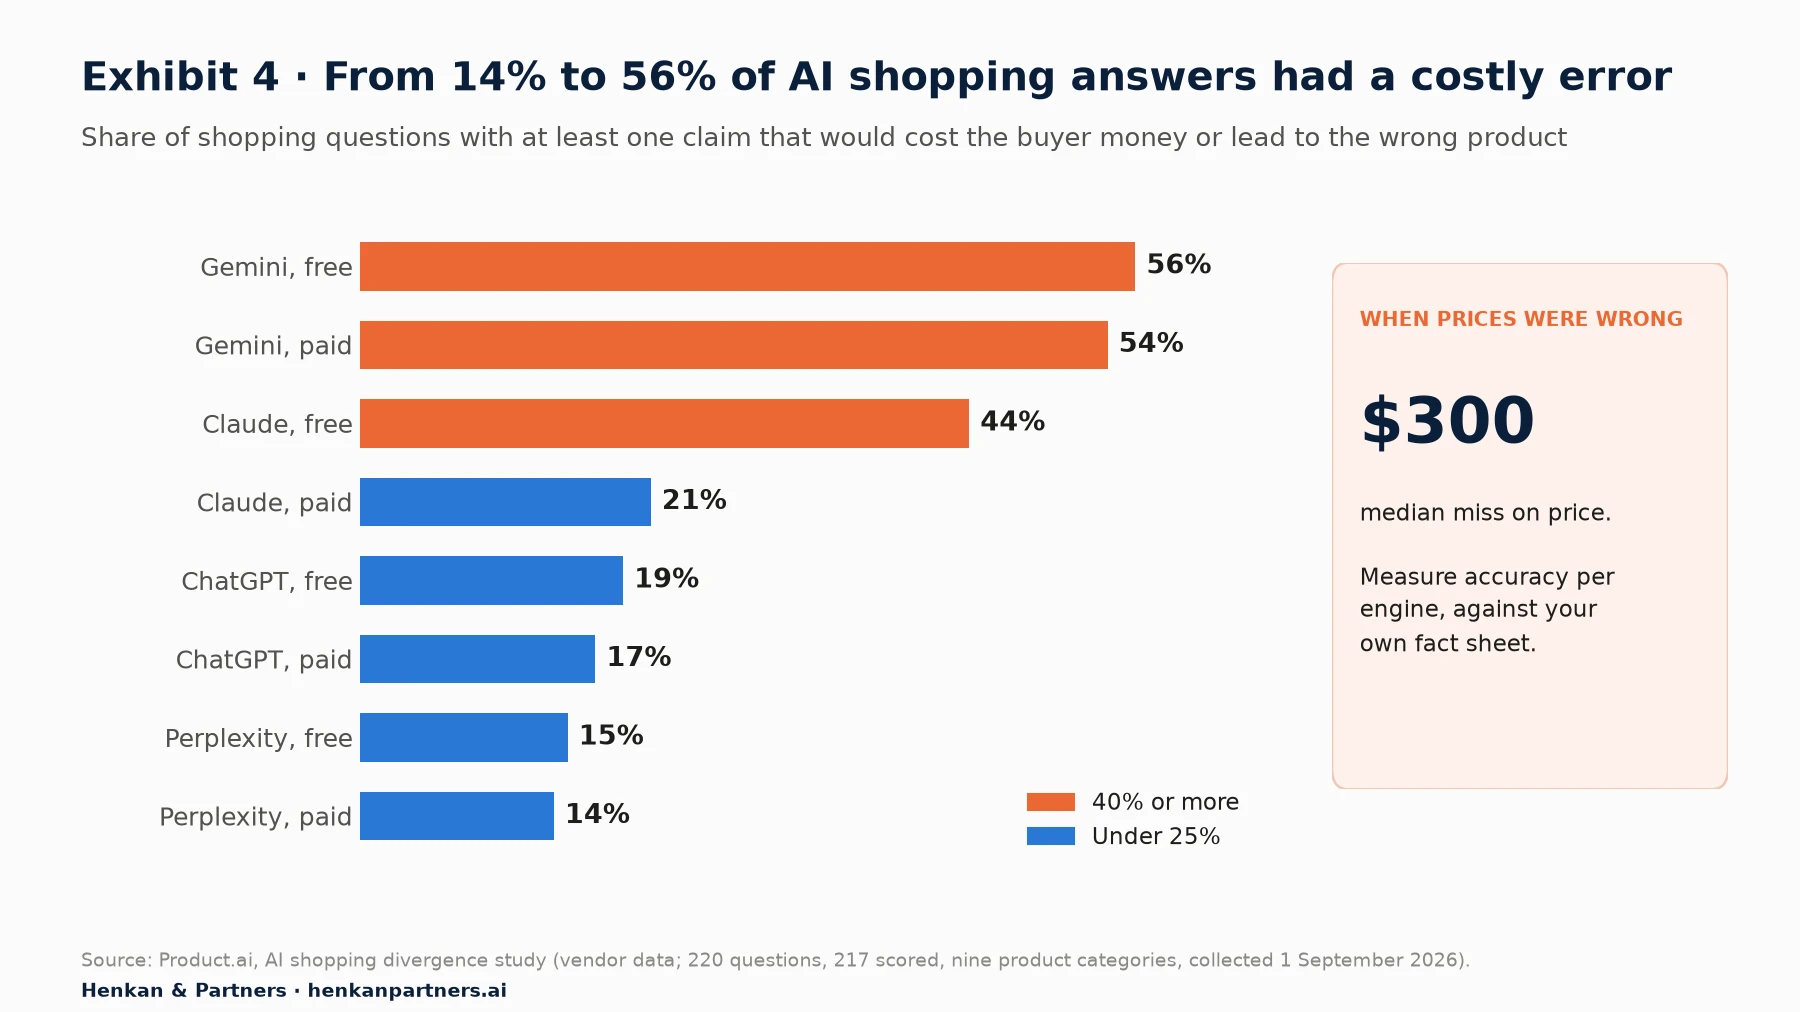
What this shows. Between one in seven and more than half of shopping answers contained an error that would cost the buyer money or point them to the wrong product, and when prices were wrong they were wrong by a median of $300. Error rates differ widely between assistants and between free and paid tiers, so an accuracy rate has to be measured per engine. For your own brand, the errors that matter are wrong prices, discontinued products, outdated policies and invented features.
To measure accuracy, write a reference fact sheet for the brand: prices or price ranges, key specifications, delivery and returns policies, store locations, awards, founding facts. Review every answer that mentions you against it, by hand for a sample and with an LLM-based checker for the rest, and log each error with the source the assistant cited. The sources are what you fix: an outdated review page, a marketplace listing, a stale help article.
For marketers. Put accuracy on the same slide as share of voice. A rising mention rate with falling accuracy is not good news.
For leaders. Ask for the three most damaging errors assistants make about the brand this month, and who owns fixing each source.
Section 4 · The prompt panel
A good prompt panel mirrors real buyer demand by intent and journey stage, not the queries you already win
Your prompt panel is the questionnaire behind every inside-the-answer metric. If it is biased towards questions where you are strong, your visibility numbers will be flattering and useless. Build it the way a market researcher builds a sample.
Where prompts should come from
- Search Console queries, especially long, question-shaped ones, grouped by topic. They are the closest record of how your customers phrase needs.
- Site search logs, which show what visitors still cannot find after they arrive.
- Customer service and sales questions, chat transcripts and returns reasons. Our guide to voice of customer explains how to mine them.
- Prompt and AI search volume data from tools such as Profound (prompt volumes), Ahrefs Brand Radar (a database of search-backed prompts) or the DataForSEO API (AI search volume). Treat these as estimates; they are vendor models, not platform data.
- Competitor and category questions you do not yet win. A panel with no prompts you lose cannot show progress.
How to structure the panel
| Journey stage | Intent | Example prompt (illustrative, a luggage brand) | Share of panel (our default) |
|---|---|---|---|
| Discover | Generic category need | "What is the best carry-on suitcase for frequent flyers?" | 30–40% |
| Discover | Problem or use case | "Which suitcase survives airline baggage handling best?" | 10–15% |
| Consider | Comparison | "Brand A vs Brand B carry-on: which is more durable?" | 15–20% |
| Consider | Shortlist with constraints | "Lightweight hard-shell carry-on under €300 with a lifetime warranty" | 10–15% |
| Decide | Branded fact check | "Does Brand A's warranty cover broken wheels?" | 10–15% |
| Decide | Where to buy, price, availability | "Where can I buy Brand A in Paris and what does it cost?" | 5–10% |
Generic discovery prompts measure reach: are you on the shortlist when the buyer does not yet know you? Comparison and constraint prompts measure consideration. Branded prompts measure accuracy and reputation: when someone asks about you directly, is the answer right and favourable? Report the three groups separately; a brand can dominate branded prompts and be invisible on generic ones.
How many prompts, runs, engines and markets
Because each answer is a random draw, precision depends on how many answers you collect, not only on how many prompts you write. The margin of error on a rate shrinks with the square root of the number of answers.
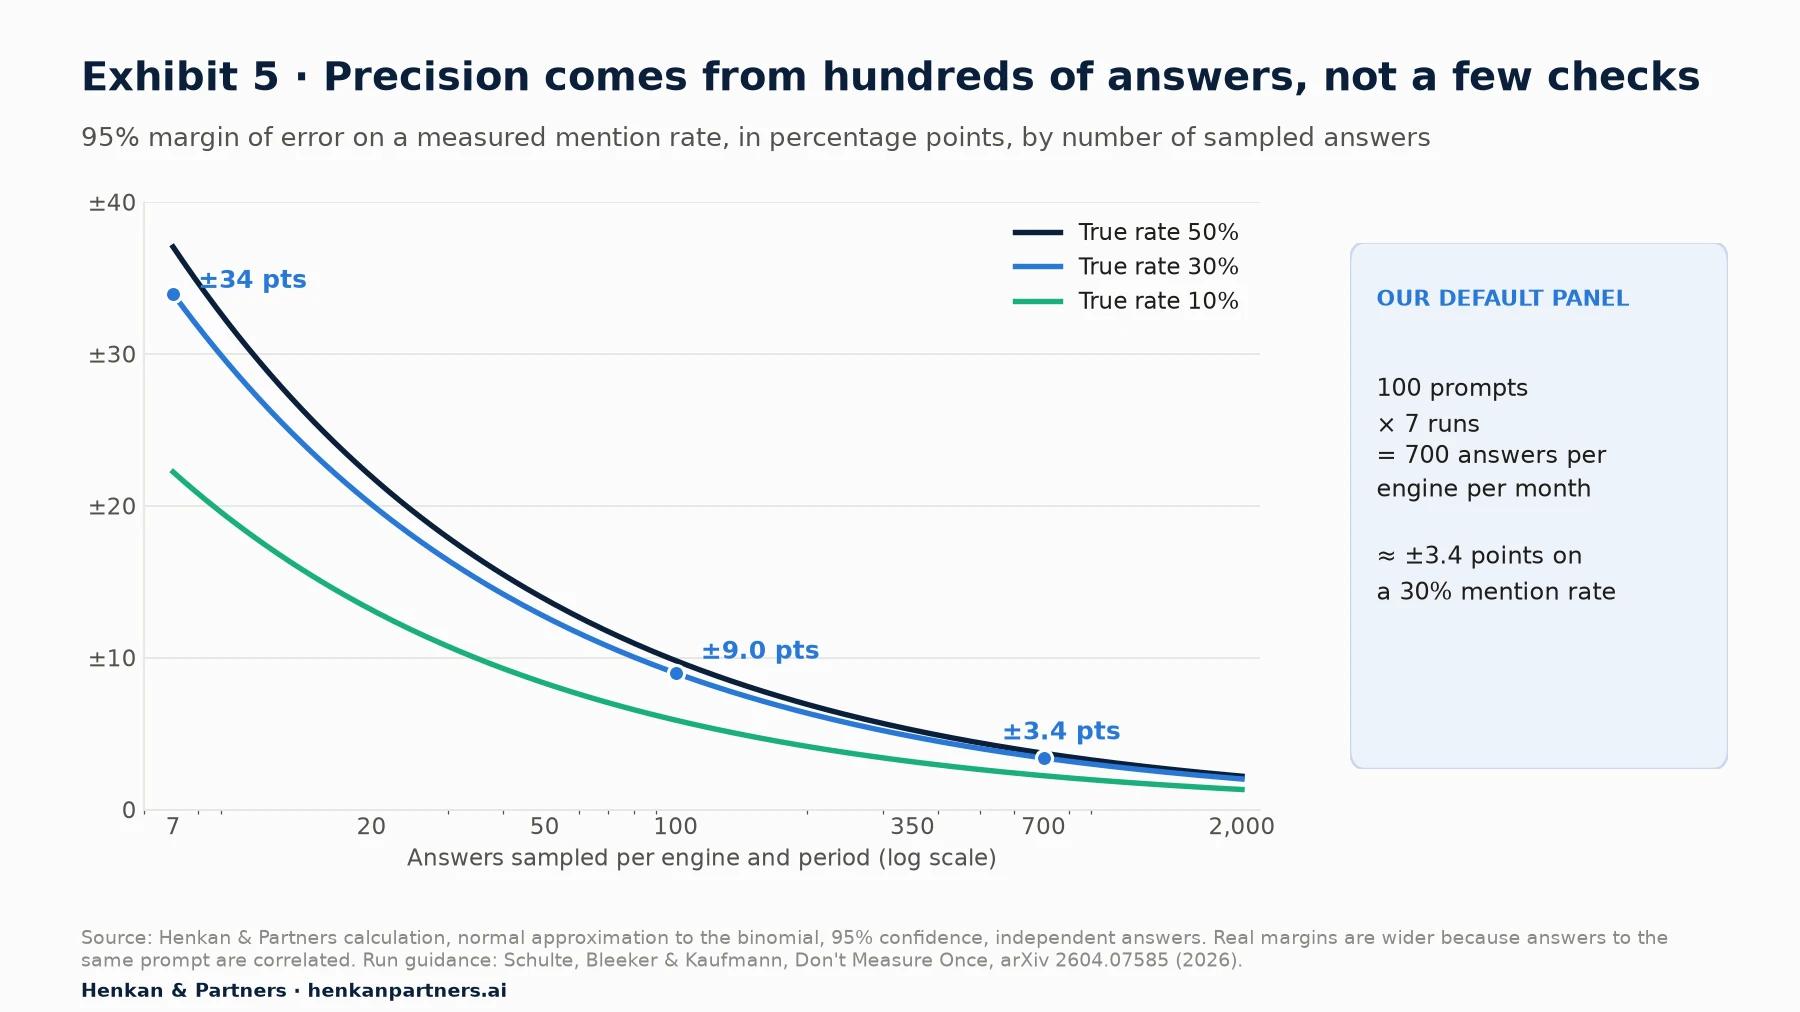
What this shows. Seven answers give a range of plus or minus 34 points on a 30% mention rate, which is useless. Around 700 answers per engine per month bring it to about plus or minus 3.4 points. Because answers to the same prompt are correlated, the true margin is wider than this curve, which is why you need many prompts as well as many runs.
95% margin of error ≈ 1.96 × √( p × (1 − p) ÷ n )
p = measured rate (e.g. 0.30), n = number of answers sampled
Example: p = 0.30, n = 700 → 1.96 × √(0.21 ÷ 700) ≈ ±3.4 points
Our defaults, which we adapt to each client:
- Prompts. 50 to 200 per market. Below 50, one prompt swinging moves the total too much; above 200, cost rises faster than insight.
- Runs. Schulte and colleagues recommend at least seven runs per prompt per day for daily monitoring. For a monthly report, treat seven runs per prompt per engine as the absolute floor; daily tracking, which most tools offer, gives you about 30 and a much tighter estimate.
- Engines. The three or four your customers use. Similarweb estimates that ChatGPT's share of visits to generative AI platforms fell from about 76% in June 2025 to about 53% in May 2026, while Gemini rose to 27–28% and Claude to close to 9% (vendor data). ChatGPT alone is no longer enough; add Google AI Overviews and AI Mode wherever Google is your main search engine.
- Markets and languages. One panel per market, written natively, not machine-translated. Assistants answer differently in French and English, and the competitor set changes by country.
- Stability. Change no more than 10% of the panel per quarter, and keep a frozen core so that trends stay comparable.
To judge whether a month-on-month change is real, remember that a difference between two estimates is noisier than either one. With 700 answers in each month and a 30% rate, a change smaller than about five points is within noise. In practice we read changes on a rolling four-week basis and only call a shift when it persists for two consecutive periods.
Worked example: sizing a panel (illustrative)
A fashion retailer selling in France and the UK wants to track visibility on ChatGPT, Gemini, Perplexity and Google AI Mode. It writes 100 prompts per market (200 in total), split as in Table 3, and runs each prompt seven times a month on each engine. That is 200 × 7 × 4 = 5,600 answers a month, 700 per engine per market. On a 30% mention rate, each engine-market figure carries a margin of about ±3.4 points before the correlation adjustment, enough to spot a five-point shift over two months. If the budget only allows a quarter of that, the retailer should cut engines or markets, not runs, because a precise measure of fewer things beats a vague measure of everything.
Section 5 · GA4
Track AI referrals in GA4 with the new AI Assistant channel, plus a custom channel group you control
After-the-click measurement starts in your analytics. If you need a refresher on how GA4 attributes sessions to sources and channels, read How GA4 Actually Works first; the logic below depends on it.
The default AI Assistant channel
On 13 May 2026 Google Analytics added dedicated AI measurement. When the referrer matches a recognised AI assistant, GA4 sets the medium to `ai-assistant` and the campaign to `(ai-assistant)`, and the session is reported in a new AI Assistant default channel. Google's documentation names ChatGPT, Gemini, Deepseek, Copilot and Grok as examples, and the release notes mention Claude. Google has not published the full list of recognised assistants, unlike its lists of search, social and shopping sites.
Switch to the default report first: Reports › Acquisition › Traffic acquisition, primary dimension Session default channel group, then add Session source as a secondary dimension to see which assistants send traffic.
Why add a custom channel group
The default channel is a good start, but you do not control its definition, you cannot see which sources it includes, and it lumps all assistants together. A custom channel group fixes all three. Standard GA4 properties allow two custom channel groups (five on GA4 360), they apply to reports retroactively, and traffic is assigned to the first channel whose definition it matches, so order matters.
- Copy the default channel group. In Admin › Data display › Channel groups, create a new group from the default, so that every other channel keeps Google's rules.
- Add one channel per major assistant, or one "AI assistants" channel if volumes are small. Use Session source (or Source) with matches regex, and add an OR condition on Medium exactly matches ai-assistant to catch anything Google recognises that your regex misses.
- Move the AI channels above Referral and above Organic Search in the order, so that no earlier rule captures them.
- Check the result against the Traffic acquisition report with Session source for the last 90 days, and look for AI-looking sources your rule does not catch.
- Review the regex every quarter. New assistants and new domains appear often.
Channel "AI assistants" (illustrative rule, adapt and test on your data)
Session source matches regex:
.*(chatgpt\.com|openai\.com|perplexity\.ai|gemini\.google\.com|copilot\.microsoft\.com|claude\.ai|chat\.deepseek\.com|grok\.com|meta\.ai|chat\.mistral\.ai|you\.com).*
OR Session medium exactly matches ai-assistant
The leading and trailing `.*` make the pattern match sub-domains and source values with a prefix. Test it before you rely on it: regex rules in GA4 are easy to get almost right. If you want one channel per assistant, split the pattern into separate channels ordered above a catch-all "Other AI" channel.
What GA4 will not show you
- Visits without a referrer. When an app or browser does not pass the referring page, the visit is recorded as Direct. In our experience this affects clicks from some mobile apps and desktop apps, and any link a user copies and pastes. ChatGPT's automatic `utm_source=chatgpt.com` tag helps, because GA4 reads the UTM even when the referrer is missing; other assistants do not tag links in the same way.
- Clicks from Google's own AI features. Clicks from AI Overviews and AI Mode arrive from Google and are counted as Organic Search, both in GA4 and in Search Console's Web totals. They cannot be separated today.
- Delayed journeys. Many buyers read an AI answer, then come back days later through a branded search or by typing your address. Last-click reporting credits those visits to Organic Search or Direct. Section 9 covers how to capture them.
- Orders placed through an assistant. Where assistants support in-chat or agent checkout, an order can reach you without a normal session. Tag these orders with an order source in your back end; our guide to web analytics explains how to add dimensions like this.
Once the channel is in place, build one exploration that shows, by AI source: sessions, engaged sessions, landing pages, key events, conversion rate, revenue and revenue per session, next to Organic Search as a benchmark. Landing pages are the most actionable view: they tell you which pages assistants send people to, and whether those pages deliver what the answer promised.
For marketers. Annotate your GA4 reports with the date the AI Assistant channel appeared (13 May 2026). Before it, AI traffic sat mostly in Referral, so a sudden "new channel" is a reporting change, not a growth spurt.
For leaders. Treat AI referral revenue as a floor, not the total. The real influence of AI answers is larger than what last-click analytics can see.
Section 6 · Google and Bing
Google and Bing now report AI impressions and citations, but not the clicks, so use them as a sanity check
Search Console's generative AI performance report
Google announced generative AI performance reports in Search Console on 3 June 2026, first for a subset of sites, and rolled them out to all websites worldwide by 31 August 2026. The report counts impressions: how many times links to your site were shown to a user in AI Overviews or AI Mode. You can break it down by page (the final URL after redirects), country, device and date, and filter between text-based and multimodal searches. A separate report covers Discover; Search Labs experiments are excluded.
Read it carefully. It does not show clicks, click-through rate, queries, average position or which passage was used. According to Search Engine Journal's summary of the launch, in AI Overviews a link has to be scrolled or expanded into view to count as an impression. In the chart, two of your URLs in the same answer count as one impression for the property; in the page table, each URL can receive one. Clicks from AI features stay inside the Web search performance report, mixed with other organic clicks. Google's own documentation states that sites appearing in AI features are included in overall search traffic in Search Console.
What it is good for:
- Page-level trends. Which of your pages are shown in AI features, and whether that number rises after you rewrite or restructure them.
- Market comparison. AI impressions by country show where Google's AI features expose your content most.
- A check on your sampled data. If a tool reports a sharp rise in Google AI citations but Search Console impressions are flat, question the tool before you celebrate.
Pair it with Search Console's branded queries filter, announced in November 2025 and available to all eligible sites since March 2026, which splits the Performance report into branded and non-branded queries. Google classifies queries automatically, you cannot edit the classification, and the filter is not available for sub-properties or low-traffic sites. A rising trend in branded impressions is one of the few signals of AI influence that reaches you through classic search.
Bing Webmaster Tools AI Performance
Microsoft launched an AI Performance report in Bing Webmaster Tools in beta on 10 February 2026. It covers Microsoft Copilot, Bing's AI summaries and selected partner integrations, and shows total citations, average cited pages, grounding queries (sample queries the AI used to find your content) and page-level citation activity over time. Like Google's report, it reflects citation frequency only: no clicks, no ranking and no view of how a page contributed to an answer. The grounding queries are its most useful feature for panel building, because they show real questions that led to your content.
Our view. The Google and Bing reports are free, first-party and based on real users, which no third-party tracker can claim. They are also partial. Use them to validate and to find pages worth working on, and use your prompt panel for everything they cannot see: competitors, other assistants, sentiment and accuracy.
Section 7 · Tools
Choose a tracking tool for its sampling method and data access, not its dashboard
Dozens of tools now track AI visibility, and our market report covers funding, pricing and consolidation. For measurement, what matters is how each tool collects answers and whether you can get the raw data out. The table below describes a selection as each vendor presents it on its own pages. We have not independently tested their accuracy.
| Tool | What it measures (as described by the vendor) | Engines covered (as documented) | Access and pricing signal |
|---|---|---|---|
| Profound | Visibility score, share of voice, citations and sentiment; modules for prompt volumes, agent analytics (how bots view, cite and refer to your pages) and SKU-level shopping visibility | ChatGPT, Perplexity, Claude, Gemini, Microsoft Copilot, DeepSeek, Google AI Overviews | Enterprise-oriented; pricing via the vendor |
| Peec AI | Visibility, position, sentiment and share of voice against competitors, tracked daily | Choose three models on standard plans; 13 models on Enterprise | Plans by prompt count (50, 150, 350); Looker Studio on Advanced; API on Enterprise |
| Otterly.AI | Brand mentions and citations on tracked prompts, GEO URL audits, agent analytics | ChatGPT, Google AI Overviews, Perplexity, Microsoft Copilot; Claude, Google AI Mode and Gemini as paid add-ons | From $29 a month (15 prompts); API and MCP access from the $189 plan (100 prompts) |
| Semrush AI Visibility Toolkit | AI Visibility Score against competitor median, share of voice, sentiment, mentions and citations; prompt tracking updated daily | Google AI Mode and ChatGPT; prompt tracking in 220+ countries and territories | $99 a month |
| Ahrefs Brand Radar | Mentions, citations, share of voice and estimated impressions weighted by search volume, from 448M+ search-backed prompts, plus custom prompts | AI Overviews, AI Mode, ChatGPT, Perplexity, Gemini, Copilot; Claude for custom prompts | Custom prompts from $50 a month; AI Visibility Index $199 a month |
| DataForSEO LLM Mentions API | Raw mention data, top domains, pages and brands in AI answers, AI search volume, monthly historical data from August 2025 | ChatGPT and Google AI Overviews prompt databases | Pay as you go: $0.10 per request plus $0.001 per row |
Disclosure: Henkan & Partners offers a GEO / AI search visibility service and uses the DataForSEO API in its own tooling.
Five questions to ask any vendor
- How many runs sit behind each number, and can you show the margin of error? If the answer is one run per prompt per week, the trend line is mostly noise.
- Do you query the consumer interface or the developer API, from which locations, and logged in or not? API answers can differ from what users see in the app.
- Can I see every raw answer, with the date, engine, location and cited URLs? Without raw answers you cannot audit accuracy or sentiment.
- Can I export the data, by API, file or MCP server? Your analysts, and increasingly your own AI agents, need to join it with analytics and revenue data.
- How do you handle model and interface changes? A good vendor logs them and tells you when a trend break is theirs, not yours.
Build, buy or both
For a single brand in one market, a subscription tool plus the free platform reports is usually enough. For multi-brand, multi-market e-commerce, we often combine a tracker with raw data from an API, so the team can build its own panel, re-run disputed prompts, check the vendor's figures and feed a warehouse. MCP servers, which let AI assistants such as Claude query a data source directly, now make it practical for an analyst to ask "which prompts did we lose to Brand B this month, and which sources did the answers cite?" in plain language. They do not remove the need for a fixed panel and a clear method.
Section 8 · The monthly routine
A four-week routine turns noisy AI data into decisions, and one page is enough to report it
AI visibility data is noisy and cheap to collect, which is a dangerous combination: teams drown in daily dashboards and react to random swings. A fixed monthly cycle, with daily collection running in the background, solves both problems.
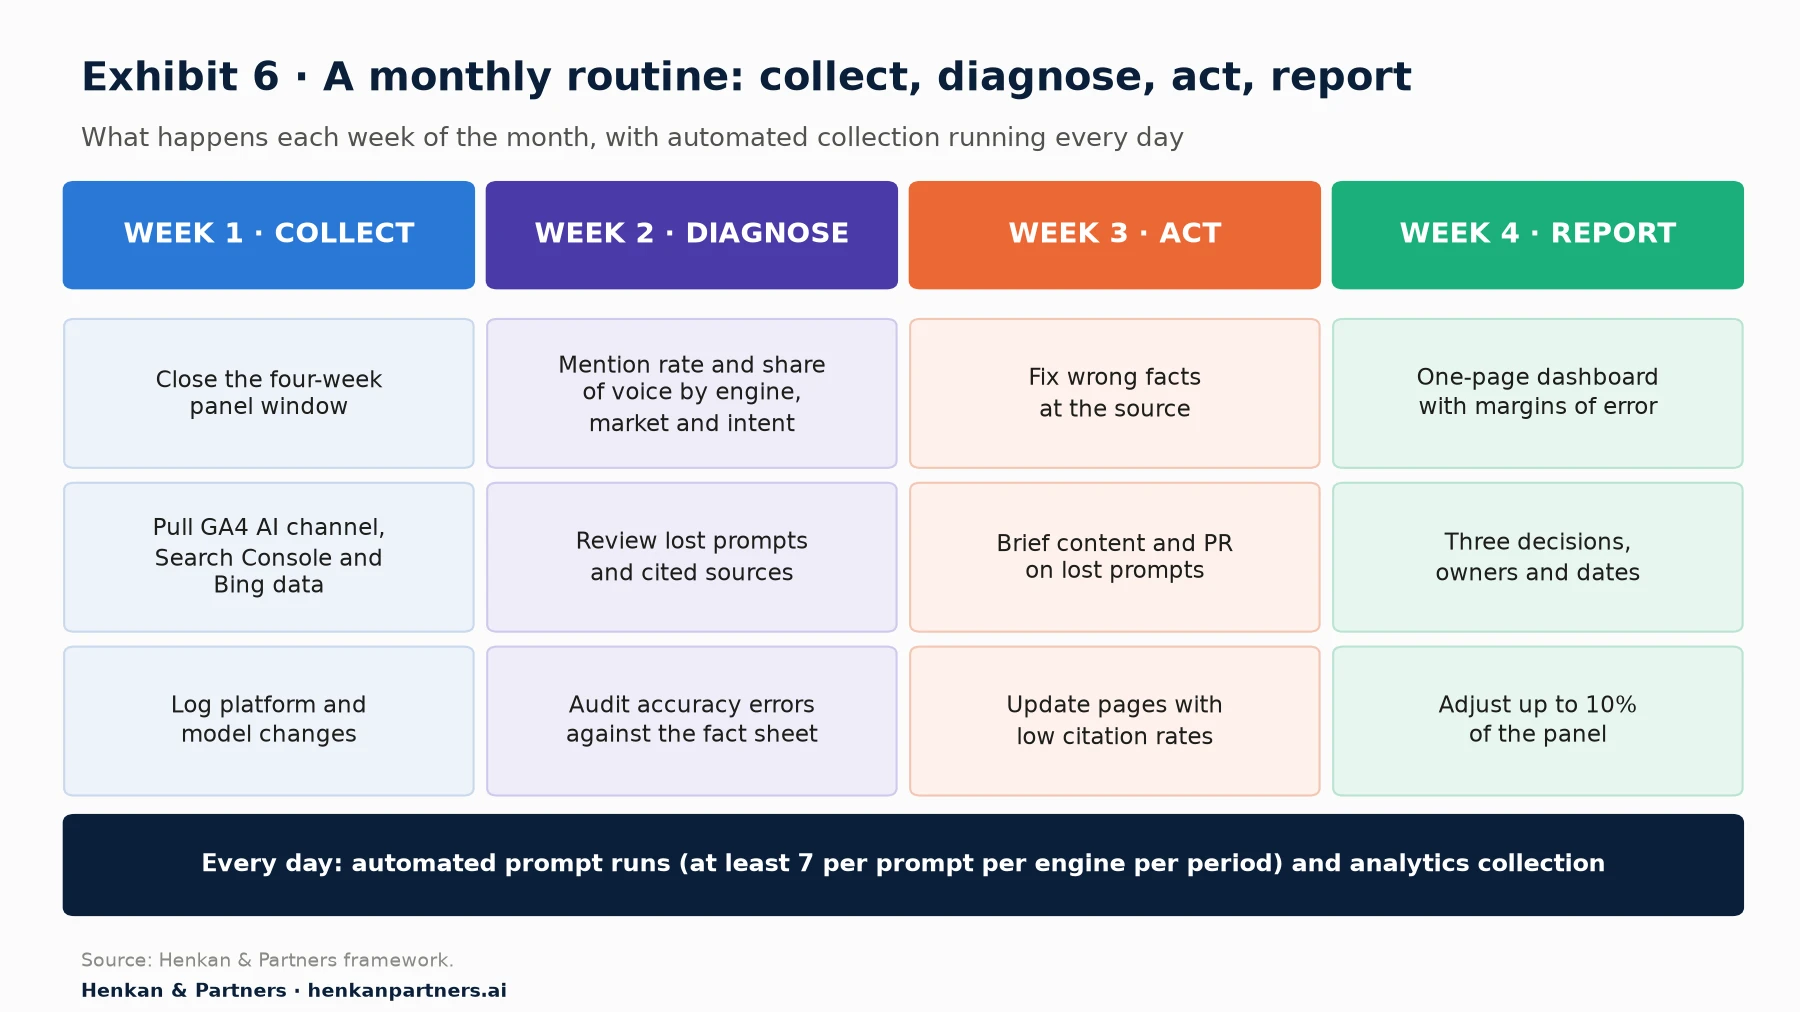
What this shows. The work is front-loaded on diagnosis and action, not on reporting. Collection runs daily and automatically; the humans spend their time on why numbers moved and what to change. Each month should end with a short list of decisions with owners, not a longer dashboard.
What goes on the one-page dashboard
| Block | Content | Comparison |
|---|---|---|
| 1. Headline | Mention rate and share of voice, total and by engine, with margin of error | Previous four weeks and same period last quarter |
| 2. Competitors | Share of voice versus four to eight named competitors | Change in rank among the set |
| 3. Journey stage | Mention rate for discover, consider and decide prompts | Where you gained or lost |
| 4. Accuracy | Accuracy rate and the three most damaging errors, with cited sources and owners | Errors fixed since last month |
| 5. Sources | Top domains and pages cited in answers, yours and third parties | New sources to pitch or fix |
| 6. Platform signals | Search Console AI impressions (top pages) and Bing citations | Trend versus panel citation rate |
| 7. Business | AI-referred sessions, conversion rate, revenue and revenue per session, plus survey share | Organic Search as a benchmark |
| 8. Decisions | Three actions for next month, with owner and date | Status of last month's actions |
Keep a change log under the dashboard: your own content releases, PR placements and technical changes, and known platform changes. Without it, nobody will remember in six months why share of voice jumped in March.
For marketers. Automate collection, not interpretation. The value of the monthly review is the conversation about why prompts were lost and which sources the assistants trusted.
For leaders. Ask for three decisions a month. If the AI visibility report never changes what the team does, it is a cost, not a measurement programme.
Section 9 · Revenue
Tie AI visibility to revenue with a chain of evidence, because no single attribution model captures it
The question leaders ask is simple: what is this worth? The honest answer is that no report shows the full value of being recommended by an assistant, because most of that value flows through visits and searches that analytics credits to other channels. What you can do is build a chain of evidence, from what you can measure precisely to what you can only estimate.
Start with the visible part, because it is growing in quality as well as volume. Adobe's data on US retail sites show a reversal over eighteen months.
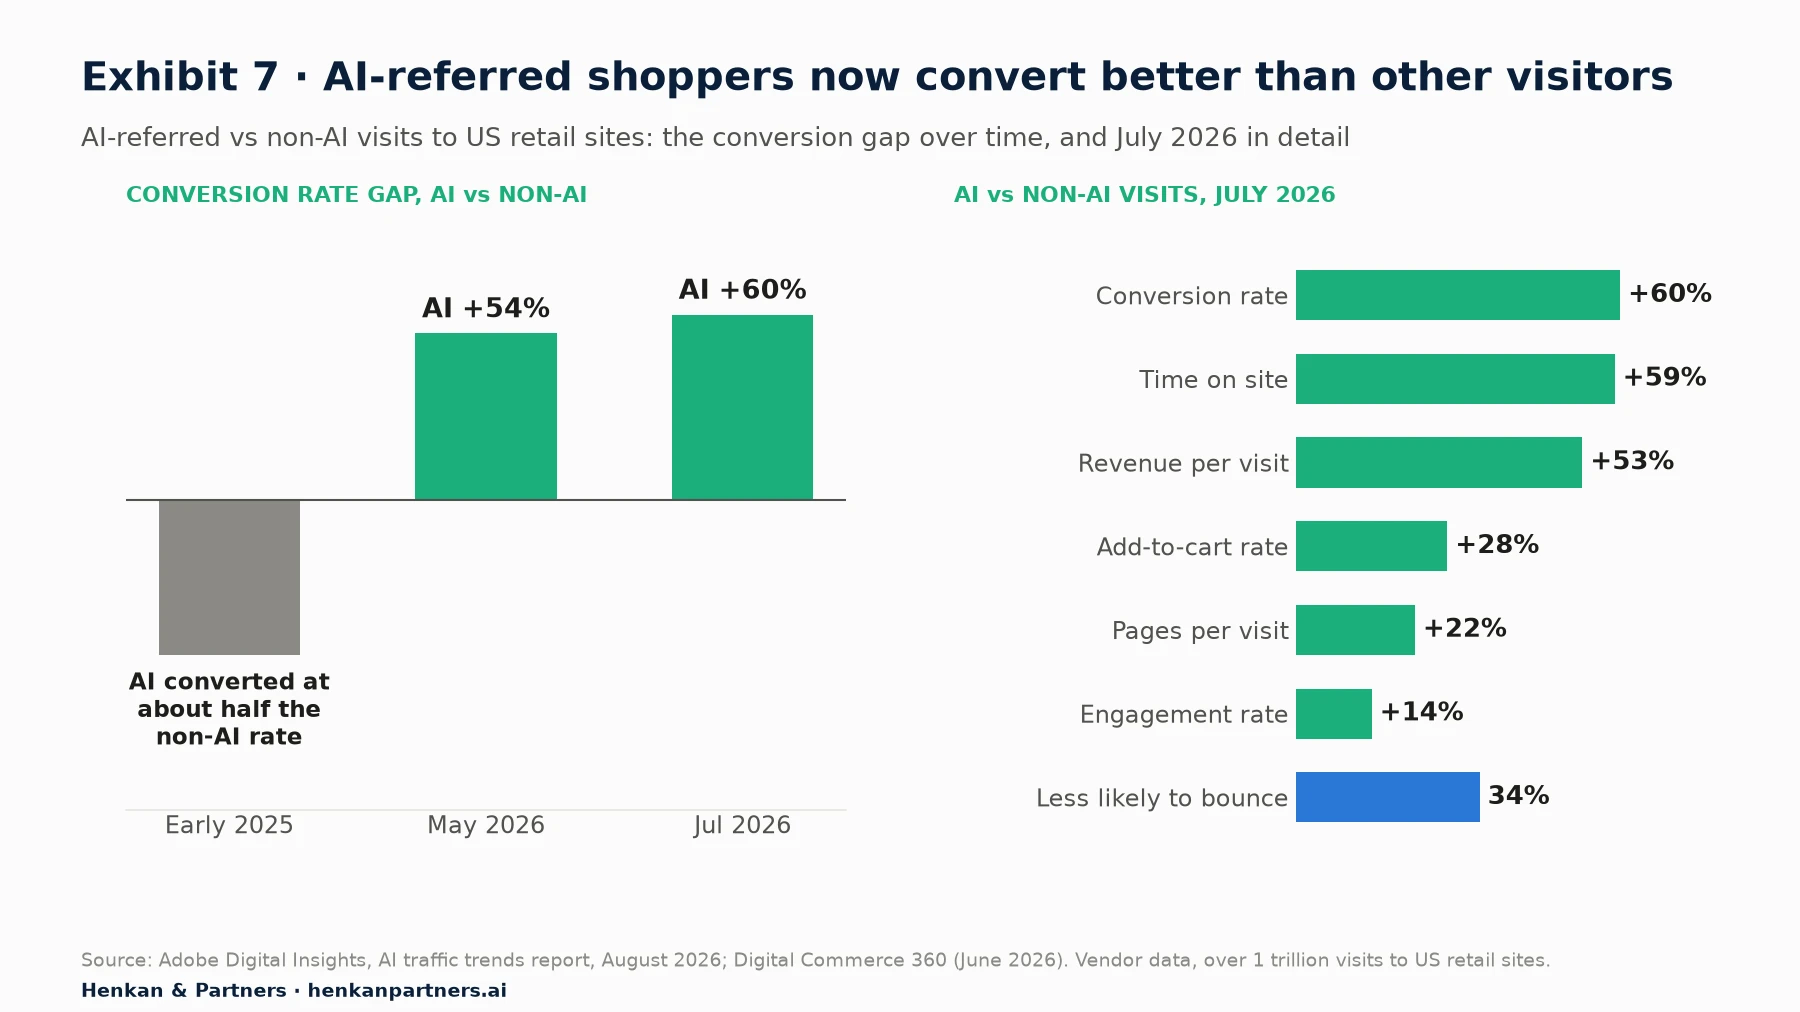
What this shows. In early 2025 AI-referred visitors converted at nearly half the rate of other traffic; by July 2026 AI-referred visitors converted 60% better and were worth 53% more revenue per visit. A plausible reason, in our view, is that AI visitors arrive later in their decision, after the assistant has done part of the research. These are averages across US retail; your own figures, split by assistant, are what matter for your business.
Ahrefs reported a more extreme version on its own site in June 2025: AI search sent 0.5% of its visitors but 12.1% of its sign-ups, a conversion rate 23 times that of traditional organic search (vendor data from one company, a software business, not a retailer). Treat it as a sign of what is possible, not a benchmark.
Five links in the chain
| Evidence | What it measures | How to get it | Confidence |
|---|---|---|---|
| 1. Direct AI revenue | Revenue from sessions referred by assistants | GA4 AI channel with e-commerce tracking | High, but a floor |
| 2. Assisted revenue | Conversions where an AI referral appeared earlier in the path | GA4 conversion paths report, or path analysis in BigQuery | Medium; only visible touches count |
| 3. Self-reported influence | Share of buyers who say an AI assistant helped them choose | Post-purchase survey: "How did you first hear about us?" with an AI assistant option | Medium; memory bias |
| 4. Brand demand | Trend in branded search impressions and direct traffic | Search Console branded queries filter, GA4 Direct | Low on its own; many causes |
| 5. Controlled change | Change in citations and AI impressions on pages you improved versus similar pages you did not | Search Console AI report by page, prompt panel by topic | Medium to high if designed well |
The fifth link deserves more use than it gets. Choose two comparable groups of pages, such as two sets of category guides with similar traffic. Improve one group (clearer answers, original data, fixed facts) and leave the other. Compare the change in Search Console AI impressions and in your panel's citation rate for the related prompts over the following six to eight weeks. It is not a randomised experiment, but it is far better evidence than a before-and-after chart of the whole site. Our experimentation work applies the same discipline to on-site changes.
Worked example: a monthly value estimate (illustrative)
A homeware retailer records 6,000 AI-referred sessions in a month, at a 3.1% conversion rate and a €95 average order value: about €17,700 of direct revenue. Conversion paths show a further €9,000 where an AI referral came earlier in the path (assisted). In its post-purchase survey, 4% of first-time buyers name an AI assistant as how they found the brand; applied to €600,000 of new-customer revenue that month, that suggests around €24,000 of self-reported influence, overlapping with the first two figures. The retailer reports the direct figure as the floor, the survey-based figure as the upper indication, and the trend of all three over time, rather than a single number with false precision.
Our view. Resist the pressure to produce a single ROI number for AI visibility this year. Report a floor, a range and a trend, and invest in the measurement that narrows the range: the survey question, the channel group and the controlled page tests. That is what makes next year's number credible.
Section 10 · What to do next
Five steps to measure AI search visibility this quarter
1. Fix the after-the-click data first
Check that the GA4 AI Assistant channel is receiving traffic, build a custom channel group with an AI assistants rule above Referral, and add an order source for any orders placed through assistants. Add an AI assistant option to your post-purchase survey. These steps are cheap and give you revenue figures from day one.
2. Switch on the free platform reports
Open Search Console's generative AI performance report and Bing Webmaster Tools AI Performance, export the first three months, and note your top pages in each. Turn on the branded queries filter if your property is eligible.
3. Write a prompt panel and a reference fact sheet
Draft 50 to 200 prompts per market from real customer language, split by journey stage and intent, with a fixed competitor set. Write the fact sheet that accuracy checks will use: prices, specifications, policies and key claims.
4. Take a four-week baseline before setting any target
Run the panel at least seven times per prompt per engine, on two tools if you are choosing between them, and calculate mention rate, share of voice, citation rate, top-3 rate, sentiment and accuracy with margins of error. Do not set targets until you know how much the numbers move on their own.
5. Start the monthly routine and ask for three decisions
Run the collect, diagnose, act, report cycle, publish the one-page dashboard and log every change. If you want help setting up the panel, the tracking or the dashboard, or an independent audit of what your current tool reports, talk to us.
FAQ
Frequently asked questions about measuring AI search visibility
Frequently asked questions
What is AI search visibility?
AI search visibility is how often, how prominently and how accurately AI assistants and AI search features, such as ChatGPT, Gemini, Perplexity, Copilot, Google AI Overviews and AI Mode, mention, recommend and link to your brand for questions relevant to what you sell. It is measured as rates across a fixed panel of prompts run many times, plus the traffic and revenue those answers send to your site.
How do you measure AI search visibility?
Combine three sources. Sample answers from the main assistants with a fixed prompt panel, run each prompt several times, and calculate mention rate, share of voice, citation rate, prominence, sentiment and accuracy. Use Search Console's generative AI report and Bing Webmaster Tools AI Performance for first-party impressions and citations. Use GA4 to measure AI-referred sessions, conversions and revenue.
What are the most important AI visibility metrics?
Mention rate (share of answers that name you), share of voice against named competitors, citation rate (answers that link to your pages), prominence (how often you are among the first three brands named), sentiment, factual accuracy, AI-referred sessions and the conversions and revenue from those sessions.
How do I track ChatGPT and other AI traffic in Google Analytics 4?
Since 13 May 2026, GA4 reports an AI Assistant default channel for sessions whose referrer matches a recognised assistant, with the medium ai-assistant. For more control, create a custom channel group with a rule on session source matching a regex such as chatgpt.com, perplexity.ai, gemini.google.com, copilot.microsoft.com and claude.ai, placed above Referral. ChatGPT also adds utm_source=chatgpt.com to its links.
Does Google Search Console show AI Overviews and AI Mode data?
Yes, partly. The generative AI performance report, available to all sites worldwide since 31 August 2026, shows impressions of links to your pages in AI Overviews and AI Mode by page, country, device and date. It does not show clicks, queries or position. Clicks from AI features are included in the Web search performance report and cannot be separated.
How many prompts should I track for AI visibility?
In our experience, 50 to 200 prompts per market, split by journey stage and intent, is enough for most brands. Precision depends on the number of answers as well as prompts: run each prompt at least seven times per engine per reporting period. About 700 answers per engine gives a margin of roughly plus or minus 3.4 points on a 30% mention rate.
How often should I measure AI visibility?
Collect daily or several times a week, because answers vary from run to run, but report monthly on a rolling four-week window. Researchers recommend aggregating over two to four weeks. Only treat a change as real if it persists across two periods and is larger than the margin of error.
Do AI referrals convert better than other traffic?
On average, increasingly yes. Adobe reports that AI-referred visitors to US retail sites converted 60% better than non-AI traffic in July 2026 and generated 53% more revenue per visit, after converting worse in early 2025 (vendor data). Results vary by site and assistant, so measure your own.
Which tools measure AI visibility?
Dedicated trackers include Profound, Peec AI and Otterly.AI; SEO suites offer the Semrush AI Visibility Toolkit and Ahrefs Brand Radar; the DataForSEO LLM Mentions API provides raw data for your own dashboards. Free first-party data comes from Google Search Console, Bing Webmaster Tools and Google Analytics 4. Choose on sampling method, engine coverage and data export, not dashboard design.
Can I measure AI visibility for free?
Partly. GA4, Search Console's generative AI report and Bing Webmaster Tools AI Performance are free and cover traffic, Google AI impressions and Copilot citations. Measuring mentions, share of voice and accuracy across ChatGPT, Gemini and Perplexity requires sampling answers, either manually, with your own scripts or with a paid tool.
Key terms
- AI search visibility
- How often, how prominently and how accurately AI assistants and AI search features name and link to your brand. It matters because assistants shape shortlists before buyers reach your site.
- Generative engine optimization (GEO)
- The practice of improving how a brand is represented in AI-generated answers. It matters because measurement is only useful if it guides this work.
- Prompt panel
- A fixed set of real buyer questions run regularly on selected assistants to measure visibility. It matters because every inside-the-answer metric is only as good as the questions asked.
- Mention rate
- The share of sampled answers that name your brand. It matters because it is the simplest and most stable measure of presence in AI answers.
- Share of voice
- Your brand's mentions as a share of all mentions of you and a fixed set of competitors. It matters because it shows whether you are winning the shortlist, not just appearing on it.
- Citation rate
- The share of answers that link to at least one of your URLs. It matters because a citation is the most direct route from an answer to a visit.
- Top-3 rate
- The share of your mentions where you are among the first three brands named. It matters because it is more stable than an average position and closer to what a buyer notices.
- Accuracy rate
- The share of answers mentioning you whose facts about you are all correct. It matters because a wrong price or policy can cost a sale even when you are recommended.
- Non-deterministic output
- The property of AI models that the same prompt can produce different answers. It matters because visibility must be measured over many runs, with a margin of error.
- Margin of error
- The range around a measured rate within which the true rate probably lies, here at 95% confidence. It matters because it tells you whether a monthly change is real or noise.
- AI Assistant channel
- A GA4 default channel, added in May 2026, for sessions whose referrer matches a recognised AI assistant. It matters because it gives a first, free view of AI-referred traffic and revenue.
- Custom channel group
- A user-defined set of GA4 channel rules, applied retroactively, evaluated in order. It matters because it lets you control and split how AI traffic is classified.
- Generative AI performance report
- A Search Console report of impressions of your pages in Google AI Overviews and AI Mode. It matters because it is the only first-party data on Google AI visibility, though it has no clicks.
- Grounding query
- A search query an AI system runs to find sources for its answer, shown in Bing's AI Performance report. It matters because it reveals real questions that lead to your content.
- Chain of evidence
- A set of complementary measures, from direct revenue to controlled page tests, used together to estimate value. It matters because no single attribution model captures AI influence.
Sources
All sources were checked in September 2026. Conductor, Similarweb, SparkToro, Product.ai, Adobe and Ahrefs figures are vendor data or vendor-funded research; tool features and prices are as described on each vendor's own pages and were not independently tested. Exhibits 3 and 6 and Tables 2, 3, 5 and 6 are Henkan & Partners frameworks based on our experience; Exhibit 5 is our own calculation using the standard binomial margin-of-error formula. Examples labelled illustrative are not client data.
- Google Analytics Help (2026). What's new in Google Analytics: AI Assistant channel.
- Google Analytics Help (2026). Default channel group.
- Google Analytics Help (2026). Custom channel groups.
- Google Search Console Help (2026). Generative AI performance report (Search).
- Google Search Central (2026). Introducing Search generative AI performance reports in Search Console.
- Search Engine Journal (2026). Google now reports AI search impressions: how to read them.
- Google Search Central (2026). AI features and your website.
- Google Search Central (2025). Introducing the branded queries filter in Search Console; Search Engine Journal (2026). Google answers questions about Search Console's branded queries filter.
- Search Engine Land (2026). Bing Webmaster Tools officially adds AI Performance report.
- OpenAI Help Center (2026). Publishers and developers FAQ.
- Conductor (2025). The 2026 AEO / GEO Benchmarks Report and press release via Business Wire. Vendor data.
- Similarweb (2026). AI search stats 2026: market share, referral and citation data. Vendor data.
- SparkToro (2026). AIs are highly inconsistent when recommending brands or products. Vendor research.
- Schulte, J., Bleeker, M. & Kaufmann, P. (2026). Don't Measure Once: Measuring Visibility in AI Search (GEO), arXiv 2604.07585.
- Columbia Journalism Review, Tow Center (2025). AI search has a citation problem.
- Product.ai (2026). AI shopping divergence study. Vendor data.
- Adobe Digital Insights (2026). AI traffic trends report, August 2026. Vendor data.
- Digital Commerce 360 (2026). Adobe: AI-referred traffic to retail sites doubles in a year. Vendor data.
- Ahrefs (2025). Does AI search traffic convert better than traditional search? For Ahrefs, yes. Vendor data.
- Profound (2026). Platform overview.
- Peec AI (2026). Pricing.
- Otterly.AI (2026). Pricing.
- Semrush (2026). AI Visibility Toolkit.
- Ahrefs (2026). Brand Radar.
- DataForSEO (2026). LLM Mentions API.
- Henkan & Partners. The Essential Guide to Generative Engine Optimization, AI Search Optimisation for E-commerce Brands, The AI Search Visibility Market, 2023–2026, How GA4 Actually Works, The Essential Guide to Web Analytics and The Essential Guide to Voice of Customer.