Guide
The Essential Guide to Conversion Rate Optimisation (CRO)
Alexandre Suon · 2026-09-28
Conversion rate optimization (CRO) is the discipline of finding out why visitors do not buy, fixing it, and proving that the fix worked. This guide explains what CRO is and is not, how to measure it on revenue and profit rather than conversion rate alone, which benchmarks to trust, where e-commerce sites lose sales, how to run a CRO programme with or without much traffic, and what AI changes.
Executive summary
- CRO is a research discipline, not a set of tricks or a synonym for A/B testing. It combines analytics, user research and controlled experiments to remove the reasons people fail to buy. A/B testing is how you prove a change worked; research is how you find changes worth testing.
- Measure revenue and profit per visitor, not conversion rate alone. A discount can lift conversion and still lose money. In our illustrative example, a 10% coupon raises conversion by 15% and revenue per visitor by 3.5%, but cuts profit per visitor by about 16%.
- Benchmarks are wide, so compare with yourself first. IRP Commerce put the average conversion rate of UK and Irish online shops at 2.23% in August 2026, from 0.57% in baby products to 5.81% in arts and crafts. Among 2,800 Shopify stores, Littledata found an average of 1.4% and a top-10% threshold of 4.7%. Contentsquare reports that desktop converts 74% better than mobile, which brings 69.9% of traffic.
- The largest losses are in known places. Baymard rates 46% to 78% of leading sites "mediocre" or worse on search, product lists, product pages or checkout, and estimates that better checkout design alone could lift conversion by 35.26% for a large site. The top reason for abandoning checkout is extra costs (40%), an offer problem, not a design one.
- Most changes do not win, and winners are smaller than they look. Published success rates range from 8% of tests at Airbnb Search to 33% at Microsoft. At Airbnb, six winning tests added up to 7.2%, but a holdout group measured 4%. Honest CRO reporting uses holdouts and corrected estimates.
- AI makes tests faster to build, not better to choose. Prompt-built variants cut build time by about 89% in our own 19-test study, and vendors such as Optimizely now ship variation agents. The constraints that remain are research quality, traffic, QA and judgement.
Section 1 · Definition
Conversion rate optimization is a research discipline, not a bag of tricks
Conversion rate optimization (CRO) is the systematic process of increasing the share of website or app visitors who complete a desired action, such as buying, by researching why they fail to act, changing the experience to remove those reasons, and measuring the effect with controlled experiments or other reliable evidence.
The acronym is CRO, and in British English it is written conversion rate optimisation. In e-commerce, the desired action is usually an order, but it can be an add-to-basket, a sign-up, a subscription or a second purchase. "Conversion" is simply the share of visits or visitors that reach that goal.
CRO sits between marketing and product. Marketing brings visitors to the site; CRO makes sure that the experience they find turns as many of them as possible into customers, at a healthy margin, without damaging trust. That is why the best CRO work often looks like product management: understanding customers, deciding what to change and checking that it worked.
What CRO is not
- Not just A/B testing. An A/B test is the measurement tool. Without research, you are testing guesses. Our essential guide to A/B testing covers the testing part in depth; this guide covers the whole discipline around it.
- Not a list of hacks. "Change the button to red", "add a countdown timer" or "use social proof everywhere" are tactics copied from other sites. What worked for one audience, product and price often does nothing, or harm, on yours.
- Not only about the conversion rate. A higher conversion rate that comes from discounts, lower-value orders or more returns can reduce profit. CRO is about value per visitor.
- Not a one-off project. A redesign or an audit finds problems once. A CRO programme keeps finding, fixing and learning as customers, competitors and products change.
- Not a way to rescue a weak offer. If your prices, delivery times or product range are not competitive, design changes will only move the numbers so far. As Section 6 shows, the main reasons shoppers leave checkout are about the offer.
Our view. The simplest test of whether a team does CRO or just runs tests: ask where the last ten test ideas came from. If the answer is "brainstorms and competitor sites", the team is guessing. If it is "funnel data, session replays, survey answers and a usability study", it is doing CRO.
Section 2 · Metrics
Conversion rate is the starting metric, but revenue and profit per visitor decide
The conversion rate is the number of conversions divided by the number of sessions or users, expressed as a percentage. Tools differ in what they count, so always check the definition before comparing numbers. Google Analytics 4, for example, can report conversion per session or per user, and a shop's own platform may count orders per visit.
Conversion rate = orders ÷ sessions × 100
Revenue per visitor (RPV) = revenue ÷ visitors = conversion rate × average order value
Profit per visitor = conversion rate × (average order value − product cost − delivery, payment and returns costs per order)
Revenue is a product of traffic, conversion and order value, as we explain in the e-commerce market equation. Because the terms multiply, a change that improves one can quietly worsen another. That is why most mature CRO teams make revenue per visitor their primary test metric and watch profit per visitor, return rate and customer lifetime value as guardrails, the metrics that must not get worse.
Worked example: a discount that wins on conversion and loses on profit (illustrative)
A shop converts 2.0% of visitors, with an average order of €80. After product costs of €40 and €10 of delivery, payment and handling per order, it keeps €30. It tests a 10% site-wide coupon against no coupon.
| Metric | Control (no coupon) | Variant (10% coupon) | Change |
|---|---|---|---|
| Conversion rate | 2.0% | 2.3% | +15% |
| Average order value | €80 | €72 | −10% |
| Revenue per visitor | €1.60 | €1.66 | +3.5% |
| Margin per order | €30 | €22 | −27% |
| Profit per visitor | €0.60 | €0.51 | −16% |
The same logic applies to less obvious changes. Free-delivery thresholds, bigger "add to basket" buttons on cheap accessories or aggressive upsells can each move conversion or order value in one direction and returns, margin or repeat purchase in the other. Pick the metric that reflects the business goal before the test starts, not after the results arrive.
For marketers. Report RPV next to conversion rate in every test readout, and segment it by device and new versus returning visitors.
For leaders. Ask for one agreed success metric per programme, ideally revenue or contribution per visitor, and a short list of guardrails. It stops teams from celebrating wins that cost money.
Section 3 · Benchmarks
Benchmarks vary tenfold, so your own trend matters more than the industry average
"What is a good conversion rate?" is the most common CRO question and the one with the least useful answer. Averages depend on who is in the sample, how conversion is defined, and the mix of traffic, devices, prices and repeat customers. Still, benchmarks help you size the gap and spot where you are unusually weak.
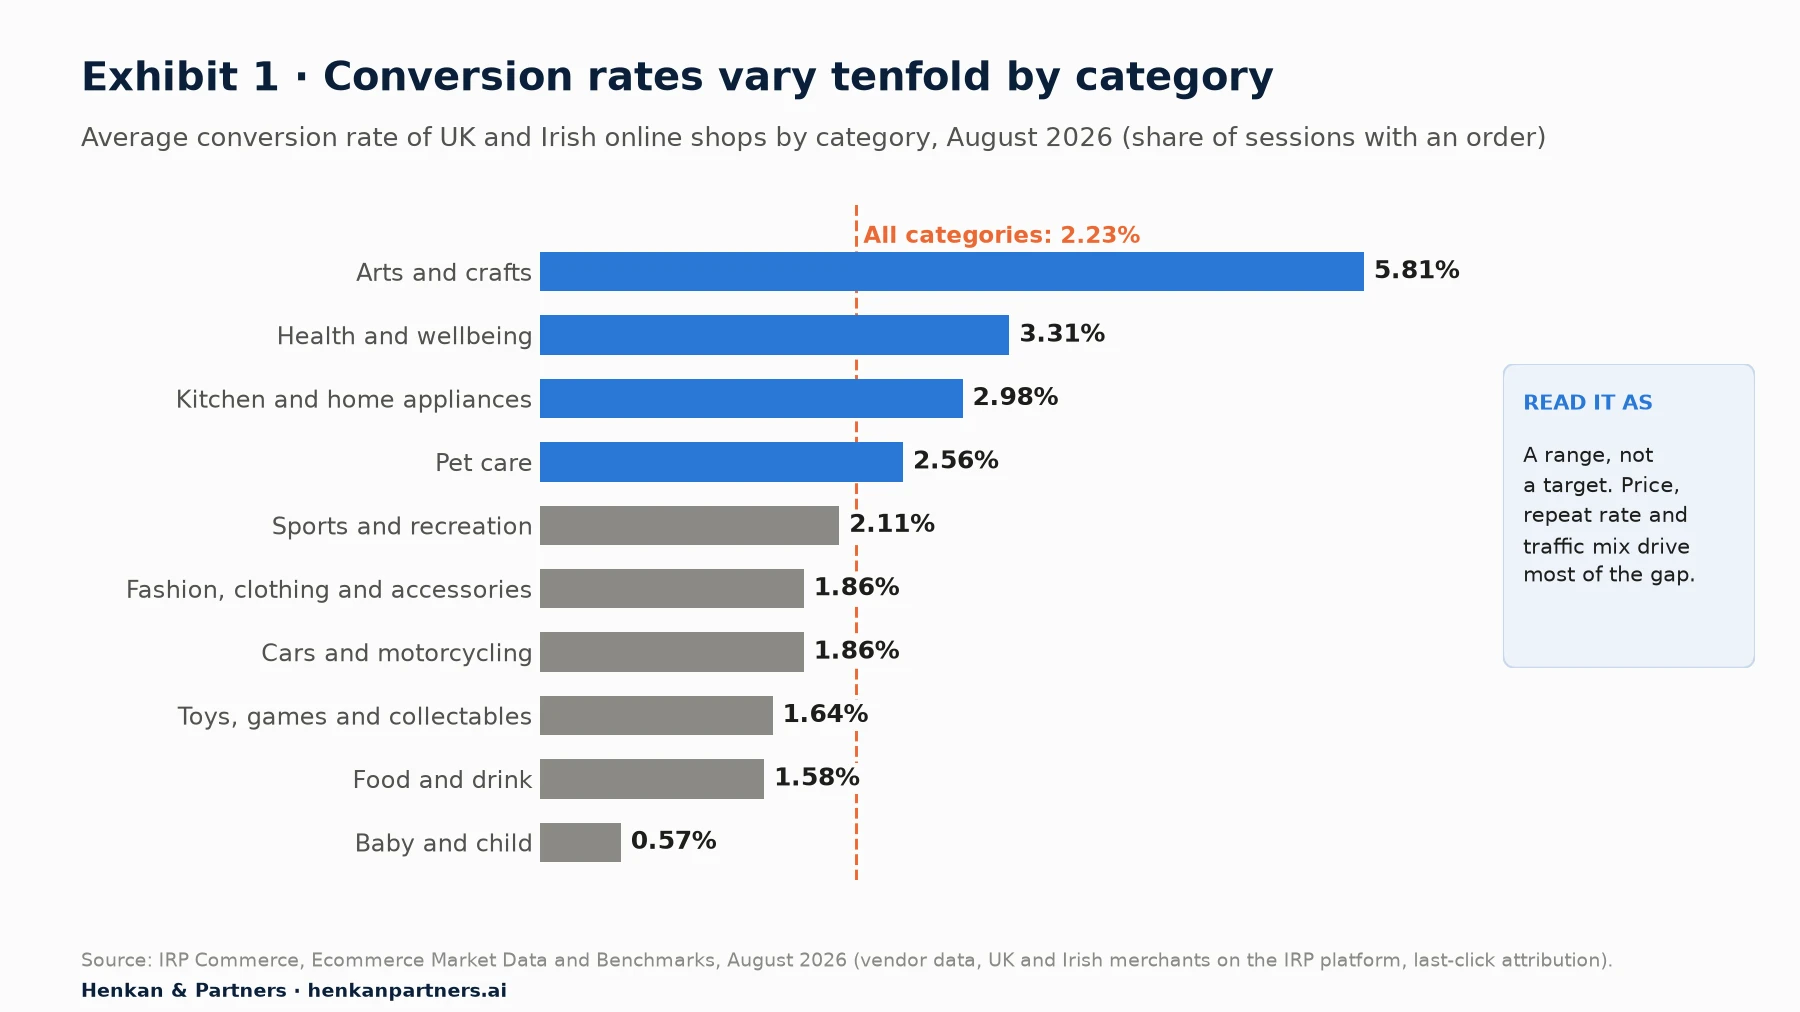
What this shows. Conversion rates range from 0.57% to 5.81% depending on what you sell. Categories with cheaper, repeat or planned purchases convert more; high-consideration categories convert less. IRP's all-category average rose from 1.85% in August 2025 to 2.23% in August 2026, a reminder that month-to-month benchmarks move a lot.
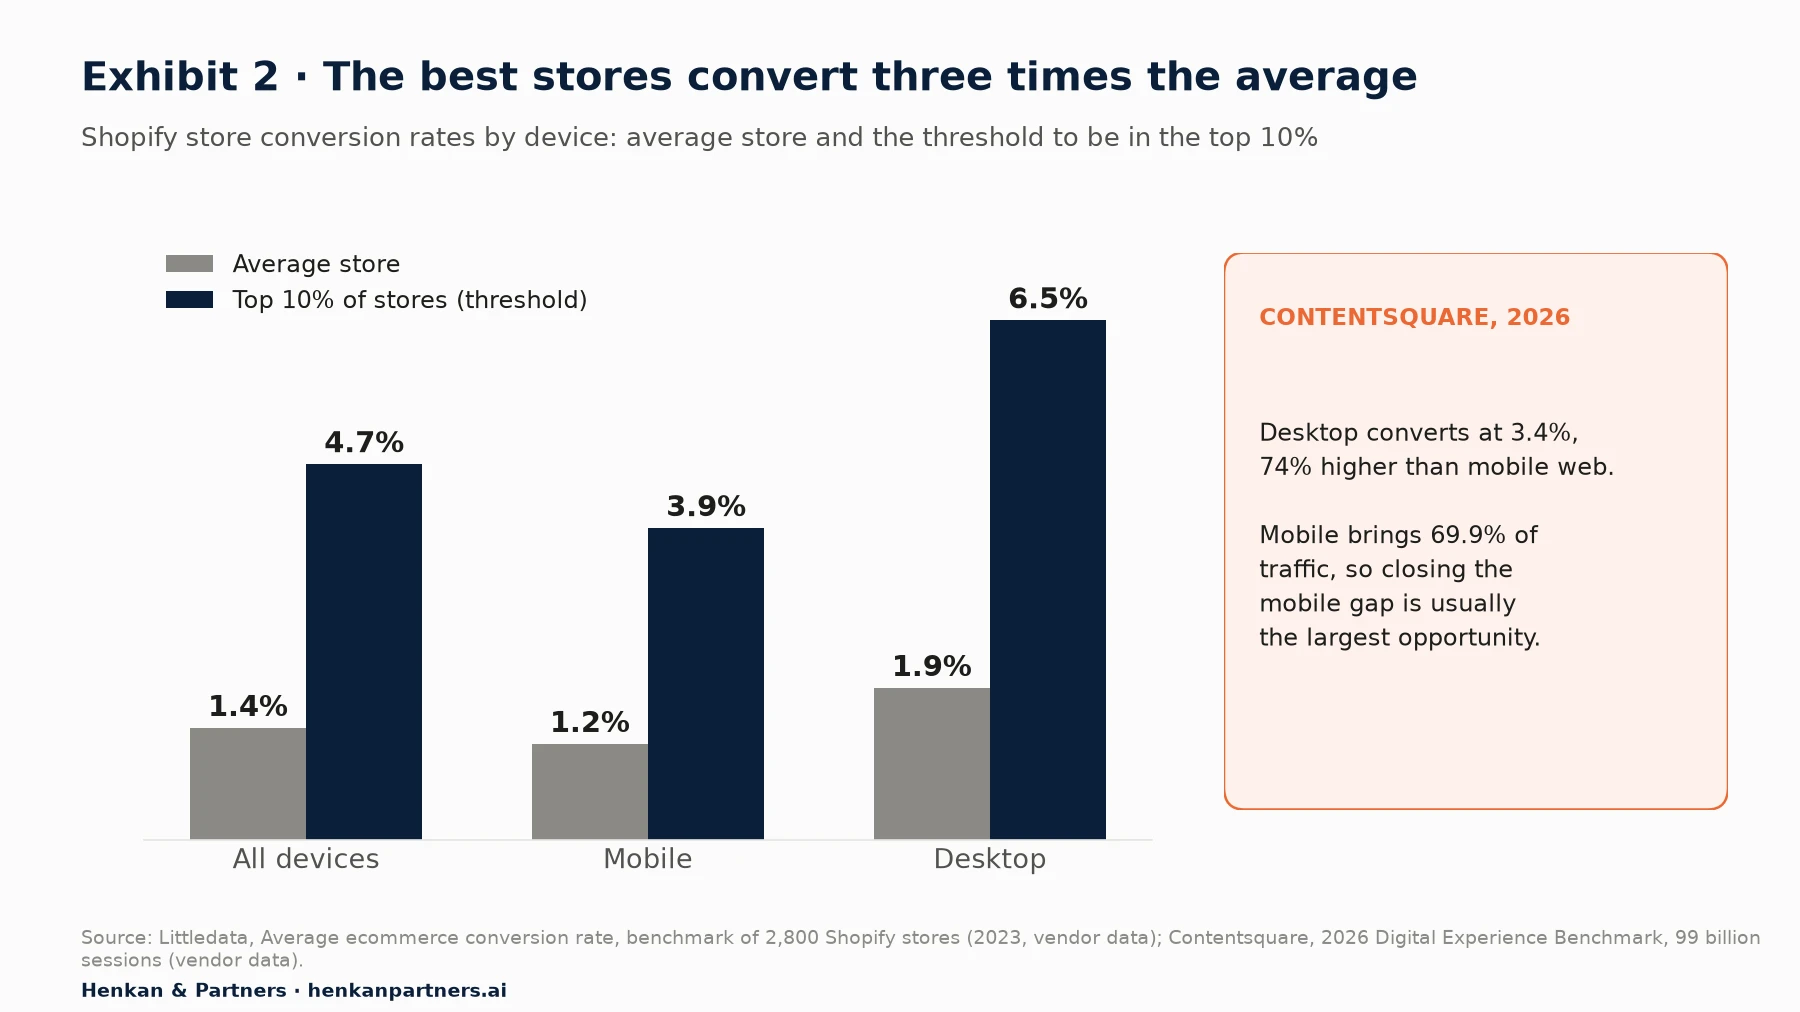
What this shows. The best stores convert about three times the average on every device. Desktop converts better everywhere, but most visits are on mobile, so the mobile experience is where the largest pool of lost orders usually sits. Both datasets come from vendors, so treat them as ranges, not targets.
| Source | Sample | Headline figure | Use it for |
|---|---|---|---|
| IRP Commerce (vendor data) | UK and Irish merchants on the IRP platform, monthly | 2.23% average, August 2026 | Category comparisons and monthly trend |
| Littledata (vendor data) | 2,800 Shopify stores, 2023 | 1.4% average; top 10% above 4.7% | Where a Shopify store sits in the distribution |
| Contentsquare (vendor data) | 99 billion sessions, 6,000+ sites, 2026 | Desktop 3.4%, 74% above mobile; returning visitors 2.9% vs new 1.7% | Device, channel and visitor-type gaps |
| Baymard Institute | 50 studies of cart abandonment | 70.22% average documented cart abandonment | Sizing checkout losses |
Contentsquare's 2026 data also shows two gaps worth checking in your own analytics. Returning visitors convert at 2.9% against 1.7% for new visitors, and paid search converts at 2.8%, the highest of the paid channels. AI-referred traffic, from assistants such as ChatGPT, converted at 1.3% in the fourth quarter of 2025, a conversion rate up 55% in a year and the only channel whose conversion grew. The mix of these sources explains much of the difference between two shops' conversion rates, which is why our guide to e-commerce acquisition and retention channels matters for CRO too.
Our view. Benchmark yourself against your own last 12 months, split by device, channel and new versus returning visitors. An external average tells you whether a gap might exist; your own segments tell you where it is. Our e-commerce KPIs and benchmarks guide sets out which metrics to track alongside conversion rate and what good looks like for each.
Section 4 · The process
A CRO programme is a loop: research, hypotheses, prioritisation, testing and learning
Every serious CRO method, whatever it is called, follows the same loop. Research finds where and why visitors fail. Hypotheses turn those findings into specific, testable changes. Prioritisation decides which to do first. Testing proves which ones work. Learning feeds the result, win or loss, back into the next round of research.
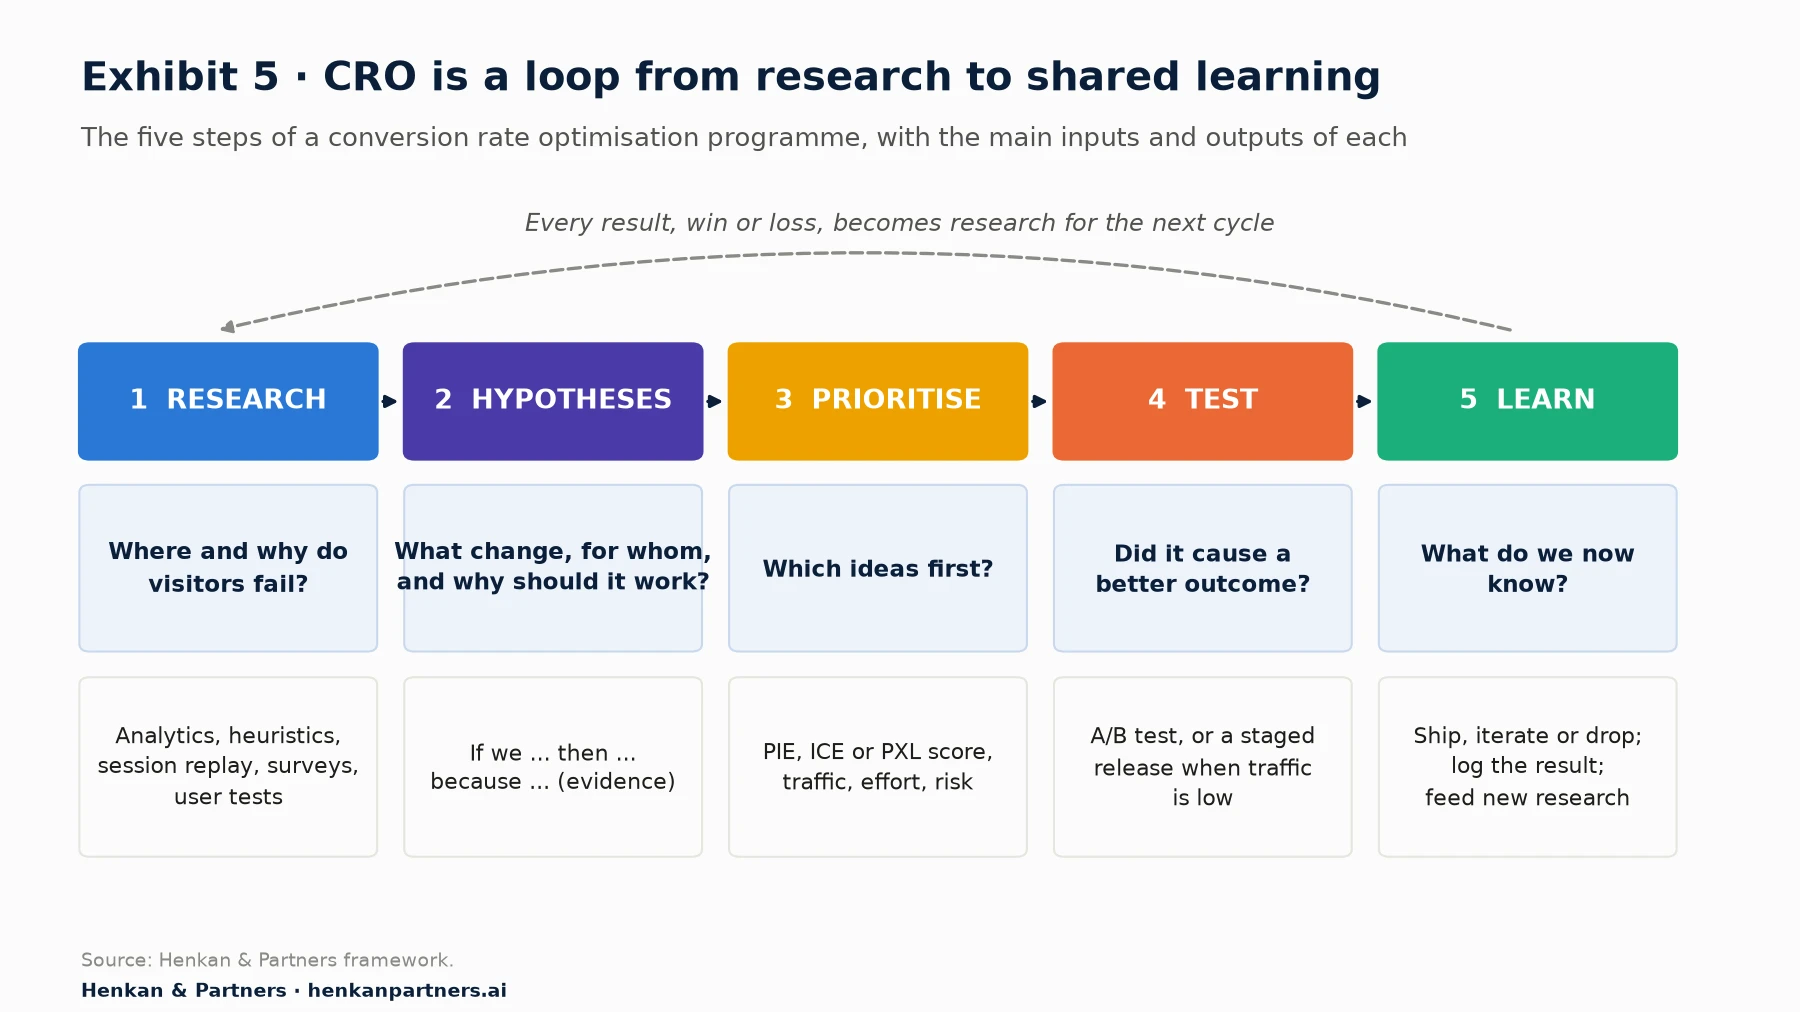
What this shows. The loop matters more than any single step. Programmes that skip research test weak ideas; programmes that skip learning repeat the same mistakes. The output of a good cycle is not only a winning change but a better understanding of customers.
Write hypotheses that can be proven wrong
A good hypothesis names the change, the audience, the expected effect and the evidence behind it. A useful template is: Because we saw [evidence], we believe that [change] for [audience] will [effect on metric]. We will know when [success metric] moves by [minimum effect] without [guardrail] getting worse. If you cannot fill in the evidence, you have an idea, not a hypothesis. Put it back into research.
Choose a prioritisation framework, then use it consistently
Every team has more ideas than capacity. Three scoring models are widely used. PIE, created by Chris Goward, scores Potential (how much the page can improve), Importance (how valuable its traffic is) and Ease (how hard it is to test). ICE, from Sean Ellis, the growth marketer who coined "growth hacking", scores Impact, Confidence and Ease from 1 to 10 and averages them. PXL, published by Peep Laja at CXL in 2016, replaces most subjective scores with yes-or-no questions, such as whether the idea is supported by user testing, qualitative feedback or analytics, and whether the change is noticeable within five seconds.
| Framework | How it scores | Strength | Weakness | Best for |
|---|---|---|---|---|
| PIE (Goward) | Potential, Importance, Ease; rated per page or area | Quick; points effort at valuable pages | Potential is a guess | Choosing which pages or templates to work on |
| ICE (Ellis) | Impact, Confidence, Ease, each 1–10, averaged | Simple; works for any growth idea | Laja's critique: "if I could guess what the impact would be, why would I even test it?" | Small teams, early programmes |
| PXL (CXL) | Mostly binary questions on evidence, visibility, traffic and effort | Rewards research; less room for opinion | Longer to score; needs a research habit | Established programmes with a research backlog |
Our view. The framework matters less than two habits: scoring evidence explicitly (so that ideas backed by research rise) and adding revenue at stake (traffic × value of the page), so that a perfect idea on a page with 200 visits a week does not jump the queue. In our experience, a lightweight PXL with a revenue column works for most e-commerce teams.
Section 5 · Research methods
Good tests start with research that combines numbers and people
Research answers two questions: where visitors drop out (quantitative) and why (qualitative). You need both. Analytics can show that 70% of mobile visitors leave the delivery step; only replays, surveys or user tests explain that the postcode field rejects spaces.
| Method | Answers | Typical output | Watch out for |
|---|---|---|---|
| Web and product analytics | Where do visitors drop out, by device, channel and segment? | Funnel and page reports, segments with unusual drop-off | Tracking gaps and consent loss; check data quality first |
| Heuristic review (expert audit) | What breaks known usability principles? | A list of issues scored by severity | Expert opinion; confirm with data before big bets |
| Session replay and heatmaps | What do visitors actually do on the page? | Clips of errors, rage clicks, confusion | Anecdotes; look for patterns across many sessions |
| On-site surveys and reviews (voice of customer) | What do customers say stopped them or nearly stopped them? | Themes, verbatims, objections | Leading questions; small or biased samples |
| Moderated or remote user tests | Why do people struggle with a task? | Observed problems, severity, quotes | Small samples; not for measuring size of effect |
| Technical and speed audits | Is the site fast and error-free on real devices? | Core Web Vitals, JavaScript errors, broken flows | Lab tests differ from real-user data |
Each method has its own guide on this site. Start with web analytics to find where the losses are, use session replay to watch what happens there, and voice of customer programmes to hear why. For user testing, small samples are enough to find problems: Jakob Nielsen of the Nielsen Norman Group argued in 2000 that a study with five participants finds about 85% of usability problems, and recommended running three rounds of five users rather than one round of fifteen.
For marketers. Keep a single research log: every insight, its source, the pages and segments it affects, and the hypotheses it produced. It is the raw material for prioritisation and stops teams from rediscovering the same problems every year.
For leaders. Fund research as part of CRO, not as a separate project. In our experience, programmes that spend a meaningful share of their time on research run fewer tests but win more of them.
Section 6 · Where sales are lost
Most e-commerce sales are lost in search, product lists, product pages, checkout and speed
E-commerce funnels are remarkably similar across sectors: a visitor lands, finds products through navigation or search, evaluates a product page, adds to basket and checks out. Baymard Institute, which benchmarks leading US and European sites against hundreds of usability guidelines, finds that most sites still perform poorly at each step.
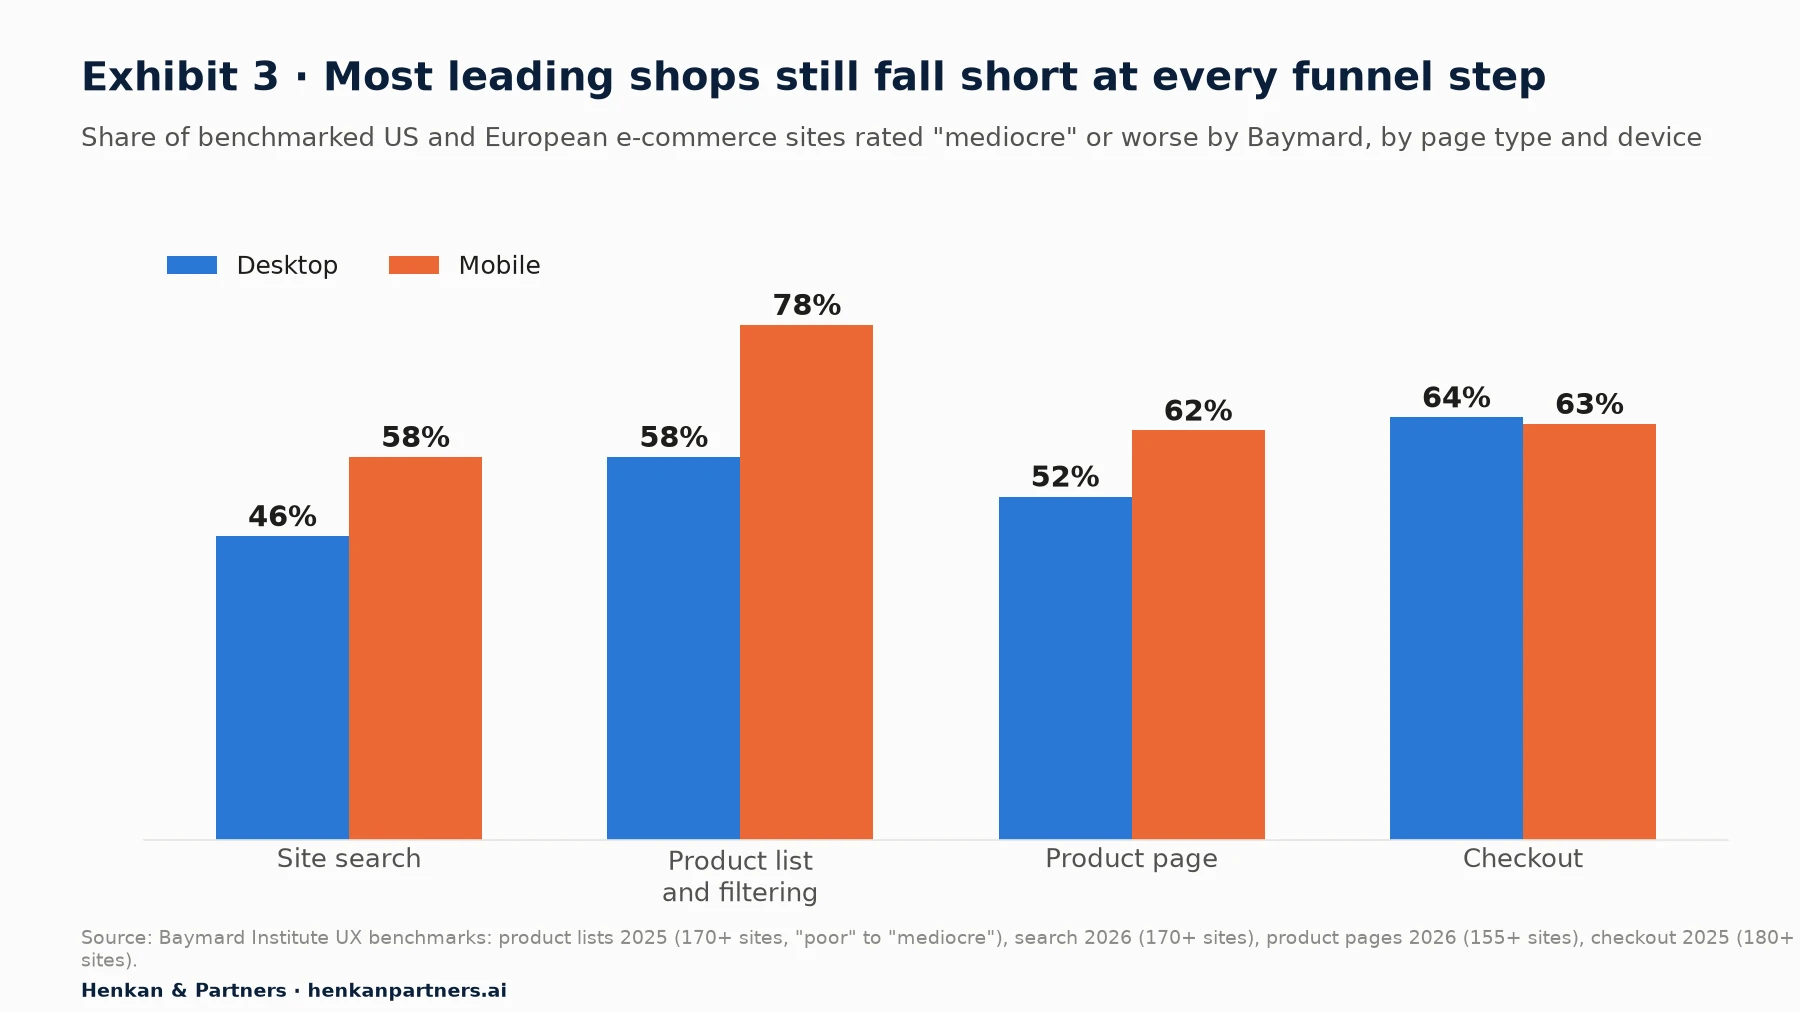
What this shows. Even large, well-funded sites fall short at every step, and mobile is usually worse than desktop. Product lists on mobile are the weakest area, with 78% of sites rated poor to mediocre. The benchmarks come from different years and slightly different scales, so compare the pattern, not individual points.
Site search
Baymard reports that 56% of sites fail to adequately support search, and that roughly half of its test participants prefer search to find products. Failures are concentrated in queries that real shoppers type: 54% of sites have issues with abbreviations and symbols, 44% with compatibility searches ("case for iPhone 15"), 43% with use-case searches ("shoes for running in rain") and 66% with non-product searches such as "returns". Check your own zero-result searches and the conversion rate of visitors who search: they are often your most motivated buyers.
Product lists and filters
Baymard found that 51% of sites do not provide five essential filter types and 69% do not provide four essential sorting types. On large catalogues, filters are how people narrow hundreds of products to a few; weak filters push them to leave or to search, with the problems above.
Product pages
The product page is where the buying decision happens. Baymard's 2026 benchmark finds that 62% of mobile sites are mediocre or worse, that 67% do not give an estimate of the total order cost on the product page, and that 44% do not show or link to the returns policy. Missing size information, few or low-quality images and hidden delivery costs are common, fixable reasons why good traffic does not add to basket. Contentsquare notes that one visit in three now starts on a product page, and nearly two-thirds of those landings bounce.
Basket and checkout
Baymard's average of 50 studies puts the documented cart abandonment rate at 70.22%. Many of those shoppers were never going to buy that day, but a large share leave because of problems you can fix.
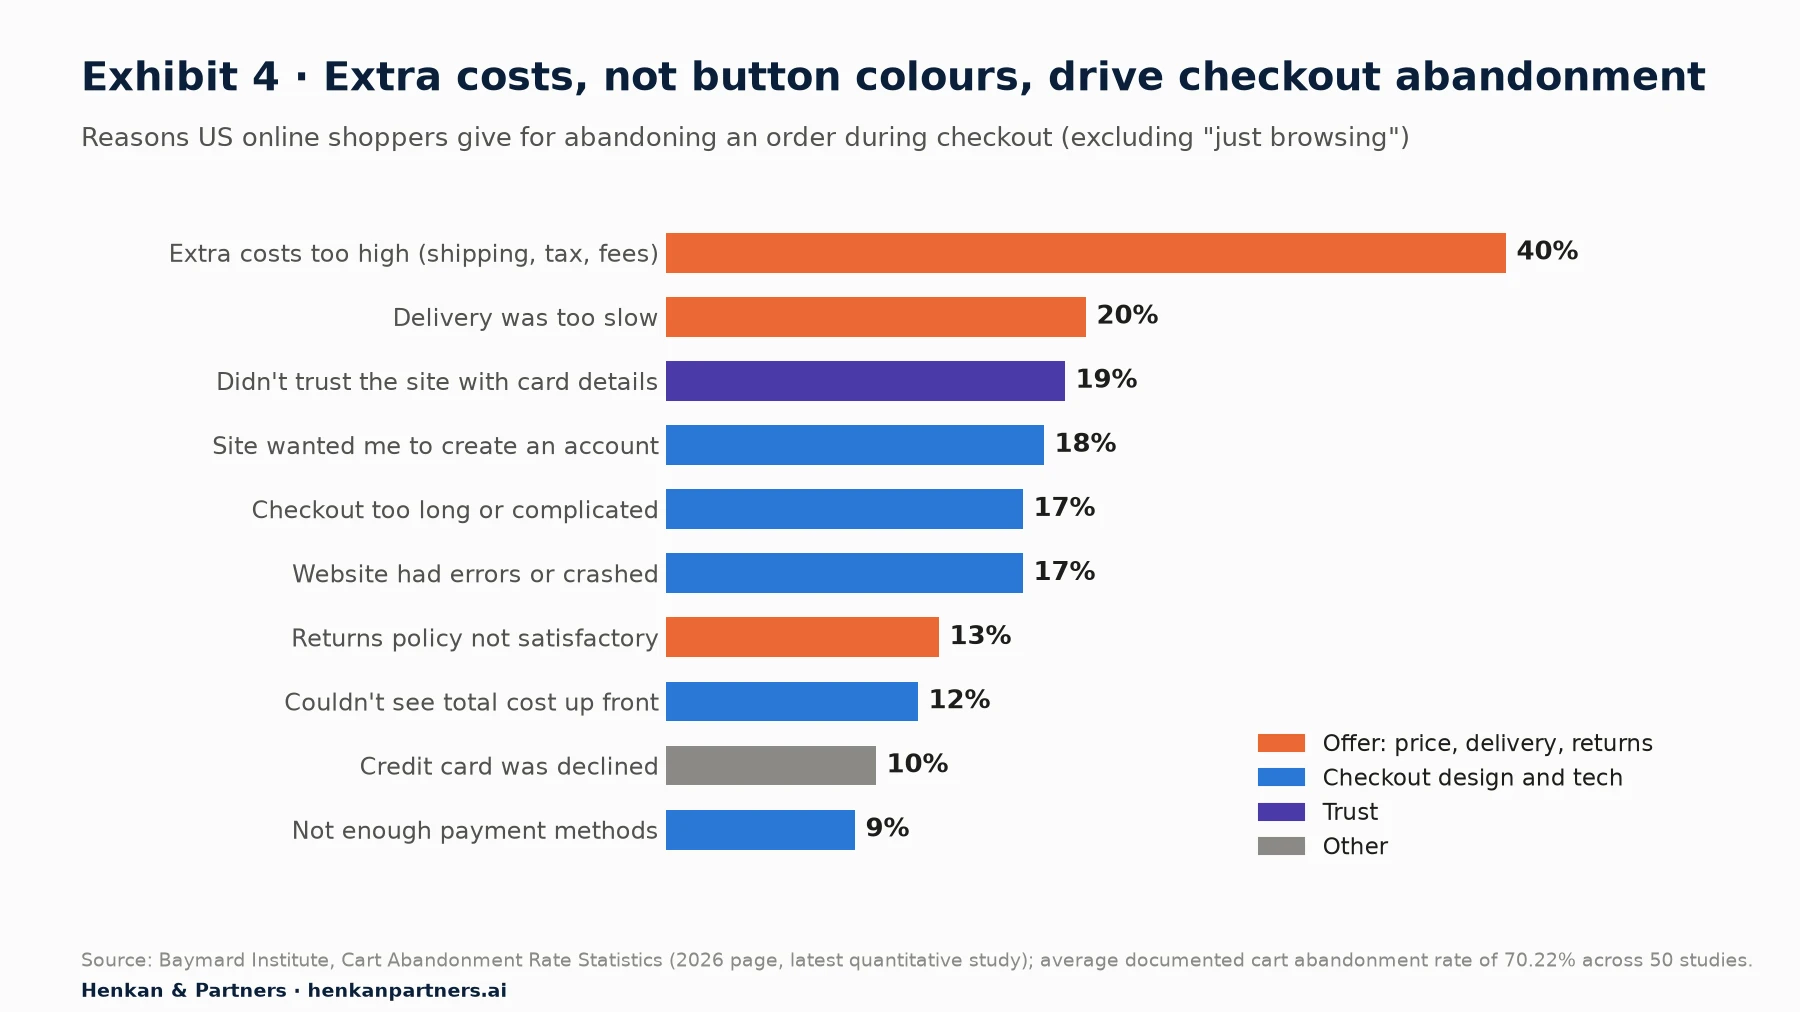
What this shows. The single biggest reason, extra costs, is about the offer and how early it is shown, not about layout. Design and technical issues (forced accounts, long forms, errors, missing payment methods) still add up to a large share. Fixing both requires CRO teams to work with pricing, logistics and IT, not only with designers. Our product page and checkout optimisation playbook turns these findings into specific changes to test.
Baymard estimates that the average large e-commerce site can gain a 35.26% increase in conversion rate through better checkout design alone. The average US checkout contains 23.48 form elements, against an ideal of 12 to 14. Its checkout benchmark finds that 62% of sites do not make guest checkout the most prominent option and 94% do not use adaptive error messages that explain what went wrong.
Speed and Core Web Vitals
Speed affects every step. In Milliseconds Make Millions, a 2020 study commissioned by Google and prepared by Deloitte across 37 European and American brand sites and more than 30 million sessions, a 0.1-second improvement in four mobile speed metrics was associated with an 8.4% increase in retail conversions and a 9.2% increase in average order value, and a 10.1% increase in travel conversions. The study measured correlation across sites, not a controlled test, so treat it as a strong direction rather than a forecast for your shop.
Google's Core Web Vitals give you the thresholds to aim for, measured at the 75th percentile of real page loads on mobile and desktop: Largest Contentful Paint (how fast the main content appears) within 2.5 seconds, Interaction to Next Paint (how fast the page responds to a tap or click) of 200 milliseconds or less, and Cumulative Layout Shift (how much the page jumps while loading) of 0.1 or less. Testing tools and third-party tags add weight, so a CRO programme must watch its own impact on speed.
Section 7 · Priorities and low traffic
Start with high-traffic friction, and use other evidence when you cannot A/B test
With research done, the first changes to make are usually not tests at all. Broken flows, errors, missing payment methods and misleading delivery information should simply be fixed. Testing is for changes whose effect is uncertain.
Where to look first (Henkan & Partners framework)
- Fix what is broken. JavaScript errors, broken promo codes, failing payment methods, slow templates on mobile. Measure before and after, but do not wait for a test.
- Show costs and delivery early. Delivery price, date and returns conditions on product pages and in the basket address the top reasons in Exhibit 4.
- Remove checkout friction. Guest checkout first, fewer fields, address lookup, clear errors, the payment methods your customers use.
- Help people find products. Search that tolerates synonyms and typos, zero-result pages that recover, filters that match how customers choose.
- Make product pages answer the buying questions. Sizing, materials, compatibility, real images, reviews, stock and delivery date.
- Then test value propositions and merchandising. Messaging, bundles, recommendations and pricing presentation, where the effect is genuinely uncertain.
What to do when you cannot A/B test
An A/B test needs enough visitors to detect a realistic effect. The smaller the effect and the lower the baseline conversion rate, the more visitors you need.
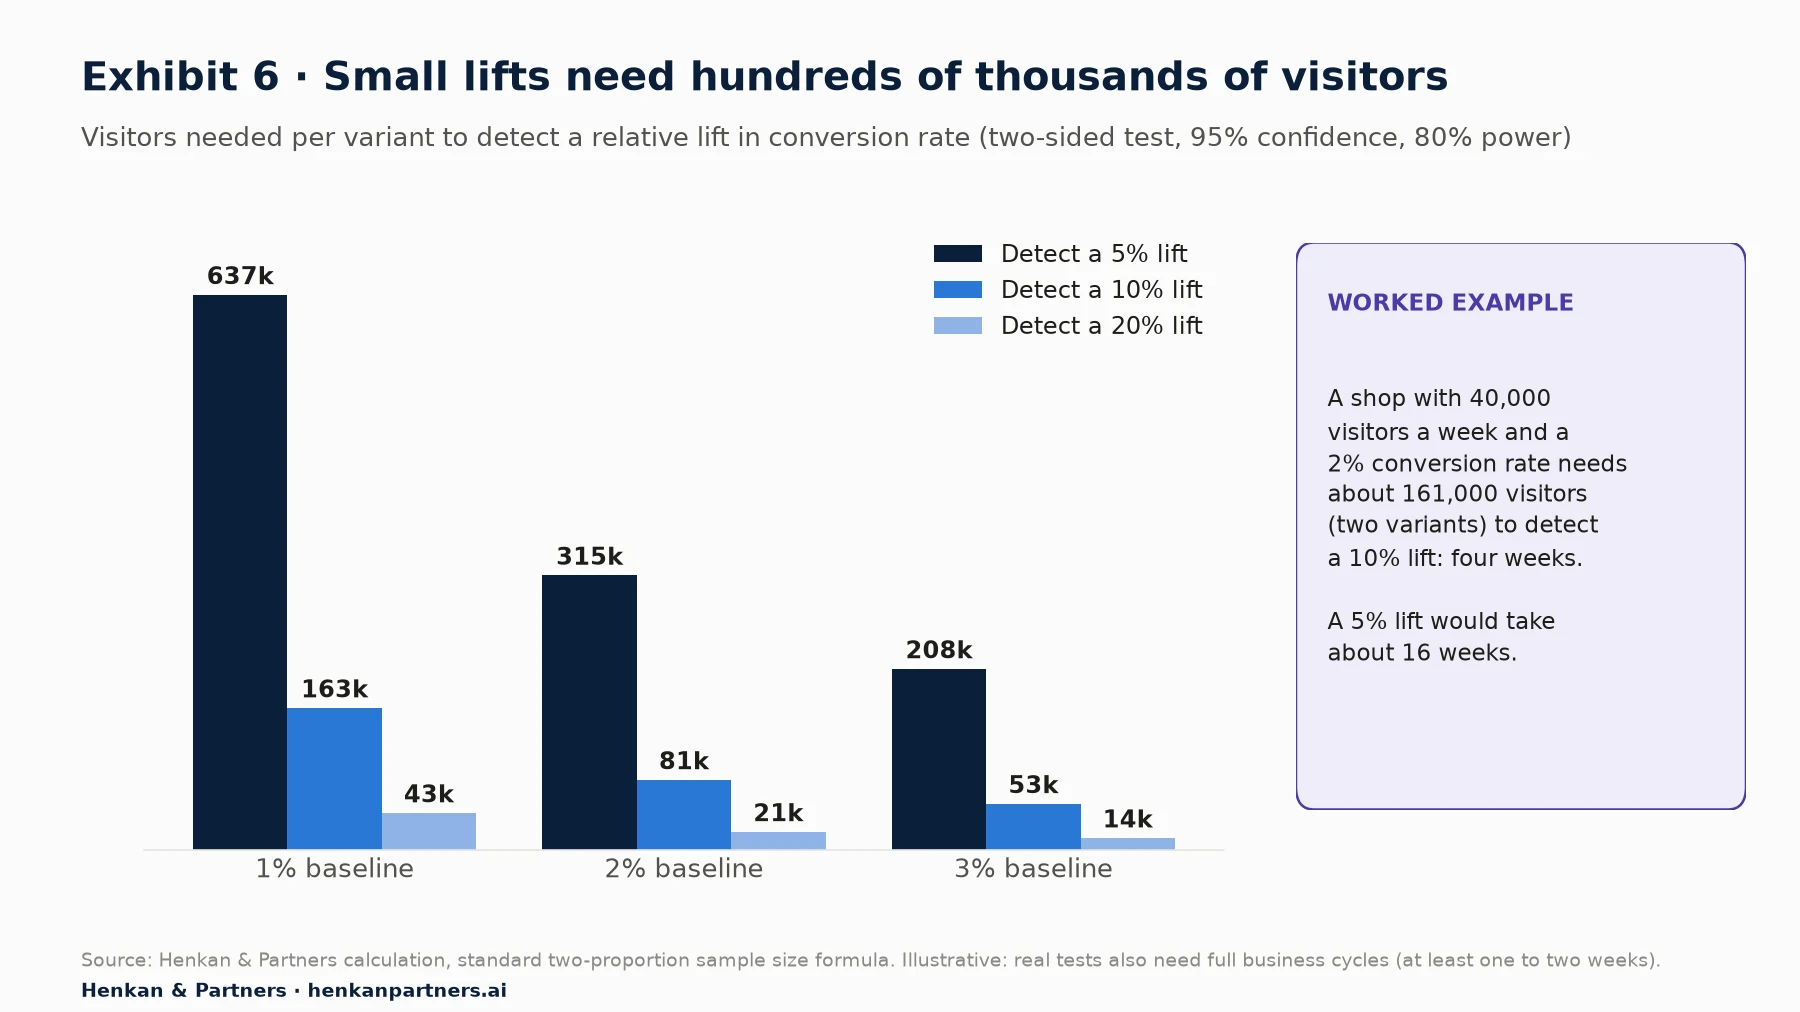
What this shows. Detecting a 5% lift at a 2% conversion rate takes about 315,000 visitors per variant; a 20% lift takes about 21,000. Small sites can only detect large effects, so they should test bold changes, use higher-traffic metrics such as add-to-basket, or rely on other evidence.
If your traffic is too low for the effects you expect, CRO still works; the evidence changes:
- Test bigger changes. A redesigned product page or a new checkout can produce effects large enough to detect; a new button label will not.
- Use a metric closer to the change. Clicks on a filter or add-to-basket rate have more events than orders and need fewer visitors. Check that they relate to revenue.
- Rely on qualitative evidence. Five-user tests, surveys and replays can justify fixing obvious problems without a test.
- Use before-and-after comparisons carefully. Compare the same weeks year on year and similar segments, and write down what else changed (campaigns, prices, seasonality). It is weaker evidence than a test, so reserve it for low-risk changes.
- Stage releases. Roll out to one category, country or device first and compare against the rest.
For leaders. A low-traffic site that runs under-powered tests gets false winners and false losers, which is worse than no test. Ask your team for the minimum detectable effect of every test before it launches. The A/B testing guide shows how to size one.
Section 8 · The programme
A CRO programme needs a small team with research, design, development and analysis skills
A working CRO programme needs five capabilities, whether they sit in one person or ten: strategy and prioritisation (a lead who owns the roadmap and the metric), research and analytics, UX and copy design, front-end development and QA, and statistics and reporting. It also needs a sponsor who can unblock changes in pricing, logistics and IT, because many of the biggest opportunities sit outside the website team.
| Model | What it is | Pros | Cons | Suits |
|---|---|---|---|---|
| In-house team | Employees own CRO end to end | Deep product and customer knowledge; builds lasting capability | Hard to hire all skills; slow to start; risk of a one-person programme | Large shops with steady budgets |
| Agency | An external firm runs research and tests | Fast start; broad experience across clients | Less context; knowledge can leave with the contract | Shops that need results before building a team |
| Fractional team | Part-time senior specialists embedded in your team | Senior skills without full-time hires; transfers know-how | Needs an internal owner; shared attention | Mid-size brands building capability |
| Hybrid | Internal lead with external development, research or analysis | Keeps ownership in-house; flexible capacity | Coordination overhead | Most growing e-commerce teams |
Disclosure: Henkan & Partners runs fractional experimentation teams for e-commerce brands, one of the models above. Whichever model you choose, the internal owner matters most. Without someone in the business who owns the roadmap, can get changes shipped and shares results, external help turns into a stream of reports.
The CRO tool stack
- Analytics: a web or product analytics tool with trustworthy e-commerce tracking and useful custom dimensions.
- Behaviour and feedback: session replay, heatmaps, on-site surveys and review analysis.
- Experimentation: a client-side or server-side testing platform, with the statistics and QA workflow your team can use. See our comparison of client-side and server-side testing.
- Knowledge: a searchable log of research, hypotheses, tests and results, so the organisation remembers what it learned.
- AI assistants: increasingly, AI tools that summarise research, draft hypotheses and build variants (Section 10).
Tools rarely limit a programme; people and process do. The culture that lets teams test, accept losing results and share learning is the subject of our article on building a culture of experimentation.
Section 9 · ROI
Measure CRO's return honestly: most tests lose, winners shrink, and holdouts tell the truth
CRO is often sold with case studies of huge wins. They exist: at Bing, a small change to how ad headlines were displayed increased revenue by 12%, which Ron Kohavi and Stefan Thomke reported in Harvard Business Review would come to more than $100 million a year in the United States alone. But they are rare, and a programme's return depends on the many tests that do not win.
| Organisation | Share of tested ideas that improved the target metric |
|---|---|
| Microsoft | 33% |
| Bing | 15% |
| Booking.com, Google Ads, Netflix | 10% |
| Airbnb Search | 8% |
Low win rates are not a failure of CRO; they are why testing beats opinion. A test that stops a harmful change from shipping saves money. But they have a consequence for how you report results: if you only add up the winners, you overstate what the programme delivered.
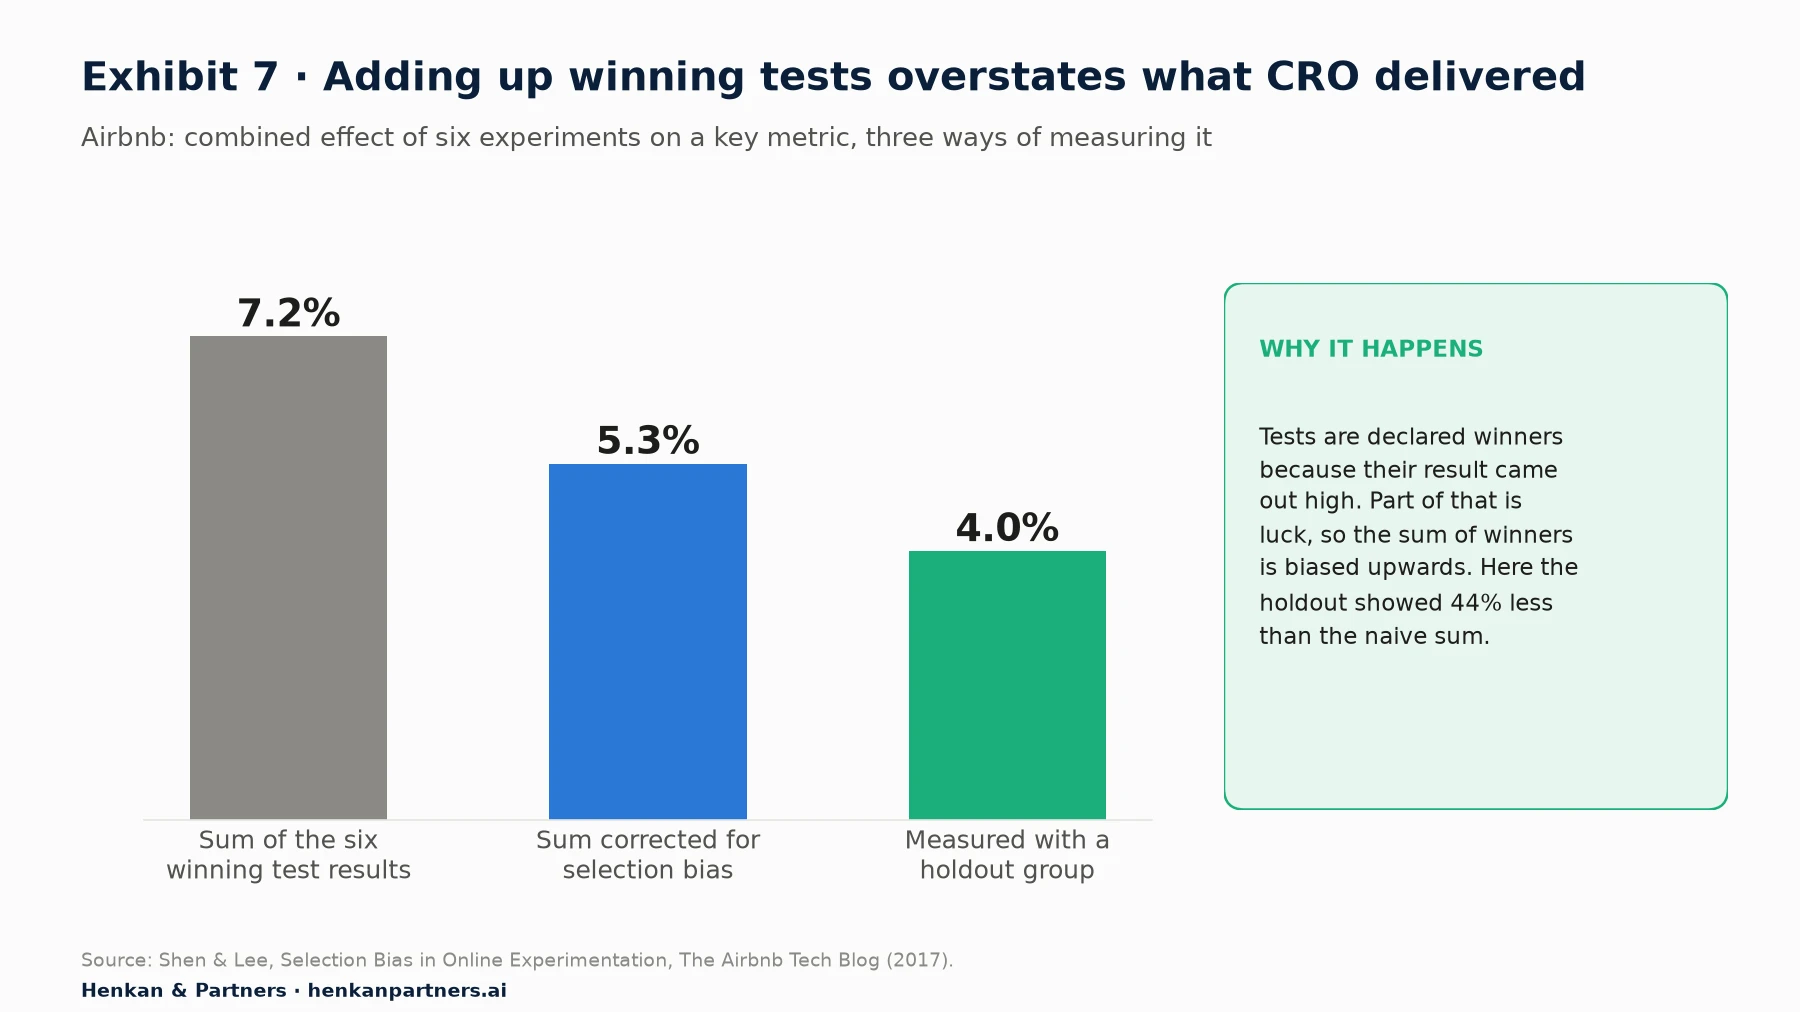
What this shows. Summing individual wins gave 7.2%; a holdout group, users who never received the changes, showed 4%. Airbnb's bias correction brought the sum to 5.3%. Results that are declared winners because they came out high are, on average, partly luck. Kohavi and colleagues describe the same "winner's curse": a significant result from a low-powered test is likely to exaggerate the size of the effect.
How to report CRO results honestly
- Keep a holdout. A small share of visitors who see none of the shipped changes gives the real cumulative effect. Optimizely's global holdouts, for example, suggest holding back up to 5% of traffic.
- Discount individual wins. Report the estimated effect with its confidence interval, and haircut sums of winners, or re-test the biggest wins.
- Watch for decay. Novelty effects fade, competitors copy, and seasonality changes. Check shipped winners again after a few months.
- Count the value of losses. Record the harmful changes you stopped and the decisions you made faster.
- Tie it to money. Convert effects into annual revenue or contribution per visitor, using the traffic that actually sees the change, not the whole site.
For leaders. Ask for three numbers each quarter: tests completed, share that changed a decision, and the cumulative effect measured on a holdout. A programme that reports only the sum of its wins is marking its own homework.
Section 10 · AI
AI speeds up building and analysing tests, but judgement and QA still decide the results
AI is changing CRO in three places: how variants are built, how research is analysed, and who is visiting the site.
AI-generated variants and prompt-based experimentation
Testing platforms now let you describe a change in plain language and have AI write the code. Optimizely's AI variation development agent, for example, can "modify and update existing website elements, create new ones, and generate and apply enhancement suggestions" from a prompt such as "Improve the Get started button to increase clicks", with every change shown as a preview for approval. Its documentation notes that generated code "falls outside the scope of Optimizely Support", so QA stays your responsibility.
We measured what this does in practice. In our study of 19 prompt-built tests, build time fell by about 89%, from 8.7 hours to 55 minutes on average, and 11 of 19 variants matched the hand-built originals at 90% fidelity or better. Five scored below 70%, mostly on precise visual work and conditional logic. Faster building means more tests on the same budget, which matters because most tests lose. The strategic case is in why prompt-based experimentation belongs on the C-level agenda.
AI in research, analysis and agents
- Research synthesis. Language models can cluster thousands of survey answers, reviews or support tickets into themes in minutes. Check a sample by hand: models can invent patterns and miss rare but important complaints.
- Analysis assistants and MCP. Through the Model Context Protocol (MCP), an open standard that lets AI assistants call tools, an assistant can query analytics or experiment results directly. This speeds up questions like "which segments dropped at delivery last week?", but the answers are only as good as the tracking behind them.
- AI shoppers. Visitors increasingly arrive from AI assistants: Contentsquare's 2026 benchmark reports that AI-referred traffic converted at 1.3% in the fourth quarter of 2025, a conversion rate up 55% in a year. As AI agents begin to browse and buy on behalf of customers, clear product data, prices, stock and delivery information become conversion factors for machines as well as people.
Our view. AI removes the build bottleneck, so the new constraints are the quality of research, the amount of traffic and the discipline of QA. Teams that use AI to run more badly chosen tests will get more false winners faster. Keep human review of every variant, a pre-launch QA checklist and a test log.
Section 11 · Mistakes
The most expensive CRO mistakes are about method, not design
- Testing without research. Ideas copied from other sites or brainstorms win less often and teach little.
- Optimising conversion rate instead of value. Discounts and cheap upsells can raise conversion and cut profit (Section 2).
- Stopping tests early. Checking results every day and stopping at the first significant reading inflates false positives. Decide the sample size and duration in advance.
- Running under-powered tests. On low traffic, tests either find nothing or find exaggerated effects (Exhibits 6 and 7).
- Ignoring segments and devices. A change that helps desktop can hurt mobile. Check the main segments you planned to check, and avoid fishing through dozens after the fact.
- Skipping QA. A variant that breaks on one browser or slows the page is a test of a bug, not of an idea.
- Trusting broken data. Missing consent, duplicate transactions or tracking gaps can invalidate a whole programme. Audit tracking before testing.
- Summing wins as ROI. Use holdouts and corrected estimates (Section 9).
- Forgetting to ship and share. Winning tests left at 50% traffic, or results nobody reads, create no value.
Section 12 · Next steps
What to do next
1. Agree the metric
Choose one primary metric, ideally revenue or contribution per visitor, and three to five guardrails such as return rate, speed and average order value. Write them down before any test.
2. Check your data
Audit e-commerce tracking, consent and device splits. Compare orders in analytics with your back office. If the numbers differ by more than a few percent, fix that first.
3. Run a two-week research sprint
Map the funnel by device and channel, watch replays at the biggest drop-offs, run an exit survey, and test five users on mobile. Log every finding in one place.
4. Build and score a backlog
Turn findings into hypotheses, fix what is broken, and score the rest with a simple framework plus revenue at stake. Check the minimum detectable effect for each test before it enters the queue.
5. Set up the programme to learn
Name an owner, agree a cadence, keep a holdout, and share every result, including losses. Decide whether you build in-house, use an agency or a fractional team, or combine them. If you would like help, Talk to us.
FAQ
Frequently asked questions about conversion rate optimization
Frequently asked questions
What is conversion rate optimization (CRO)?
Conversion rate optimization is the process of increasing the share of visitors who complete a goal, such as buying, by researching why they do not, changing the experience, and measuring the effect, usually with A/B tests.
What does CRO stand for in marketing?
In digital marketing and e-commerce, CRO stands for conversion rate optimization (optimisation in British English). In pharmaceuticals the same letters mean contract research organisation, which is unrelated.
How do you calculate conversion rate?
Divide the number of conversions, such as orders, by the number of sessions or visitors, and multiply by 100. 400 orders from 20,000 sessions is a 2% conversion rate. Always state whether you use sessions or users.
What is a good e-commerce conversion rate?
It depends on category, device and traffic mix. IRP Commerce reported a 2.23% average for UK and Irish online shops in August 2026, ranging from 0.57% to 5.81% by category. Among Shopify stores, Littledata found an average of 1.4% and a top-10% threshold of 4.7%. Compare with your own history first.
Is CRO the same as A/B testing?
No. A/B testing is one method CRO uses to prove that a change works. CRO also includes analytics, user research, prioritisation, fixing obvious problems without testing, and sharing what was learned.
What is a CRO audit?
A CRO audit is a structured review of a site's analytics, usability, speed and tracking to find where and why visitors fail to convert. A good audit ends with a prioritised list of fixes and test hypotheses, each backed by evidence.
What is a CRO strategy?
A CRO strategy defines the metric you optimise, the parts of the funnel and segments you focus on, how you research and prioritise ideas, how you test with your traffic, and how you report results and share learning.
Can you do CRO with low traffic?
Yes. Test bold changes, use metrics with more events such as add-to-basket, rely on user tests and surveys to fix clear problems, and use staged rollouts or careful before-and-after comparisons when a test would take too long.
How long does CRO take to show results?
Fixes to broken flows can show results within weeks. A test programme usually needs several months to build a research base and a rhythm, and each test typically runs for at least one to two full weeks.
How is AI used in CRO?
AI helps summarise research, analyse results and build test variants from plain-language prompts. In our 19-test study, prompt-built variants cut build time by about 89%. Human review and QA are still needed.
Key terms
- Conversion rate
- The share of sessions or visitors that complete a goal, such as an order. It is the starting metric for CRO, but it can rise while profit falls.
- Revenue per visitor (RPV)
- Revenue divided by visitors, equal to conversion rate times average order value. It captures changes in both, which makes it a better primary metric for most e-commerce tests.
- Average order value (AOV)
- Revenue divided by the number of orders. It matters because many CRO changes trade conversion against order size.
- Guardrail metric
- A metric that must not get worse when a change ships, such as return rate or page speed. It protects the business from wins that cause hidden damage.
- Hypothesis
- A testable statement of what change, for whom, should have what effect, and why. It links each test to evidence and makes the result a lesson whether it wins or loses.
- PIE, ICE and PXL
- Frameworks for scoring and ranking test ideas. They matter because capacity is limited and the order of tests decides how fast a programme learns.
- Heuristic review
- An expert assessment of a site against usability principles. It finds likely problems quickly but should be confirmed with data before large investments.
- Session replay
- Reconstructed recordings of real visits, showing clicks, scrolls and errors. It explains why visitors drop out at points that analytics identifies.
- Cart abandonment rate
- The share of shopping baskets created that do not become orders; Baymard documents an average of 70.22%. It sizes the opportunity in basket and checkout.
- Core Web Vitals
- Google's three user-experience speed metrics: Largest Contentful Paint, Interaction to Next Paint and Cumulative Layout Shift. They matter because speed affects conversion at every step.
- Minimum detectable effect (MDE)
- The smallest effect a test can reliably detect with the available traffic. It tells you before launch whether a test is worth running.
- Winner's curse
- The tendency of results declared winners to overstate the true effect, because selection favours lucky highs. It is why sums of winning tests overstate CRO's return.
- Holdout group
- A share of visitors kept away from all shipped changes, used as a long-term control. It measures the real cumulative effect of a programme.
- Prompt-based experimentation
- Building A/B test variants by describing the change in plain language to an AI tool. It removes much of the development bottleneck but increases the need for QA.
Sources
All sources were checked in September 2026. Figures from IRP Commerce, Littledata, Contentsquare and Optimizely are vendor data, based on each vendor's own customers or platform. Exhibits 5 and 6, the operating-model and research-method tables, the prioritisation assessment and the discount example are Henkan & Partners frameworks or calculations; the discount example is illustrative.
- IRP Commerce (2026). Ecommerce Market Data and Ecommerce Benchmarks.
- Contentsquare (2026). Conversion Rates in 2026: Benchmarks, AI, and What's Driving Growth.
- Contentsquare (2026). 15 mobile analytics stats from the 2026 benchmark report.
- Littledata (2023). Average Ecommerce Conversion Rate.
- Baymard Institute (2026). Cart Abandonment Rate Statistics.
- Baymard Institute (2025). Checkout UX Best Practices: current state of checkout UX.
- Baymard Institute (2026). Product Page UX Best Practices 2026.
- Baymard Institute (2025). Product List UX Best Practices 2025.
- Baymard Institute (2026). Ecommerce Search UX: supporting search query types.
- Deloitte and Google (2020). Milliseconds Make Millions.
- Google, web.dev (2020). Milliseconds make millions (case study).
- Google, web.dev. Web Vitals.
- Kohavi, R., Deng, A. & Vermeer, L. (2022). A/B Testing Intuition Busters. KDD 2022.
- Kohavi, R. & Thomke, S. (2017). The Surprising Power of Online Experiments. Harvard Business Review.
- Shen, M. & Lee, M. (2017). Selection Bias in Online Experimentation. The Airbnb Tech Blog.
- Optimizely (2026). Global holdouts.
- Optimizely (2026). AI variation development agent.
- Laja, P., CXL (2016, updated 2026). PXL: A Better Way to Prioritize Your A/B Tests.
- Conversion (n.d.). PIE Prioritization Framework.
- Growth Method (n.d.). ICE Framework: the original prioritisation framework for marketers.
- Nielsen, J., Nielsen Norman Group (2000). Why You Only Need to Test with 5 Users.
- Henkan & Partners (2026). How AI Is Reshaping A/B Testing: What 19 Prompt-Built Tests Tell Us.