Focus
Attribution in GA4 for Marketers: Models, Conversion Paths and How to Judge Channels Fairly
Alexandre Suon · 2026-10-02
GA4 attribution decides which channel gets credit for each sale or lead, and that credit ends up in budget meetings. This guide shows marketers which attribution models GA4 still offers, the settings that change every number, how to read the Attribution models and Key event attribution paths reports step by step, and why fair channel judgements also need incrementality tests and marketing mix models.
Executive summary
- Attribution tells you who touched the sale, not who caused it. GA4 assigns credit for each key event to the clicks and visits it saw before that event. That is useful for daily steering, but it is not proof that a channel created demand. Treat it as one view among three.
- GA4 now has only three attribution models, and data-driven is the default. Google removed first click, linear, time decay and position-based models from GA4 in November 2023. What is left: data-driven, paid and organic last click, and Google paid channels last click. Direct visits never get credit unless the whole path is direct.
- Four settings change your numbers before you open a report. The reporting attribution model (changes apply to historical data too), the channels that can receive credit, the lookback windows (30 or 7 days for first visits, 90, 60 or 30 days for other key events) and the reporting time option. Write them down and check them before every budget review.
- Two reports in the Advertising section do most of the work. Attribution models compares two models side by side by channel, source, medium or campaign. Key event attribution paths shows the paths behind each key event, split into early, mid and late touchpoints, with days and touchpoints to conversion.
- Correlation-based credit can be badly wrong. At eBay, regression estimated the return on non-brand paid search at over 1,400%; a field experiment found −63%. In a Facebook retail campaign, a naive comparison suggested a 316% lift when the experiment measured 73%.
- Judge channels fairly with three methods, not one. Use GA4 attribution for daily and weekly decisions, incrementality tests to check the big channels (Google Ads tests now start from $5,000), and a marketing mix model such as Google's open-source Meridian or Meta's Robyn to split the total budget.
Section 1 · What attribution is
GA4 attribution answers "who gets credit", which is not the same as "what caused the sale"
GA4 attribution is the set of rules Google Analytics 4 uses to assign credit for a key event, such as a purchase or a lead, to the marketing touchpoints a user interacted with before it. Google defines attribution as "the act of assigning credit for important user actions to different ads, clicks, and factors along the user's path to completing the action". In GA4 it is controlled by the reporting attribution model, the channels allowed to receive credit and the lookback window.
Every marketer has sat in the meeting. Paid search says it drove 40% of revenue. Social says its campaigns started most journeys. Email says nobody buys without the newsletter. Each team brings a report, and each report is right by its own rules. Attribution is the referee in that meeting, and you need to know the rules it plays by.
This article is step 3 of The ABC of GA4 for Marketers. Step 1, GA4 for marketers, covers the acquisition questions GA4 answers and why its numbers never match your ad platforms. Step 2, UTM conventions, key events and ad platform links, covers the tracking you need before attribution can work. Here we focus on the conclusions: how to read GA4's attribution reports and how to judge channels fairly. If you want the mechanics of how GA4 builds sessions and counts users, read how GA4 actually works first.
Why credit is not causation
Attribution models look at the paths of people who converted, and in the case of data-driven attribution also at people who did not. They can only use what GA4 recorded: clicks and visits that carried a source, from users who accepted analytics cookies. They cannot see what would have happened without the ad. A customer who would have bought anyway, and who clicks a brand search ad on the way to checkout, still hands the sale to paid search.
That does not make attribution useless. It is free, it is daily, and it is granular down to campaign level. It is the right tool for comparing campaigns inside a channel, spotting broken tracking, and seeing how journeys are shaped. It is the wrong tool, on its own, for deciding whether a channel deserves its budget. Sections 9 and 10 cover the methods that answer that second question.
For marketers. Before any channel debate, ask one question: "Which model, which lookback window and which key event is this number using?" Most disagreements disappear once both sides use the same settings.
For leaders. Ask your team to show attribution numbers next to at least one incrementality result per major channel each year. If they cannot, budget decisions rest on correlation alone.
Section 2 · The models
GA4 now offers three attribution models, and data-driven is the default
If you learned attribution in Universal Analytics, forget the long menu of models. Google's help pages date GA4 attribution for paid and organic channels from 14 June 2021 for rules-based models and from 1 November 2021 for data-driven attribution. In 2023 it retired four rules-based models: from June 2023 new Google Ads conversion actions could no longer use them, in September 2023 existing ones were switched to data-driven, and as of November 2023 "the first click, linear, time decay, and position-based attribution models are no longer available" in GA4. Google's stated reason: "less than 3% of Google Ads web conversions are attributed using first click, linear, time decay, or position-based models".
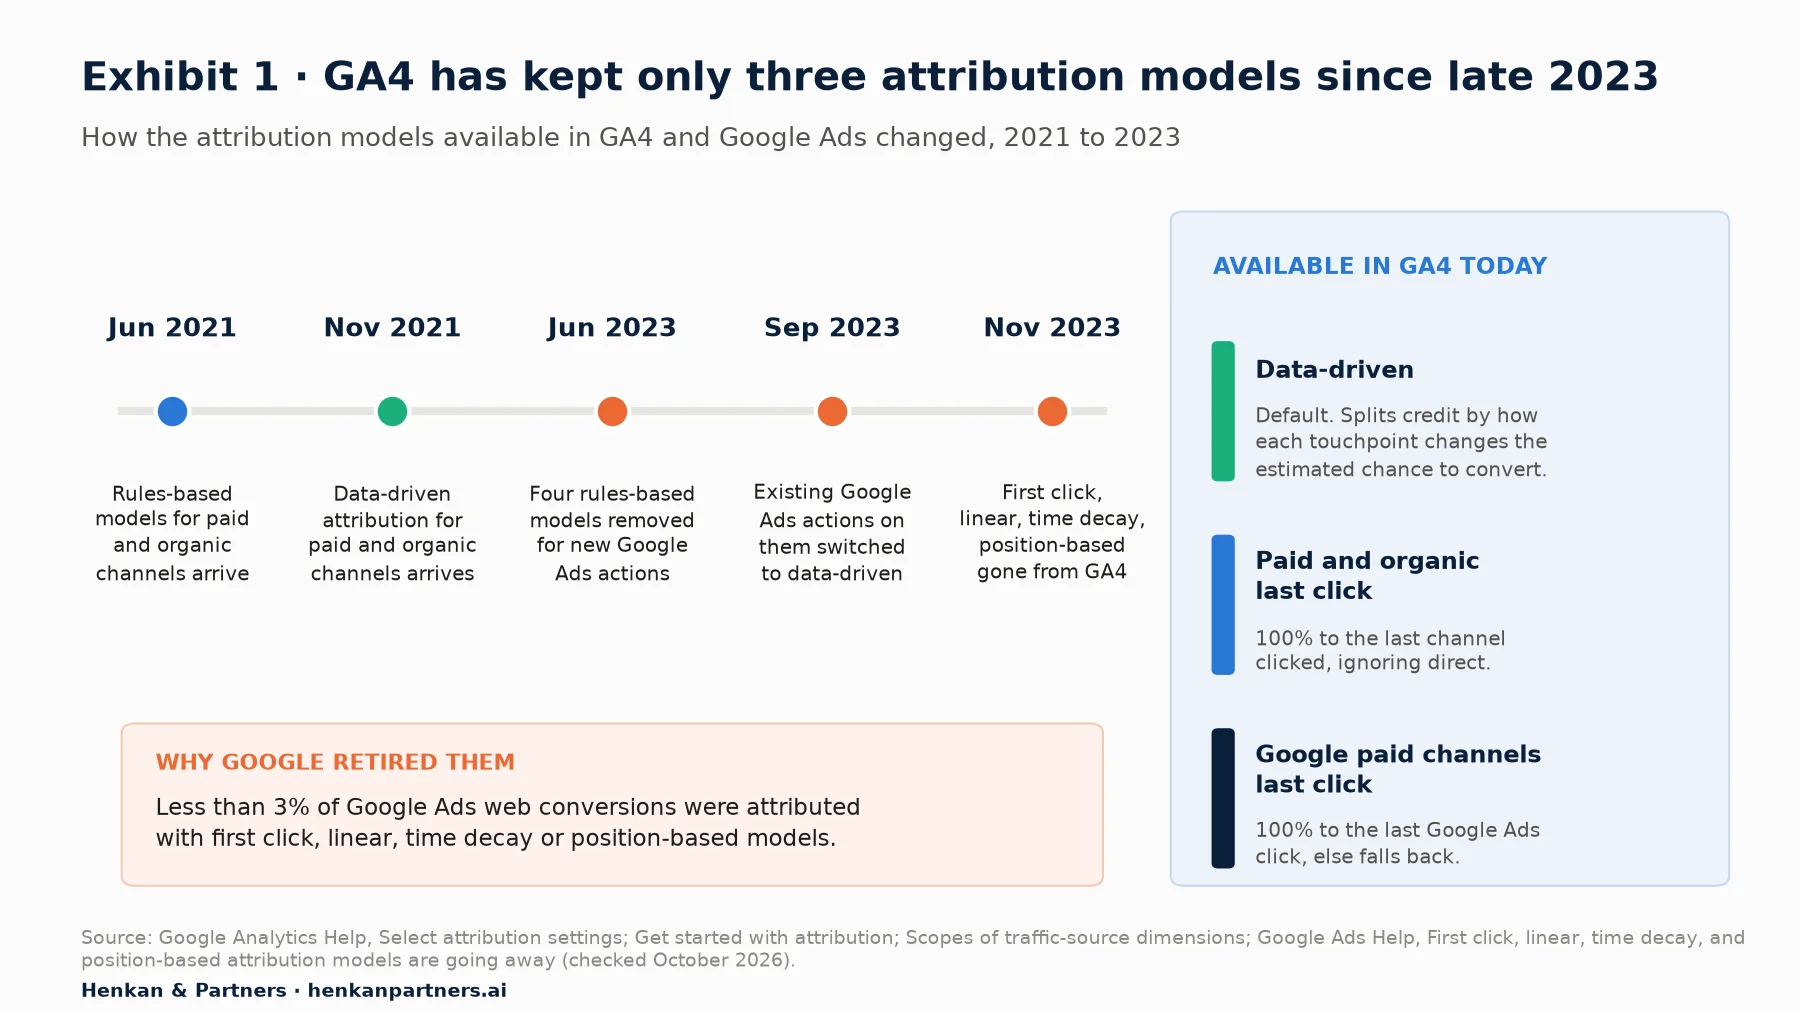
What this shows. The choice is now simpler: one algorithmic model and two last-click variants. If an old dashboard, agency deck or training course still mentions linear or position-based models in GA4, it is out of date. The retired models are not coming back, so any comparison you need with them must be rebuilt outside GA4, for example in BigQuery.
| Model | How it splits credit | Use it for | Watch out for |
|---|---|---|---|
| Data-driven (default) | Uses your account's converting and non-converting paths to estimate how each touchpoint changes the probability of a key event, then shares credit in proportion | Day-to-day reporting and comparing channels that open and assist journeys | A black box you cannot audit; only sees touchpoints GA4 recorded |
| Paid and organic last click | 100% of credit to the last channel clicked before the key event, ignoring direct visits | A stable, explainable baseline; finance-friendly reporting | Undervalues channels that start journeys, such as paid social and display |
| Google paid channels last click | 100% to the last Google Ads click in the path; if there is none, falls back to paid and organic last click | Seeing how GA4 credits Google Ads specifically | Not a fair cross-channel view: by design it favours Google's own ads |
Two rules apply to all three models. First, direct traffic: "All attribution models exclude direct visits from receiving attribution credit, unless the path to key event consists entirely of direct visits." Second, data-driven attribution is counterfactual in spirit. Google describes it as building key event probability models from converting and non-converting paths, then assigning fractional credit by how each interaction changes the estimated probability. It is still a model built on observed behaviour, not an experiment.
Section 3 · Where attribution applies
Only event-scoped reports follow your attribution model, so pick the report that fits the question
A common source of confusion is that the attribution model you choose does not apply everywhere. GA4 has three families of traffic-source dimensions, and Google's documentation is explicit about which rule each one follows. User-scoped dimensions (prefixed "First user") and session-scoped dimensions (prefixed "Session") always use paid and organic last click: they "are unaffected by changes to the attribution model". Event-scoped dimensions, with no prefix, use the model you select, which is data-driven by default.
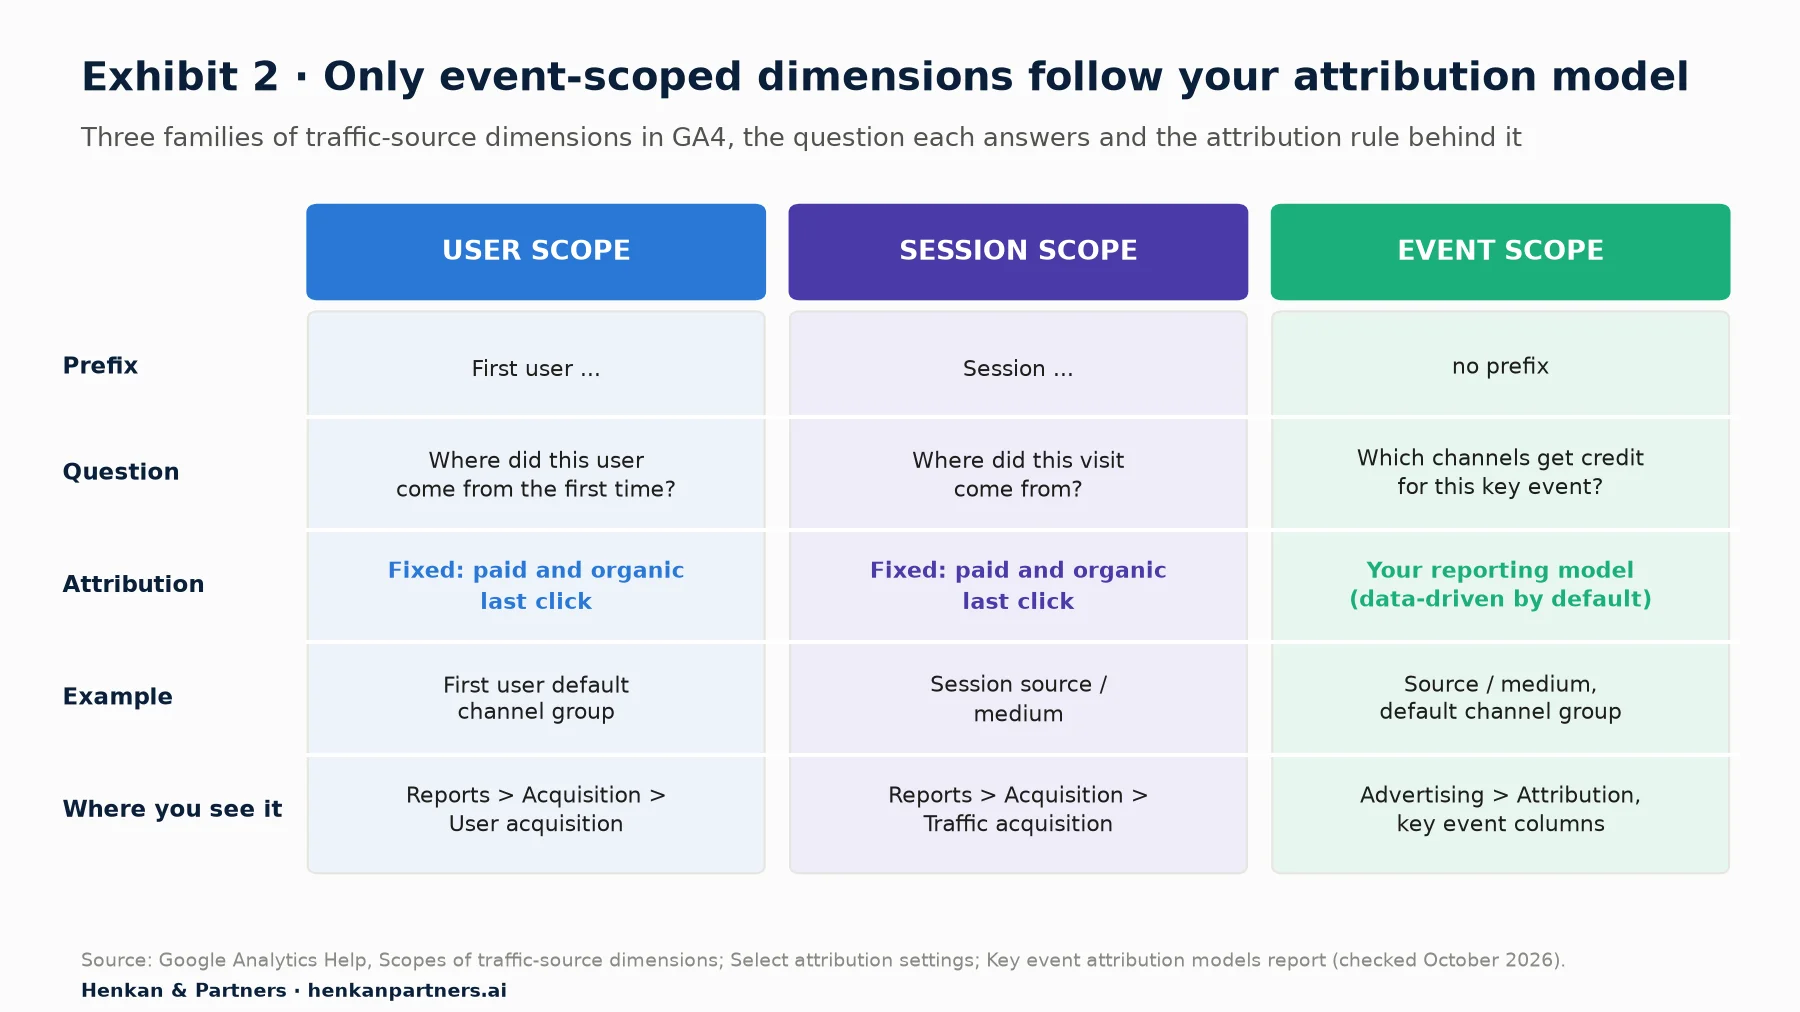
What this shows. If you change the reporting model and your Traffic acquisition report does not move, nothing is broken: session-scoped dimensions ignore the model. Only event-scoped views, mainly in the Advertising section, reflect your choice. Mixing scopes in one dashboard is the fastest way to create two "true" numbers for the same channel.
In practice, use each scope for a different question:
- User acquisition (first user): which channels bring new customers? Use it to judge prospecting campaigns and the quality of the users they bring.
- Traffic acquisition (session): which channels bring visits, and how engaged are those visits? Use it for content and landing page decisions.
- Advertising > Attribution (event): which channels get credit for purchases and leads under your chosen model? Use it for channel and campaign budget discussions.
Section 4 · Settings
Four settings change every attribution number, so check them before you read a report
Attribution settings live at property level. To see them, go to Admin > Data display > Events > Attribution settings (a newer Google help page labels this item Key events attribution, so look for either). You need the Marketer role or above at property level to change them. Before any channel review, open this screen and record what you see.
| Setting | Options | Default | What changing it does |
|---|---|---|---|
| Reporting attribution model | Data-driven; Paid and organic last click; Google paid channels last click | Data-driven | Applies to historical and future data, so last month's export may no longer match today's report |
| Channels that can receive credit | Paid and organic channels; Google paid channels | Not stated by Google; check your property | Decides which channels are eligible for credit; Google notes the paid and organic option applies to web conversions only, and app conversions always use Google paid channels |
| Lookback window, acquisition key events (first_visit, first_open) | 30 or 7 days | 30 days | Applies going forward only |
| Lookback window, all other key events | 90, 60 or 30 days | 90 days | Applies going forward only; shorter windows favour channels that close quickly |
A fifth option sits inside the reports rather than the admin: reporting time. With event time, a report shows credit for the key events that happened in your date range, including touchpoints from before it, back to the lookback window. With ad interaction time, it shows credit for the touchpoints that happened in your date range. Event time matches how finance counts sales. Ad interaction time is closer to how media teams think about a campaign's effect, and it changes as late conversions arrive.
Keep a one-line settings log
Because a model change rewrites history, write every change in a log: date, setting, old value, new value, who and why. Add a line to the top of each attribution dashboard, for example: "Model: data-driven · Lookback: 90 days · Key event: purchase · Reporting time: event time". It takes a minute and prevents the classic argument where two people compare numbers built on different rules. Our GA4 audit checklist includes this check.
Our view. Leave the property on data-driven for everyday reporting, but always look at paid and organic last click next to it. When the two agree, you can be confident. When they diverge sharply for a channel, that channel is either an opener that deserves a closer look or a beneficiary of demand created elsewhere. Only an experiment tells you which.
Section 5 · One path, three answers
The same customer path gives three different answers, and none of them is the truth
To see what the models do, follow one customer (illustrative example). She clicks a Meta ad and browses. Two days later she searches a generic product term and clicks a Google Ads result. A week later she searches again and clicks an organic result. She signs up for the newsletter, clicks the next email, and finally types the URL and buys for £120.
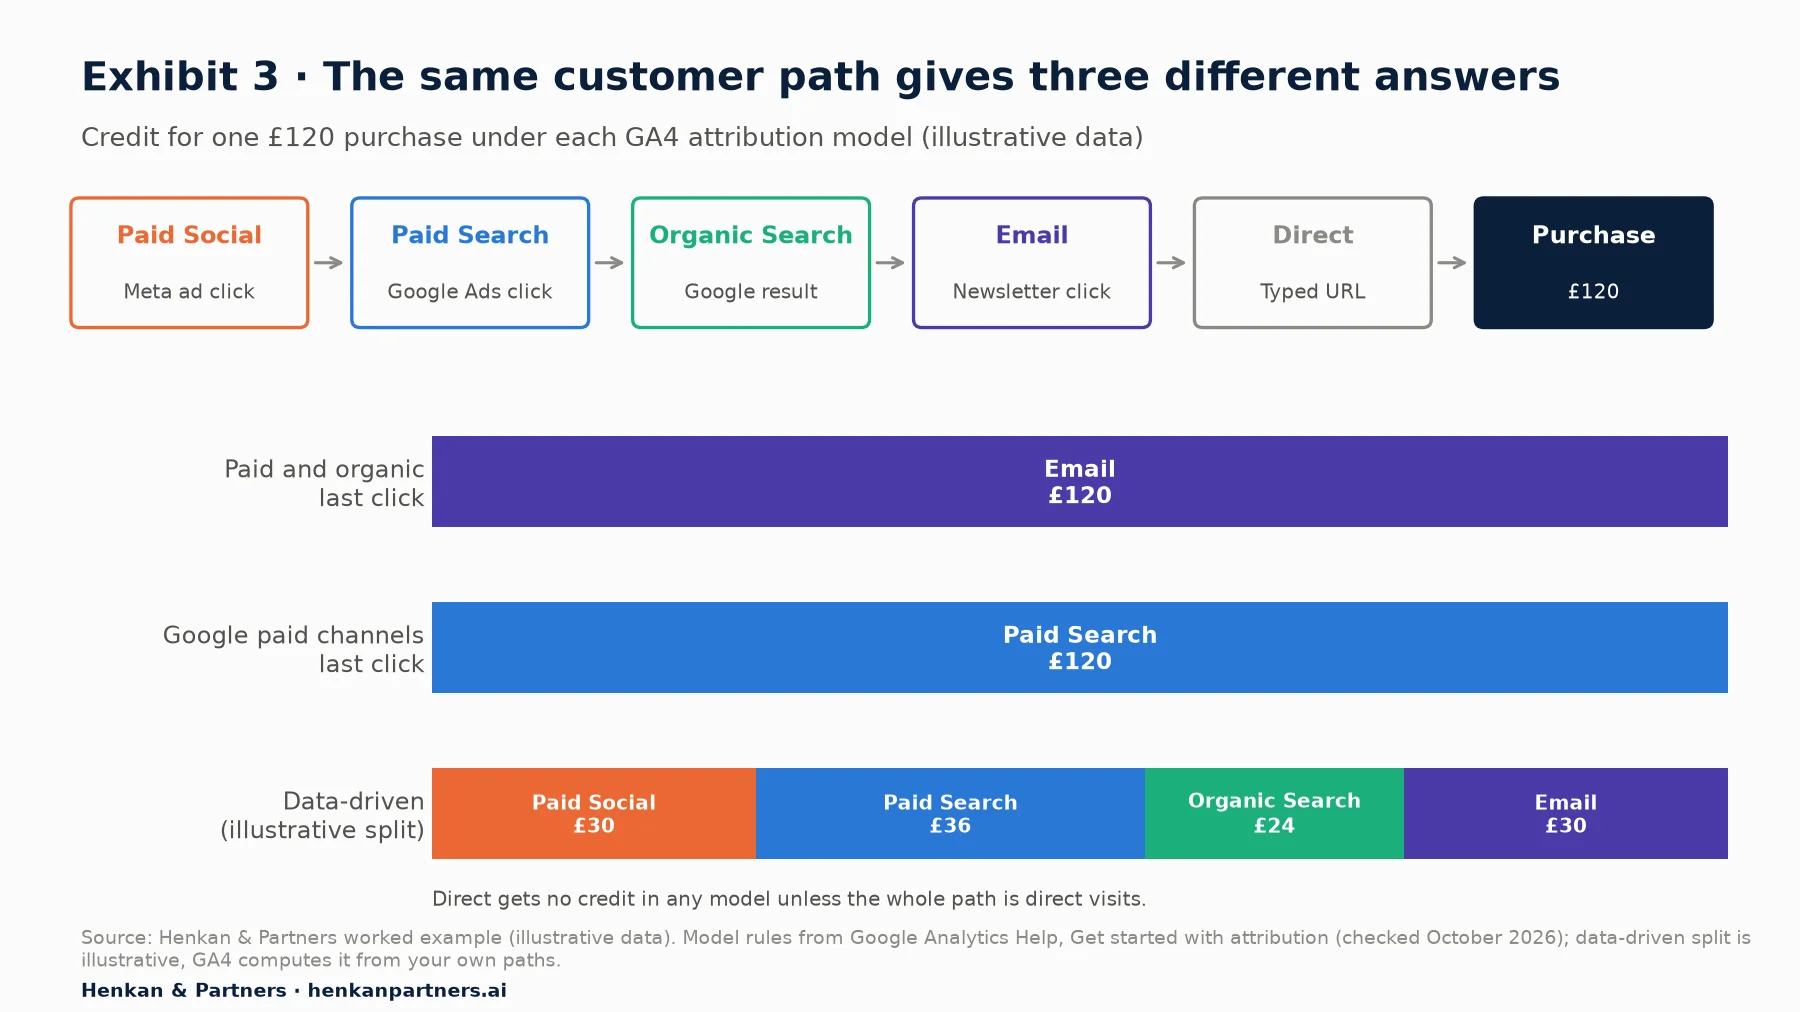
What this shows. Last click hands the whole sale to the email, because direct is ignored. Google paid channels last click hands it to the Google Ads click. Data-driven spreads it, but the split depends on patterns across all your paths, which you cannot inspect. Each model answers a different question, and the email team, the search team and the social team can each pick the one that flatters them.
Three practical lessons follow from this example:
- Direct is never the hero. A customer who types your URL after seeing three campaigns does not hand credit to "direct". If your direct traffic is large in session reports but tiny in attribution reports, this rule is why.
- Badly tagged or uncaptured touchpoints get the wrong credit or none. If the Meta ad link had no UTM parameters, the click would show up as organic social or referral rather than paid social. If the visitor refused analytics cookies, the touchpoint is invisible to every model. Fix tagging before you debate models; see our UTM guide and user consent in e-commerce.
- Views do not count unless GA4 receives them. A banner seen but not clicked rarely appears in GA4 paths for non-Google media. Channels that work through exposure, such as video, display or out-of-home, are structurally under-credited.
Section 6 · Attribution models report
The Attribution models report shows how much each channel depends on the model, which is where judgement starts
The Attribution models report (Google's documentation also calls it the key event attribution models report) puts two models side by side. It lives in the Advertising section. Google says you need to link your property to a Google advertising product, such as Google Ads, to view advertising reports.
Step by step
- In Google Analytics, click Advertising in the left navigation, then go to Attribution > Attribution models.
- At the top, pick the key event you care about, usually purchase or generate_lead. Comparing all key events at once mixes newsletter sign-ups with sales.
- In the two Attribution model (non-direct) columns, choose the models to compare, for example data-driven against paid and organic last click.
- Keep the default dimension, Primary channel group, or switch to source / medium, source, medium or campaign.
- Set the reporting time (event time or ad interaction time) and a date range of at least four weeks, so slow paths have time to complete.
- Add filters if needed, for example by campaign, region or device category, and read the key events and revenue columns for each model.
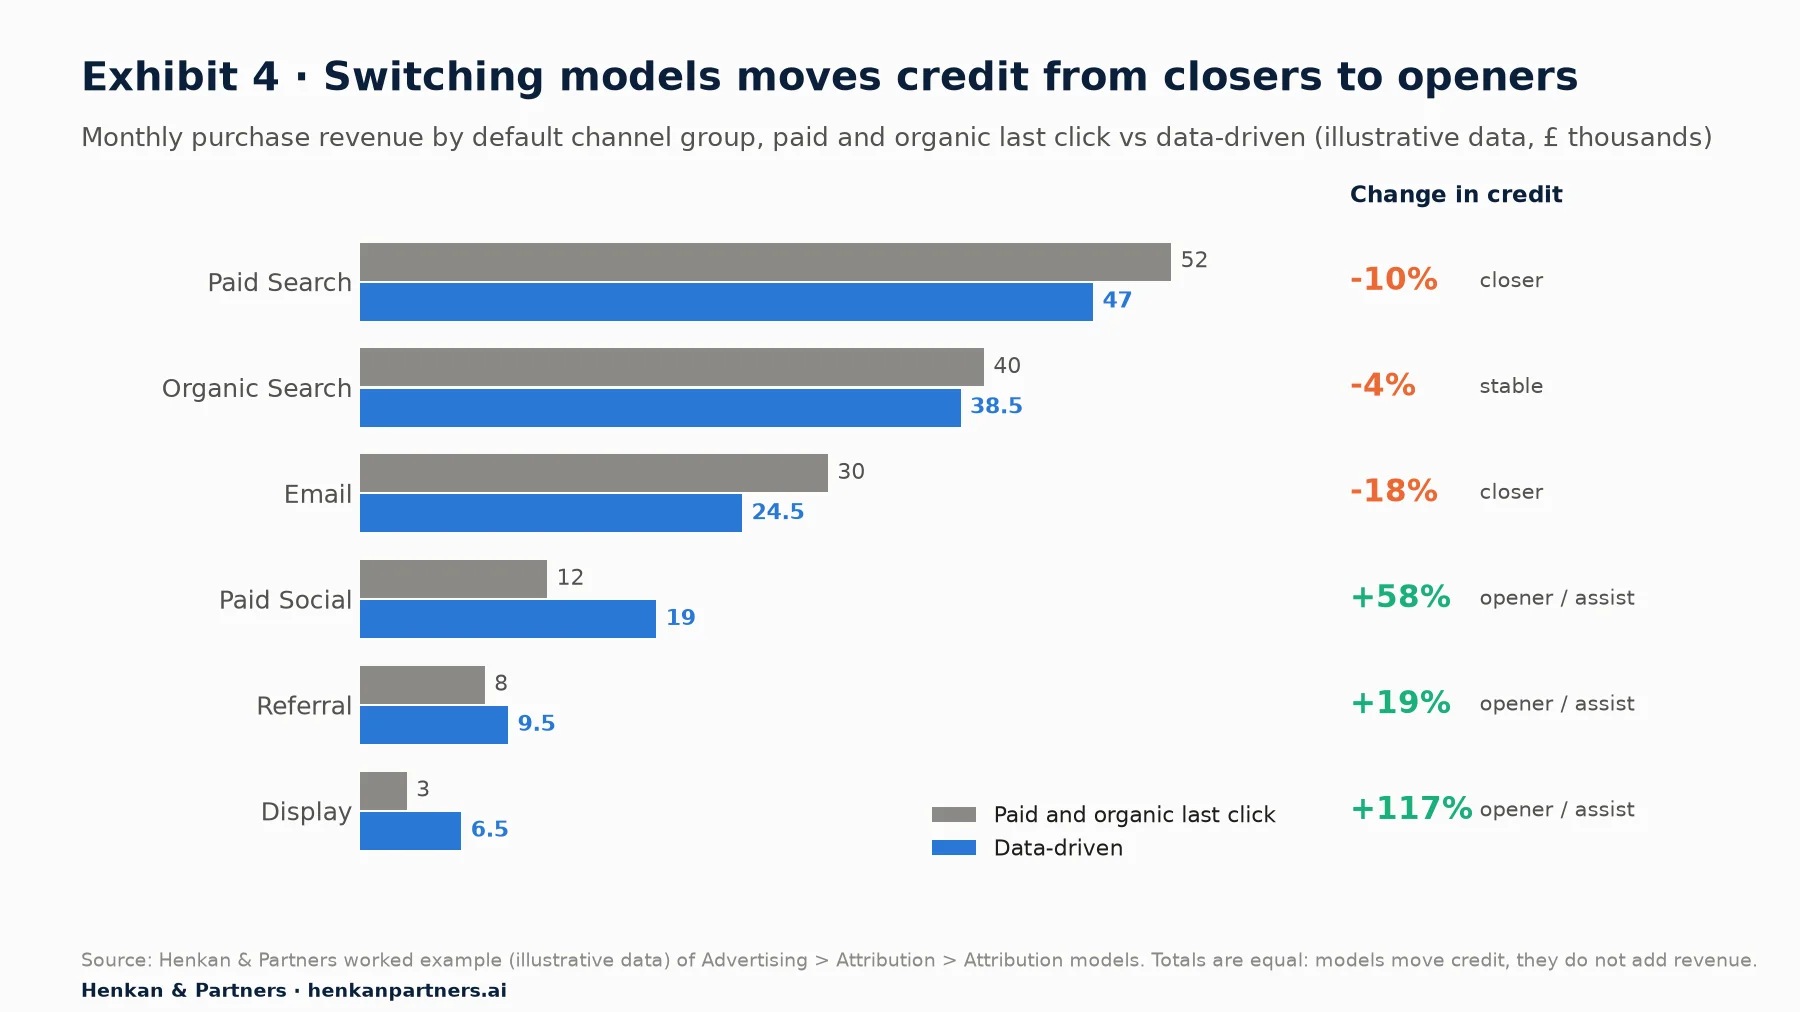
What this shows. The total does not change: models move credit, they do not create revenue. Channels whose credit rises under data-driven, here paid social and display, tend to appear early in paths. Channels whose credit falls, here email and paid search, tend to close. The size of the shift, not the absolute figure, is the useful signal.
How to read the comparison
Change in credit (%) = (credit under data-driven − credit under last click) ÷ credit under last click × 100

Example: Paid Social = (19 − 12) ÷ 12 × 100 = +58%
We use a simple reading grid (Henkan & Partners rule of thumb, not a Google benchmark):
| Change in credit | Likely role | What to do |
|---|---|---|
| More than +10% | Opener or assister | Do not cut on last-click ROAS alone; check the paths report and plan a lift test |
| Between −5% and +10% | Stable | Model choice does not matter much; judge on cost and margin |
| Less than −5% | Closer | Check whether it captures demand others created, especially brand search and retargeting |
Be careful with small channels. A display line going from £3,000 to £6,500 is a big percentage on a small base, and data-driven credit for small channels can be noisy. Look at several months before you conclude.
Section 7 · Paths report
The Key event attribution paths report shows how channels open, assist and close journeys
Numbers by channel hide the order of events. The Key event attribution paths report shows the actual sequences. To open it, click Advertising in the left navigation, then Key event attribution paths under the Key events dropdown.
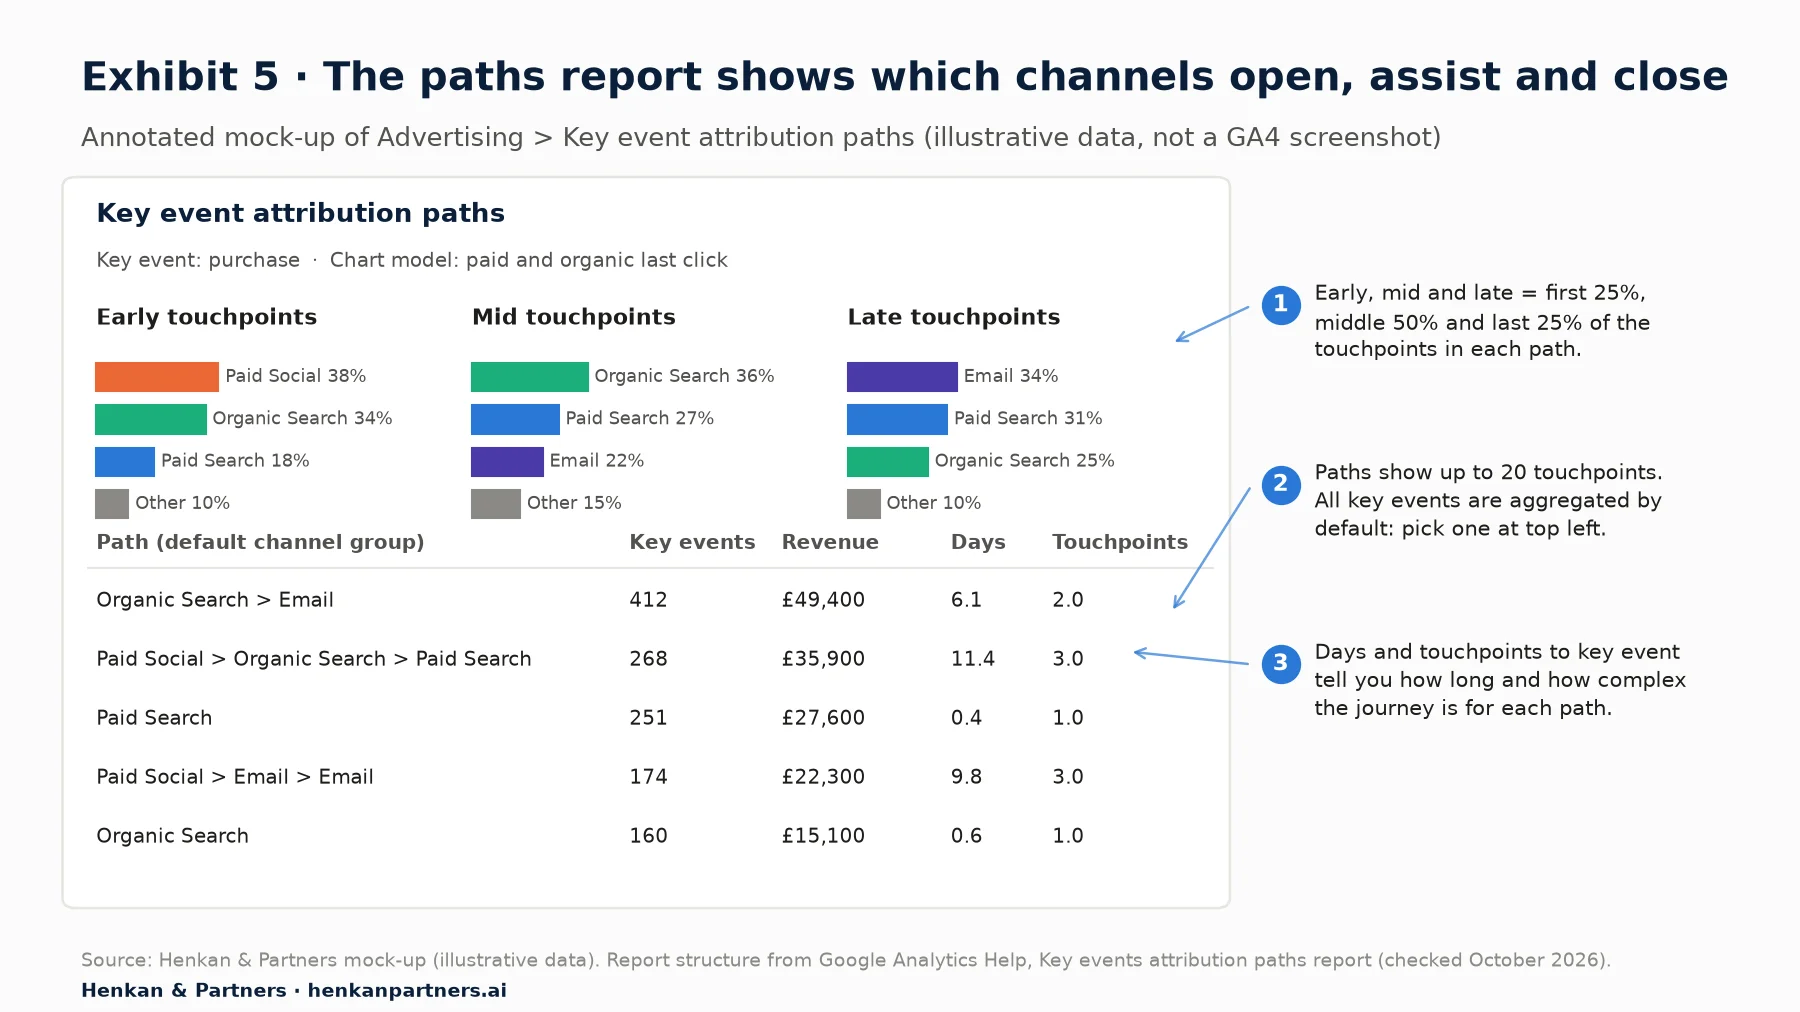
What this shows. The chart at the top splits each path into early (first 25% of touchpoints), mid (middle 50%) and late (last 25%) touchpoints, and shows which channels get credit in each phase. The table lists the most common paths. In this example paid social dominates early touchpoints and email dominates late ones, so judging either by last click alone would mislead.
Step by step
- Select one key event from the drop-down menu at the top left. By default all key events are selected and aggregated, which mixes very different journeys.
- Read the chart. Google notes that it "displays data as calculated by the Paid and organic channels last click attribution model", so do not compare it directly with data-driven numbers elsewhere.
- In the table, switch the path dimension between primary channel group, source, medium and campaign. Start with channels, then drill into campaigns for the channels that matter.
- Sort by key events, then by revenue. Note the days to key event and touchpoints to key event for your top paths.
- Look for three patterns: single-touch paths (quick, often brand or returning customers), long paths with an early paid touch (prospecting doing its job) and paths that end in brand search or email (closers).
Two limits matter. The report displays paths up to 20 touchpoints long, and attribution data in these reports is available from 14 June 2021 onwards. And the paths only contain what GA4 recorded: a user who switches device without signing in, or who declines cookies, splits into separate, shorter paths.
For marketers. Use days to key event to set your lookback window and your campaign reporting horizon. If most purchase paths take eleven days, judging a prospecting campaign after three days will always make it look weak.
Section 8 · Judging channels
Judging channels fairly means comparing like with like, including cost
A fair comparison holds four things constant: the key event, the model, the lookback window and the date range. Then it adds cost, because a channel with modest credit but tiny cost may be your best investment. The All channels report helps here: click Advertising, then go to Planning > All channels. It shows key events, ads cost, cost per key event, total revenue and return on ad spend by channel. Google recommends setting the reporting attribution model to data-driven for it.
Cost data only appears for linked Google products (Google Ads, Search Ads 360, Display & Video 360) or for campaign data you import through Data Import. If you do not import Meta, TikTok or affiliate costs, those channels show credit with no cost, and cross-channel ROAS comparisons are meaningless. Ask for cost import in your tracking requests; the ABC of GA4 for Marketers step 2 covers how.
A fair channel scorecard
| Question | Where in GA4 | Read it as |
|---|---|---|
| Does the channel bring new customers? | Reports > Acquisition > User acquisition (first user dimensions) | Share of new users and their later purchases |
| How much credit does it get, and how sensitive is that to the model? | Advertising > Attribution > Attribution models | Data-driven vs last click change in credit (Table 3) |
| Where in the journey does it act? | Advertising > Key event attribution paths | Share of early, mid and late touchpoints |
| What does the credit cost? | Advertising > Planning > All channels | Cost per key event and ROAS, only if cost is linked or imported |
| Does it cause sales? | Not in GA4 | Incrementality test or MMM (Sections 9 and 10) |
Why GA4 and Google Ads still disagree
Even inside Google's own tools, the numbers differ. When you import GA4 key events into Google Ads as conversions, the attribution models report help page warns that "only key events where Google Ads is the last non-direct click are used to create conversions in Google Ads, even if a non-last click attribution model is selected". GA4 now also lets you create Google Ads conversions from key events through Conversion management, and adds Conversion performance and Conversion attribution models reports in the Advertising section. Add other ad platforms, with their own windows and view-through credit, and you have several honest but different answers. Our GA4 for marketers article explains the main reasons in detail.
Section 9 · Attribution vs causation
Correlation-based credit can overstate what ads cause, and the evidence is hard to ignore
Incrementality is the share of sales that would not have happened without the marketing. It is measured by comparing a group exposed to a campaign with a comparable group that was not, ideally chosen at random. Two published field studies show how far correlation-based estimates can drift from that benchmark.
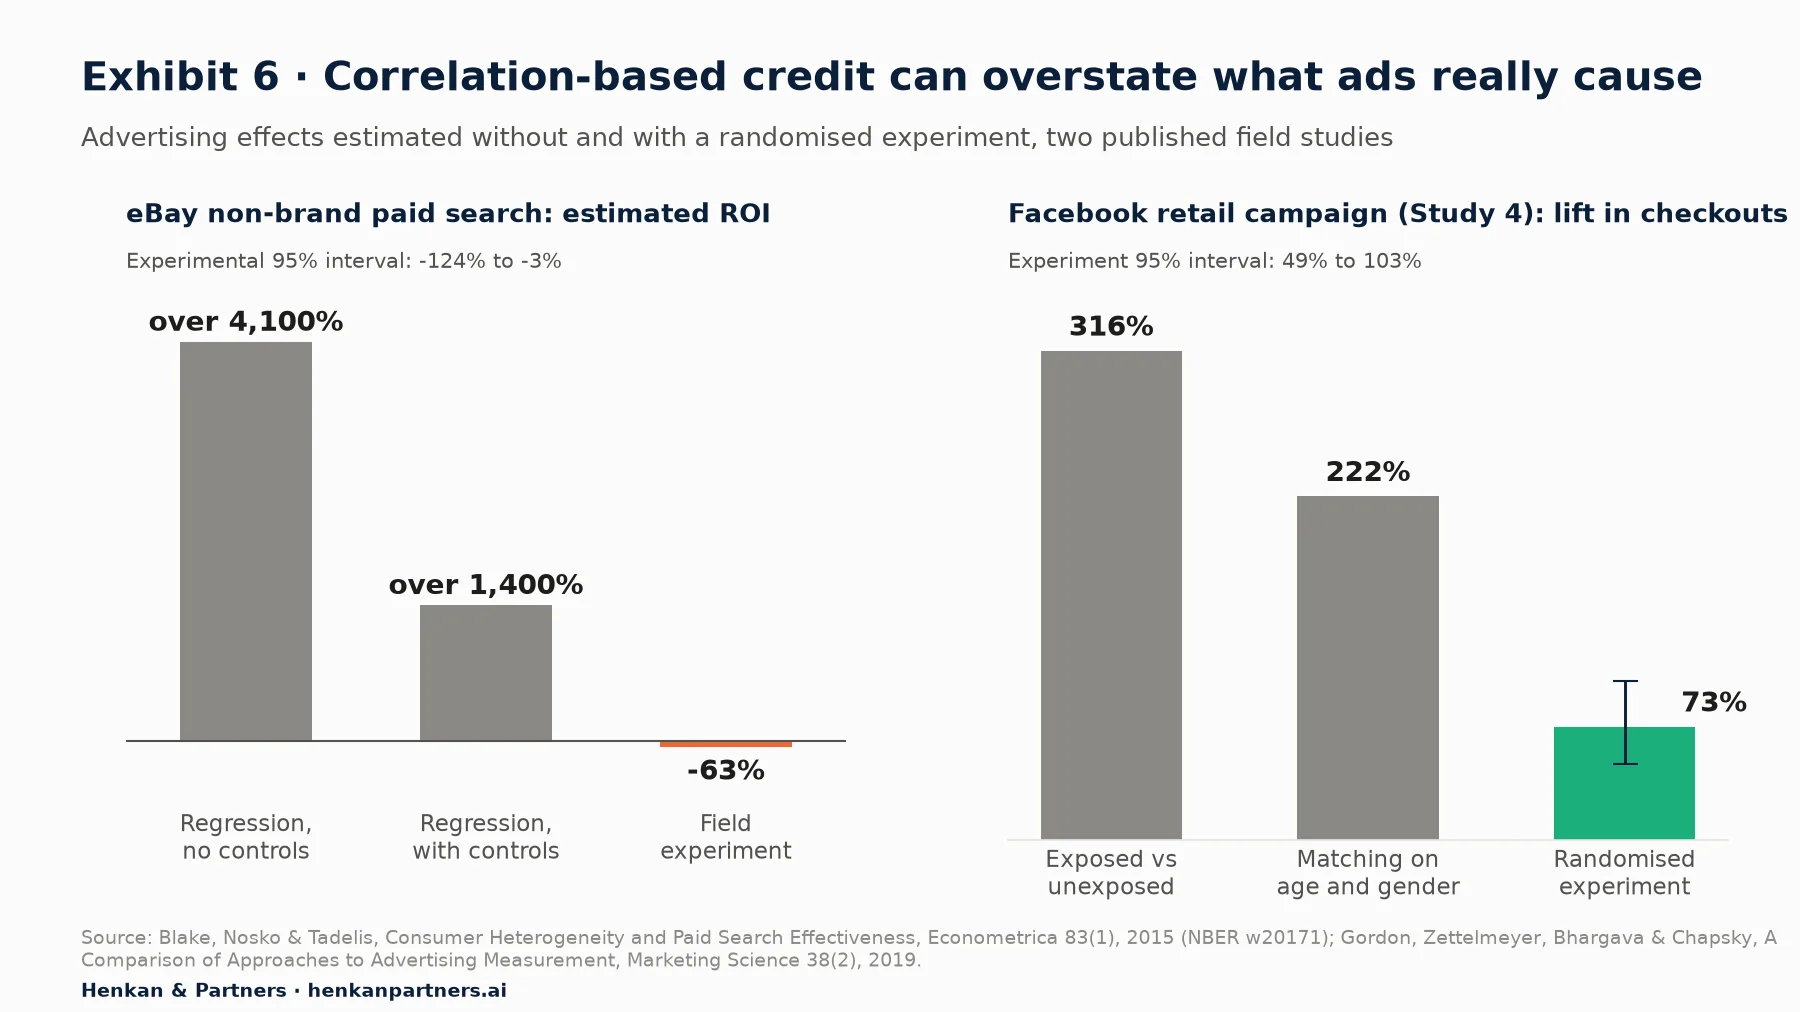
What this shows. In both studies the methods that rely on observed behaviour gave far larger effects than the experiment. At eBay, a campaign that looked hugely profitable lost money. At Facebook, a real effect existed but was overstated more than fourfold by the naive comparison. Attribution models are not the same as these regressions, but they share the core weakness: they cannot see what would have happened anyway.
The eBay study, by Blake, Nosko and Tadelis, found that when eBay stopped brand-keyword ads on Yahoo! and MSN, 99.5% of the lost paid clicks moved to organic results. For non-brand keywords, it estimated a return of −63%, against over 1,400% from regression with controls and over 4,100% without. The reason: "frequent eBay shoppers account for most of the sales attributed to paid search", and they would have bought anyway.
Gordon and colleagues compared observational methods with 15 randomised experiments at Facebook covering 1.6 billion ad impressions. In Study 4, a retail campaign, the experiment measured a 73% lift in checkouts; comparing exposed with unexposed users suggested 316%, and matching on age and gender suggested 222%. The authors report that in half of their studies the estimated increase in purchases was off by a factor of three.
Our view. These studies are not a reason to stop using GA4 attribution. They are a reason to treat it as a ranking and diagnostic tool, and to check the channels that take the most budget with experiments. Brand search, retargeting and affiliate coupon sites are the usual suspects, because they sit close to purchases that were already going to happen.
Section 10 · Experiments and MMM
Incrementality tests and marketing mix models complete what GA4 attribution cannot do
A fair view of channels combines three methods, each answering a different question at a different speed.
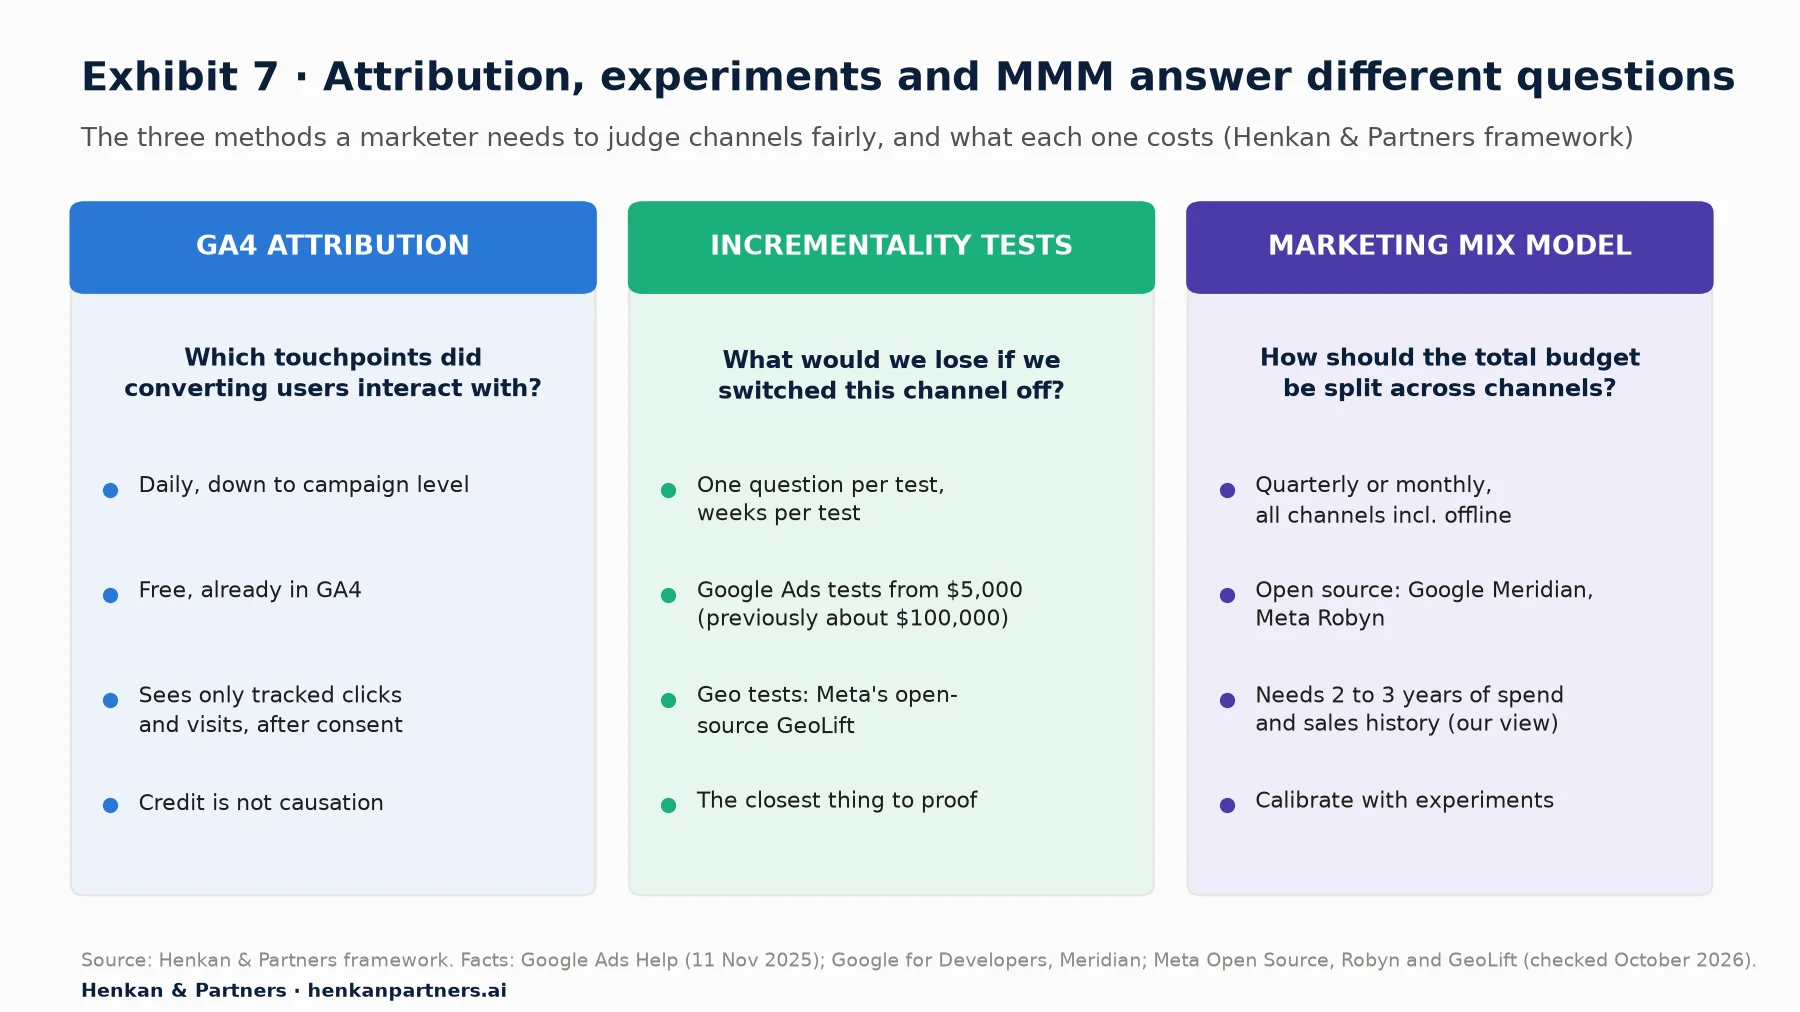
What this shows. No single method is enough. Attribution is fast but correlational. Experiments are causal but answer one question at a time. A marketing mix model covers every channel, including offline, but needs history and calibration. Used together, each corrects the blind spots of the others.
Incrementality tests: the closest thing to proof
An incrementality test switches a channel or campaign off (or on) for a randomly chosen group of users or regions and compares outcomes with a control group. Options, from simplest to most demanding:
- Platform lift tests. Ad platforms, including Google Ads, offer built-in lift studies. In November 2025 Google reduced the minimum spend for Google Ads incrementality experiments from "upwards of $100,000" to $5,000. These are run by the platform that sells the media, so ask how the control group is built.
- Geo tests. Turn a channel off in some regions and keep it on in comparable ones. Meta's open-source GeoLift, "the Open Source solution from Meta Open Source to calculate Lift at a geo-level", helps design and read them. You can use GA4 or, better, your order system to measure the outcome by region.
- Holdouts. Keep a share of customers out of email, retargeting or personalisation and compare. Our article on personalisation ROI measurement covers holdout design.
The statistics are the same as for A/B tests: you need enough volume and a long enough test to detect the effect you care about. See A/B test sample size and duration for the method.
Marketing mix models: splitting the whole budget
A marketing mix model (MMM) uses weekly or daily spend and sales over time, plus factors such as seasonality and price, to estimate how much each channel contributes and where extra spend stops paying back. It needs no user-level tracking, so consent and cookies do not affect it, and it covers offline media. Two free, open-source options exist: Google's Meridian, which Google describes as "an open-source MMM built by Google" that can be calibrated with experiments, and Meta's Robyn, "an experimental, AI/ML-powered and open sourced Marketing Mix Modeling (MMM) package from Meta Marketing Science". In our experience a useful model needs two to three years of consistent spend and sales history and someone who understands the statistics, or a partner who does.
Where AI assistants help, and where they do not
AI assistants can now query GA4 directly. Google's experimental Google Analytics MCP server, a Model Context Protocol server that lets assistants such as Gemini or Claude call the Analytics Admin and Data APIs, offers read-only tools such as `run_report` and `get_property_details`. That makes it quick to pull a model comparison by month, summarise paths or draft a channel readout. The risk is that the assistant inherits every setting described above without telling you. Always ask it to state the model, lookback window, key event, scope and date range it used, and check one number against the GA4 interface before sharing.
Section 11 · What to do next
What to do next: five steps to fairer channel decisions
1. Record your attribution settings this week
Open Admin > Data display > Events > Attribution settings (or Key events attribution), note the model, channels that can receive credit and both lookback windows, and start a settings log. Add a one-line settings header to every attribution dashboard.
2. Fix the inputs before the models
Check that every paid campaign carries consistent UTM parameters, that purchase and lead key events are reliable, and that non-Google costs are imported. Bring these requests to your developers with the GA4 Tracking Request Kit and log them in the shared GA4 tracking plan.
3. Run a monthly model comparison
Each month, compare data-driven with paid and organic last click for your main key event, read the change in credit with Table 3, and note days to key event for your top paths. Share the results with each channel owner in the same format.
4. Test the two channels that take the most budget
Pick the two largest channels by spend, write a hypothesis ("switching off brand search in these regions reduces revenue by less than its cost") and run a platform lift or geo test. Use the result to calibrate how much you trust attribution for that channel.
5. Decide whether you need a marketing mix model
If you spend across many channels, including offline, and have two or more years of history, scope an MMM and calibrate it with your experiments. Then continue with step 4 of the path, GA4 e-commerce reports for marketers. If you want help setting up attribution, lift tests or an MMM, Talk to us.
Disclosure: Henkan & Partners provides analytics, experimentation and measurement consulting, including attribution and incrementality work. We are not paid by Google or Meta for this article.
FAQ
Frequently asked questions about GA4 attribution
Frequently asked questions
What is GA4 attribution?
GA4 attribution is the set of rules Google Analytics 4 uses to give credit for a key event, such as a purchase or lead, to the marketing touchpoints that came before it. It is controlled by the reporting attribution model, the channels that can receive credit and the lookback window, and it mainly shows in the Advertising section's attribution reports.
Which attribution models are available in GA4?
Three: data-driven (the default), paid and organic last click, and Google paid channels last click. First click, linear, time decay and position-based models are no longer available as of November 2023.
What is the default attribution model in GA4?
Data-driven attribution. Event-scoped traffic-source dimensions use it unless you change the reporting attribution model in Admin > Data display > Events > Attribution settings (labelled Key events attribution in some help pages). User-scoped and session-scoped dimensions always use paid and organic last click.
How does data-driven attribution work in GA4?
GA4 uses your property's converting and non-converting paths to build models of the probability of a key event, then shares credit according to how much each touchpoint changes that estimated probability. It considers factors such as timing, device and the order of interactions. It is a model built on observed data, not an experiment.
What is the lookback window in GA4?
It is how far back GA4 looks for touchpoints that can receive credit. For acquisition key events (first_visit and first_open) the default is 30 days, with 7 days as the alternative. For all other key events the default is 90 days, with 60 or 30 days as alternatives. Changes apply going forward only.
Where is the model comparison report in GA4?
Click Advertising in the left navigation, then go to Attribution > Attribution models. Google's documentation calls it the key event attribution models report. It lets you compare two models side by side by channel group, source, medium or campaign. Google says you need to link the property to a Google advertising product, such as Google Ads, to view advertising reports.
Why does direct traffic get no credit in GA4 attribution?
All GA4 attribution models exclude direct visits from receiving credit unless the whole path consists of direct visits. The credit goes to the last non-direct channel under last click, or is shared among non-direct touchpoints under data-driven.
Does changing the attribution model change historical data?
Yes. Changing the reporting attribution model applies to historical and future data, so past reports will show different numbers. Changes to the lookback window apply going forward only. Keep a log of every change.
Is GA4 attribution the same as incrementality?
No. Attribution assigns credit to touchpoints that happened before a key event. Incrementality measures the sales that would not have happened without the marketing, using a control group. Published field studies at eBay and Facebook found observational estimates far above experimental ones, so check large channels with lift tests or a marketing mix model.
Key terms
- Attribution
- Assigning credit for a key event to the touchpoints before it. It matters because it shapes which channels look profitable and get budget.
- Key event
- An event marked in GA4 as important to the business, such as purchase or generate_lead (formerly called a conversion in GA4; "conversion" now means a Google Ads conversion created from a key event). It matters because attribution reports only credit key events.
- Data-driven attribution
- GA4's default model, which shares credit based on how each touchpoint changes the estimated probability of a key event. It matters because it credits openers and assisters that last click ignores, but it cannot be audited.
- Paid and organic last click
- A model that gives 100% of credit to the last non-direct channel clicked. It matters as a stable, explainable baseline to compare with data-driven.
- Google paid channels last click
- A model that gives 100% of credit to the last Google Ads click, falling back to paid and organic last click if there is none. It matters because it shows Google Ads' view, not a neutral cross-channel one.
- Lookback window
- The period before a key event in which touchpoints can receive credit (30 or 7 days for first visits; 90, 60 or 30 days otherwise). It matters because short windows penalise channels with long journeys.
- Touchpoint
- An interaction with a channel before a key event, such as an ad click, a visit or an email click. It matters because untracked touchpoints cannot receive credit.
- Event-scoped dimension
- A traffic-source dimension with no prefix, such as source / medium, that follows the reporting attribution model. It matters because only these dimensions change when you change the model.
- Reporting time
- The option in attribution reports to count credit by event time (key events in the date range) or ad interaction time (touchpoints in the date range). It matters because the two give different totals for the same period.
- Direct traffic
- Visits with no known source, such as typed URLs or untagged links. It matters because GA4 attribution never credits direct unless the whole path is direct.
- Incrementality
- The sales caused by marketing, measured against a control group that did not see it. It matters because it is the only direct test of whether a channel creates value.
- Geo test
- An experiment that changes marketing in some regions and compares them with similar control regions. It matters because it measures lift without user-level tracking or cookies.
- Marketing mix model (MMM)
- A statistical model of sales over time as a function of spend by channel and other factors. It matters because it covers all channels, including offline, and guides total budget allocation.
- Return on ad spend (ROAS)
- Attributed revenue divided by ad cost. It matters because it is only comparable across channels when costs are imported and the same model is used.
Sources
All sources were checked in October 2026. Google documentation is cited as published on Google's help and developer sites at that date; Google updates these pages without version numbers, and GA4 menu names may change. The Google Ads incrementality figures come from Google's own announcement. The eBay and Facebook results are peer-reviewed academic studies. Exhibits 3, 4 and 5 use illustrative data; Exhibit 7 and Tables 3 and 4 are Henkan & Partners frameworks; the history requirement for marketing mix models is our own rule of thumb.
- Google Analytics Help (n.d.). Get started with attribution.
- Google Analytics Help (n.d.). Select attribution settings.
- Google Analytics Help (n.d.). Change the reporting attribution model for key events.
- Google Analytics Help (n.d.). Key event attribution models report.
- Google Analytics Help (n.d.). Key events attribution paths report.
- Google Analytics Help (n.d.). Scopes of traffic-source dimensions.
- Google Analytics Help (n.d.). All channels performance report.
- Google Analytics Help (n.d.). Get started with advertising.
- Google Analytics Help (n.d.). Creating and managing conversions.
- Google Analytics Help (n.d.). Conversions vs. key events in Google Analytics.
- Google Analytics Help (n.d.). Touchpoint.
- Google Analytics Help (n.d.). Default channel group.
- Google Ads Help (2023). First click, linear, time decay, and position-based attribution models are going away.
- Google Ads Help (2025). Strengthen media measurement and ROI clarity with incrementality testing improvements.
- Search Engine Land (2025). Google makes incrementality testing easier, cheaper, and faster.
- Google for Developers (n.d.). Meridian.
- Meta Open Source (n.d.). Robyn.
- Meta Open Source (n.d.). GeoLift.
- Google Analytics on GitHub (n.d.). Google Analytics MCP server.
- Blake, T., Nosko, C. & Tadelis, S. (2015). Consumer Heterogeneity and Paid Search Effectiveness: A Large-Scale Field Experiment. Econometrica 83(1).
- Gordon, B., Zettelmeyer, F., Bhargava, N. & Chapsky, D. (2019). A Comparison of Approaches to Advertising Measurement: Evidence from Big Field Experiments at Facebook. Marketing Science 38(2).