Focus
GA4 E-commerce Reports for Marketers and Merchandisers: Products, Promotions, Audiences and Revenue
Alexandre Suon · 2026-10-02
GA4 e-commerce reports tell marketers and merchandisers which products, promotions, channels and landing pages make money, provided the shop sends the right events. This final analysis step of The ABC of GA4 for Marketers shows where each Monetization report lives, how to read item metrics such as cart-to-view rate, how to build cart-abandoner and high-value audiences, when predictive audiences are realistic, and how to run a one-page weekly trading review.
Executive summary
- GA4's e-commerce reports are only as good as the events behind them. Google is explicit: if a required parameter is missing, the event is treated as a custom event and drops out of the Ecommerce purchases report.
- Six reports answer most trading questions. Monetization overview, Ecommerce purchases, Promotions, Purchase journey and Checkout journey sit under Reports > Monetization; the Landing page report and Advertising > Planning > All channels add revenue by entry page and return on ad spend.
- Products leak at different steps, so read ratios, not totals. Items viewed, items added to cart and items purchased give each product a small funnel. Plotting traffic against cart-to-view rate splits the range into stars, traffic leaks, hidden gems and long tail.
- Promotions and item lists get no credit unless developers carry them forward. Google asks you to add promotion_id or promotion_name to every later e-commerce event if you want to link purchases to a promotion. Without that, the Promotions report shows clicks, not sales.
- Build two audiences first: cart abandoners and high-value buyers. Audiences are not retroactive, backfill at most 30 days, take 24 to 48 hours to fill and are capped at 100 per standard property. Predictive audiences need at least 1,000 returning purchasers and 1,000 non-purchasers in a 7-day period within the last 28 days, which many shops never reach.
- A one-page weekly trading review beats a 40-tile dashboard. Four headline numbers and five blocks (channels, products, promotions, checkout, audiences) keep the meeting on decisions. AI can draft the commentary; people must check the data.
Section 1 · Why it matters
GA4 e-commerce reports turn traffic data into trading decisions, if the events are complete
GA4 e-commerce reports are the Google Analytics 4 reports and explorations built on the recommended e-commerce events (view_item, add_to_cart, begin_checkout, purchase, view_promotion and others). They show revenue, buyers, products, item lists, promotions, coupons and checkout steps, so that marketers and merchandisers can see what sells, through which channel and at what point shoppers drop out.
Acquisition reports answer where people came from. A trading team also needs to know what they looked at, what they bought, which banner moved them and who to bring back. Those answers live in the Monetization reports and in audiences, and they need richer events than a simple purchase tag.
This article is the second C (Conclude) step of The ABC of GA4 for Marketers. It builds on GA4 for marketers (acquisition reports and key events), UTM conventions and ad platform links and attribution in GA4. For how GA4 counts events and sessions, see How GA4 actually works.
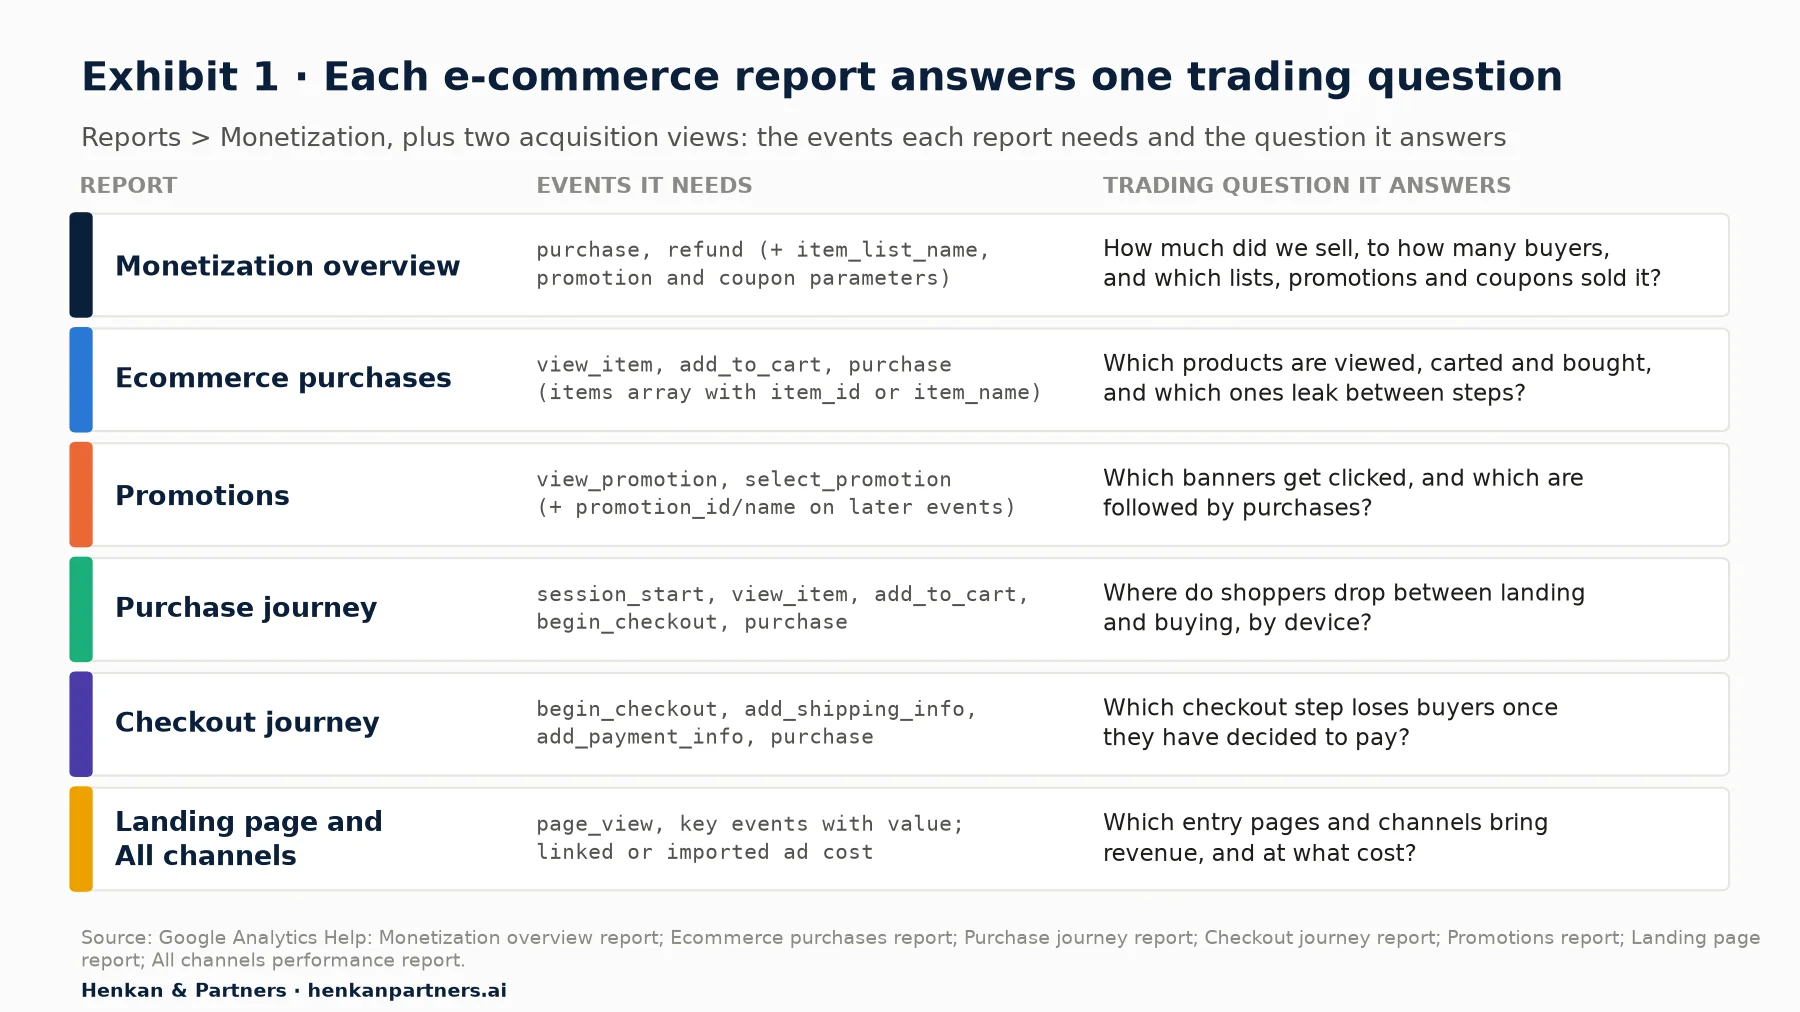
What this shows. Every report on the right-hand side is only as complete as the events in the middle column. A shop that sends only purchase sees revenue but no product funnel; one that never sends view_promotion has an empty Promotions report. Use it as a checklist before reading any number.
Before reading any e-commerce number, check three things: that the events exist (Reports > Engagement > Events), that a week of purchase revenue roughly matches the order system (our GA4 audit checklist for e-commerce gives the method), and that currency is sent with every value, as Google's developer guide requires.
Section 2 · Where the reports are
The Monetization reports sit in the Life cycle collection, and three revenue metrics mean three different things
In a standard property the e-commerce reports live under Reports > Monetization, in the Life cycle collection. Google's help pages list Monetization overview, Ecommerce purchases, Purchase journey, Checkout journey and Promotions there. If one is missing, an editor or administrator can add it back from the report library; if your property uses the Business objectives collection instead, an editor may need to add them there.
What the Monetization overview shows
The overview is a dashboard of cards. According to Google, it shows total revenue, purchase revenue, total purchasers, first-time purchasers and average purchase revenue per active user, plus cards for items purchased by item name and by item list name, items viewed in promotions by promotion name, and purchase revenue by order coupon. Use it to spot movement, then open a detail report to explain it.
Total revenue, purchase revenue and item revenue are not interchangeable
| Metric | What it includes | Use it for | Watch out for |
|---|---|---|---|
| Total revenue | Revenue from e-commerce purchases, in-app purchases, subscriptions and advertising, minus refunds (Google's definition) | Business-level totals, and the revenue metric used in acquisition and landing page reports | Includes ad revenue if you run ads on an app or site, so it can exceed shop sales |
| Purchase revenue | Revenue from e-commerce and in-app purchases only | Weekly trading figures and comparison with the order system | Still depends on what developers put in value (tax, shipping, discounts) |
| Item revenue | Revenue recorded at item level, from the items in purchase events | Product, category, brand, list and promotion analysis | Item-scoped: it cannot be mixed with event-scoped metrics in one table |
Agree one definition of revenue with finance (tax, shipping, refunds) and label every chart with the metric name.
Item scope is the trap that breaks most custom tables
Event-scoped metrics count events (add to carts, ecommerce purchases); item-scoped metrics count the products inside them (items added to cart, items purchased). Google states that "event-scoped and item-scoped dimensions and metrics are incompatible with one another in reports and explorations". Put Item name next to Sessions in an exploration and you get empty cells. Keep product questions and channel questions in separate tables.
Section 3 · Products
Each product has its own small funnel, so read item ratios rather than revenue alone
Open Reports > Monetization > Ecommerce purchases. Google describes it as a pre-made detail report about the products you sell. By default it shows items by Item name, with Items viewed, Items added to cart, Items purchased and Item revenue; you can switch the dimension to item ID, brand or one of five item category levels. Google notes that e-commerce events are never collected automatically, and that some metrics only populate from 8 September 2022.
Revenue ranks products by size; ratios show where each loses shoppers:
- Item list click-through rate: users who selected an item from a list divided by users who viewed that list. Are lists making people click?
- Cart-to-view rate: users who added a product to cart divided by users who viewed that product (Google's Data API definition). The best signal of whether page, price and photos persuade.
- Purchase-to-view rate: users who bought a product divided by users who viewed it.
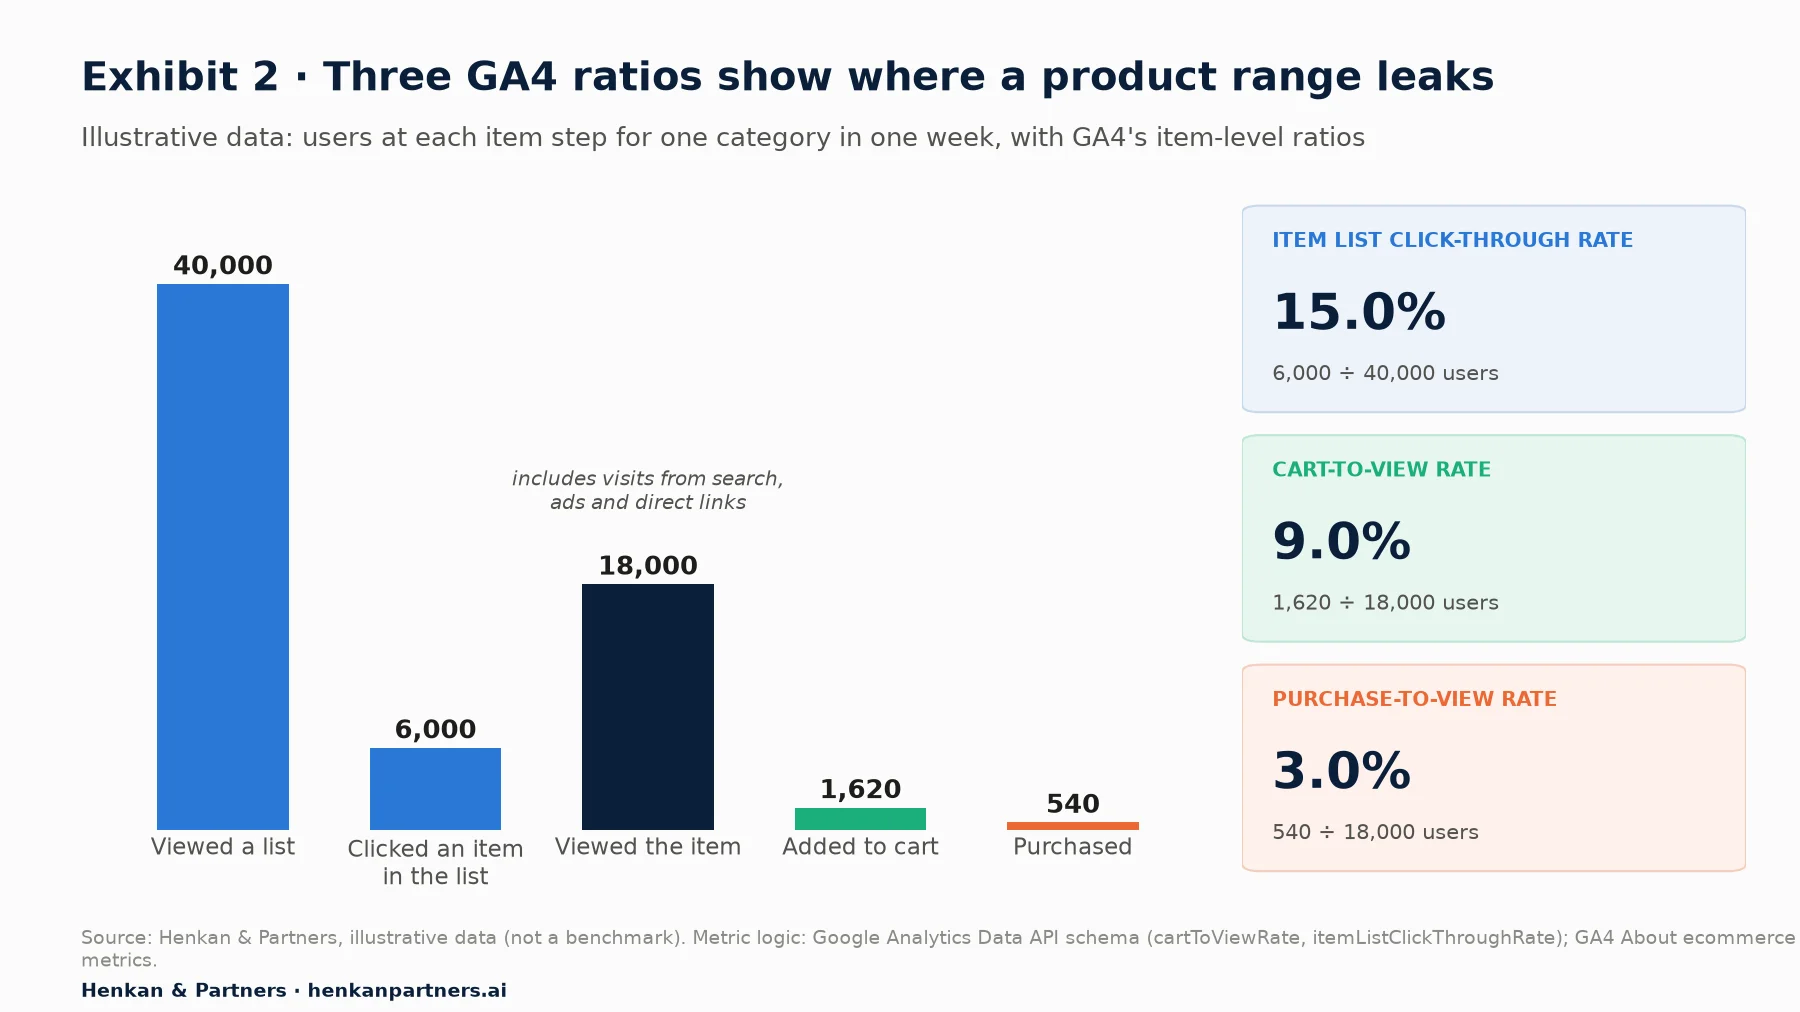
What this shows. Item views exceed list clicks because shoppers also land on product pages from search and ads. Here lists work, but only 9% of viewers add to cart; Exhibit 3 shows which products drag the average down.
Step by step: product ratios in an exploration
- Go to Explore and start a Free form exploration.
- Import Item name and Item category, and the metrics Items viewed, Items added to cart, Items purchased, Item revenue and Cart-to-view rate.
- Put Item name in Rows, the metrics in Values, and show 250 or more rows.
- Filter on one Item category so products share a benchmark, then export to plot Exhibit 3.
For marketers. A product with high views and a weak cart-to-view rate is often an ad problem, not a page problem: the ad promised something the page does not deliver (price, colour, delivery time).
For leaders. Ask for ratios by category every week. A falling cart rate on a best-seller warns you days before revenue drops.
Section 4 · Merchandising decisions
Plotting traffic against cart-to-view rate tells you which products to fix, feature or leave alone
Take one category, put items viewed on the horizontal axis (log scale) and cart-to-view rate on the vertical axis, and draw lines at the medians. Each quadrant implies a different action.
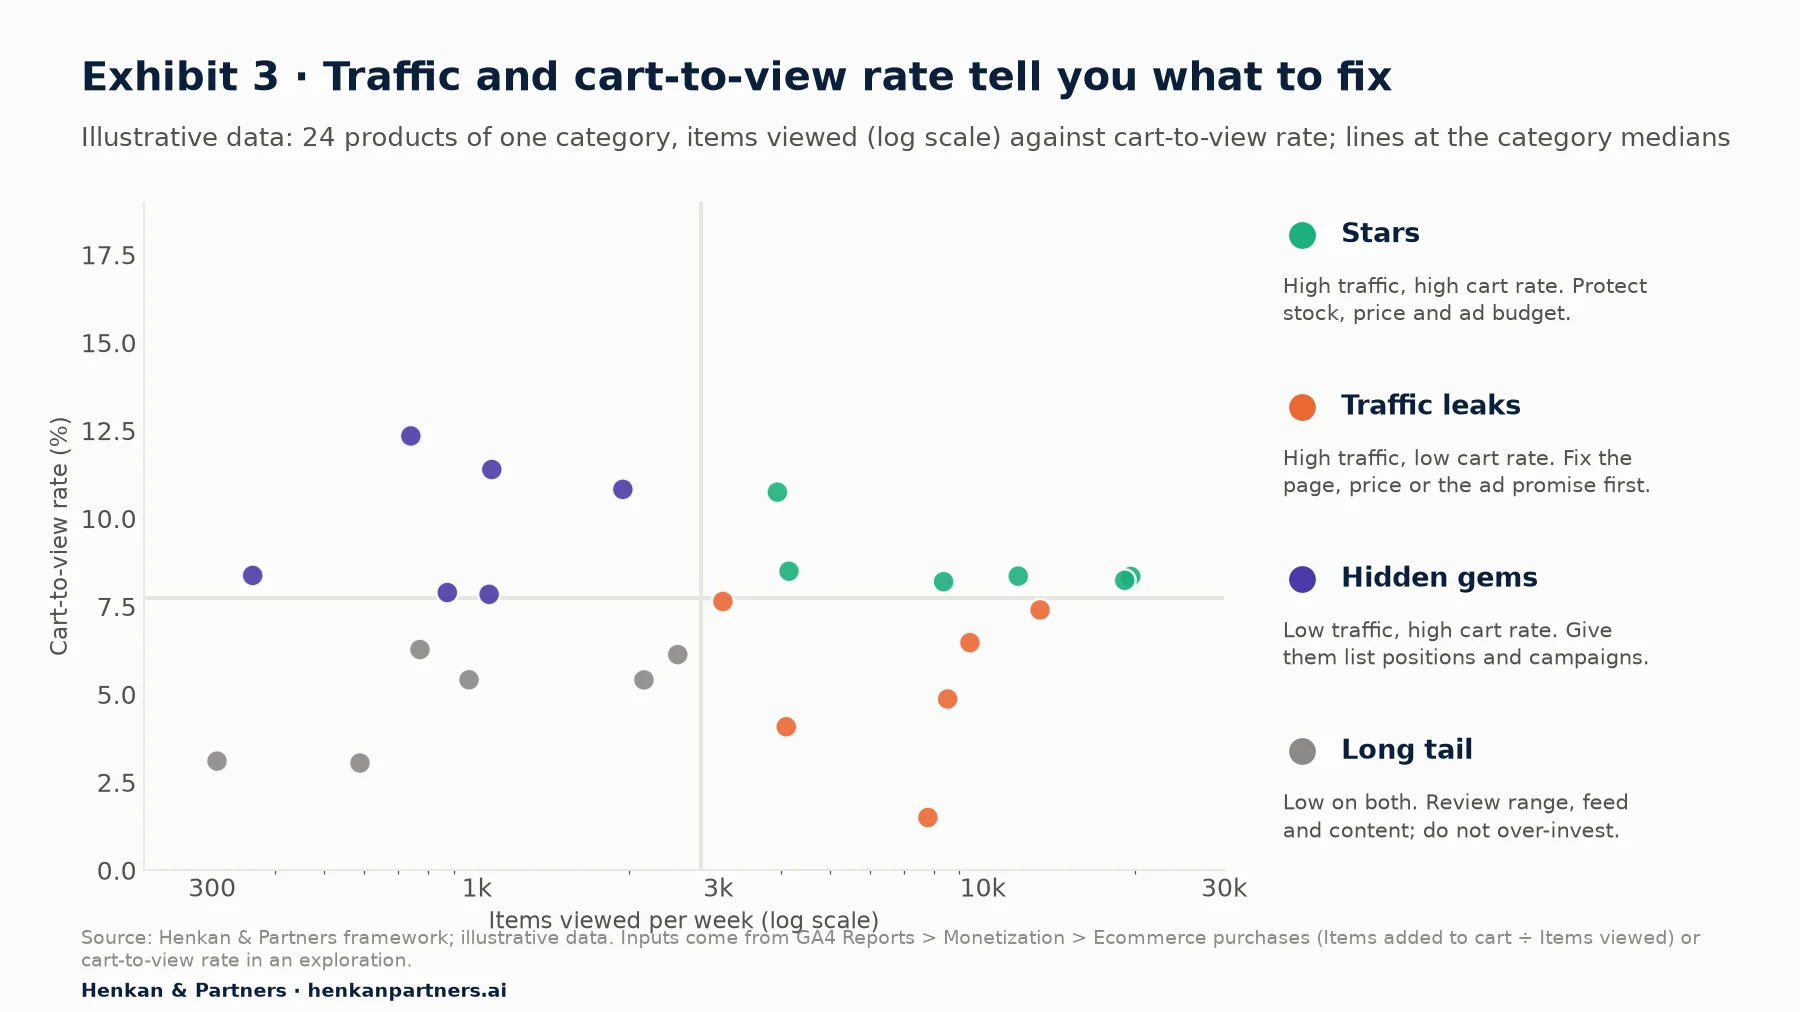
What this shows. Traffic leaks already get attention that does not turn into carts, so fix price, images, sizing, stock or the ad promise first. Hidden gems deserve more exposure; stars need protecting; the long tail rarely justifies effort.
Worked example: one category, four decisions (illustrative)
| Product (illustrative) | Items viewed / week | Cart-to-view rate | Quadrant | Decision |
|---|---|---|---|---|
| Linen shirt, white | 19,800 | 8.3% | Star | Secure stock for the season; keep it in the hero banner |
| Linen shirt, navy | 7,900 | 1.5% | Traffic leak | Check the ad: it shows the white shirt; fix photos and size guide |
| Wool overshirt | 750 | 12.4% | Hidden gem | Move to position 1–4 in the category list; add to email |
| Canvas belt | 600 | 3.0% | Long tail | No action; review at range planning |
Add item-scoped custom dimensions for attributes such as colour, margin band or season; a standard property allows 10 (25 on Analytics 360), so see e-commerce custom dimensions before using a slot. The quadrant tells you where to look; only a test proves a change worked.
Section 5 · Lists and promotions
Item lists and promotions only get credit for sales if developers carry their names forward
Banners, category sorting and carousels are measurable only with two extra pairs of events: view_item_list and select_item for lists, and view_promotion and select_promotion for internal promotions, each with names (item_list_name; promotion_id, promotion_name, creative_name, creative_slot).
The Promotions report
At Reports > Monetization > Promotions (an editor may need to add it), promotions are listed by Item promotion name with Items viewed in promotion, Items clicked in promotion, Item promotion click-through rate, Items purchased and Item revenue.
The last two columns are where most teams get misled. Google's setup guide is explicit: "If you want to measure when someone makes a purchase after they view or click a promotion, make sure to add at least one of the parameters — promotion_id or promotion_name — to every subsequent ecommerce event." In other words, do not expect GA4 to carry the name forward on its own (practitioners such as Simo Ahava note the same for item lists), or a banner can show thousands of clicks and zero revenue.
| You want to know | Events needed | Parameters to carry forward | Where to read it |
|---|---|---|---|
| Which banners get seen and clicked | view_promotion, select_promotion | promotion_id or promotion_name, creative_name, creative_slot | Promotions report |
| Which banners lead to sales | add_to_cart, begin_checkout, purchase | promotion_id or promotion_name on items in every later event | Promotions report (Items purchased, Item revenue) |
| Which lists and carousels get clicked | view_item_list, select_item | item_list_id, item_list_name, index (position) | Monetization overview card; exploration with Item list name |
| Which lists lead to sales | add_to_cart, purchase | item_list_name on the items in later events | Exploration: Item list name × Items purchased |
Send this table to developers with our dataLayer spec article, and agree a promotion naming convention (for example `2026-10_hero_new-season`) as you would for UTMs.
Step by step: promotion performance over time
Google's recipe: Explore > Free form; add Item promotion name and Items viewed in promotion; choose the line chart; drag the dimension to Breakdowns and the metric to Values. Add Item revenue to compare exposure with results.
Section 6 · Revenue by channel and page
Revenue by channel and landing page uses session scope, and return on ad spend needs cost data
Three places show revenue by source, each with its own scope.
- Reports > Acquisition > Traffic acquisition. Sessions grouped by Session default channel group, with key events and total revenue.
- Reports > Engagement > Landing page. Google defines the landing page as the page path and query string of the first page view in a session, with key events and total revenue by default. Query strings are included, so group variants of a page before judging it.
- Advertising > Planning > All channels. Google's All channels performance report adds ads cost, cost per key event and return on ad spend. Costs come from linked Google Ads, Search Ads 360 and Display & Video 360 accounts, and from imported campaign data.
Since July 2026 Google requires a currency field on imported cost data, and since August 2026 a validation report checks imported campaign data; check it before comparing ROAS across channels. How credit is split is covered in attribution in GA4.
Link Merchant Center to see free product listings as a channel
If you sell through Google Shopping, link Merchant Center under Admin > Product links > Merchant Center links. Google says the link adds an Organic Shopping channel for free listings, tags those clicks automatically with an srsltid parameter, and exports your purchase key events to Merchant Center for its reporting.
Our view. Use one scope per question and say it on the chart. "Revenue by channel (session scope, last week)" and "Revenue by first user channel" are both correct and usually different. Mixing them on one slide turns trading meetings into data debates.
Section 7 · Checkout
The purchase and checkout journeys show where buyers drop, but not why
Two ready-made funnels sit under Reports > Monetization. The Purchase journey has five steps: session start, view product (view_item), add to cart, begin checkout and purchase. It is closed by default (only users who complete each step), can be toggled to open, and breaks down by Device category by default. The Checkout journey has four steps: begin_checkout, add_shipping_info, add_payment_info and purchase. It shows abandonment between steps and cannot be customised.
Read them by device first, then week on week, because absolute abandonment is always high: Baymard Institute's average across 50 studies is 70.22%.
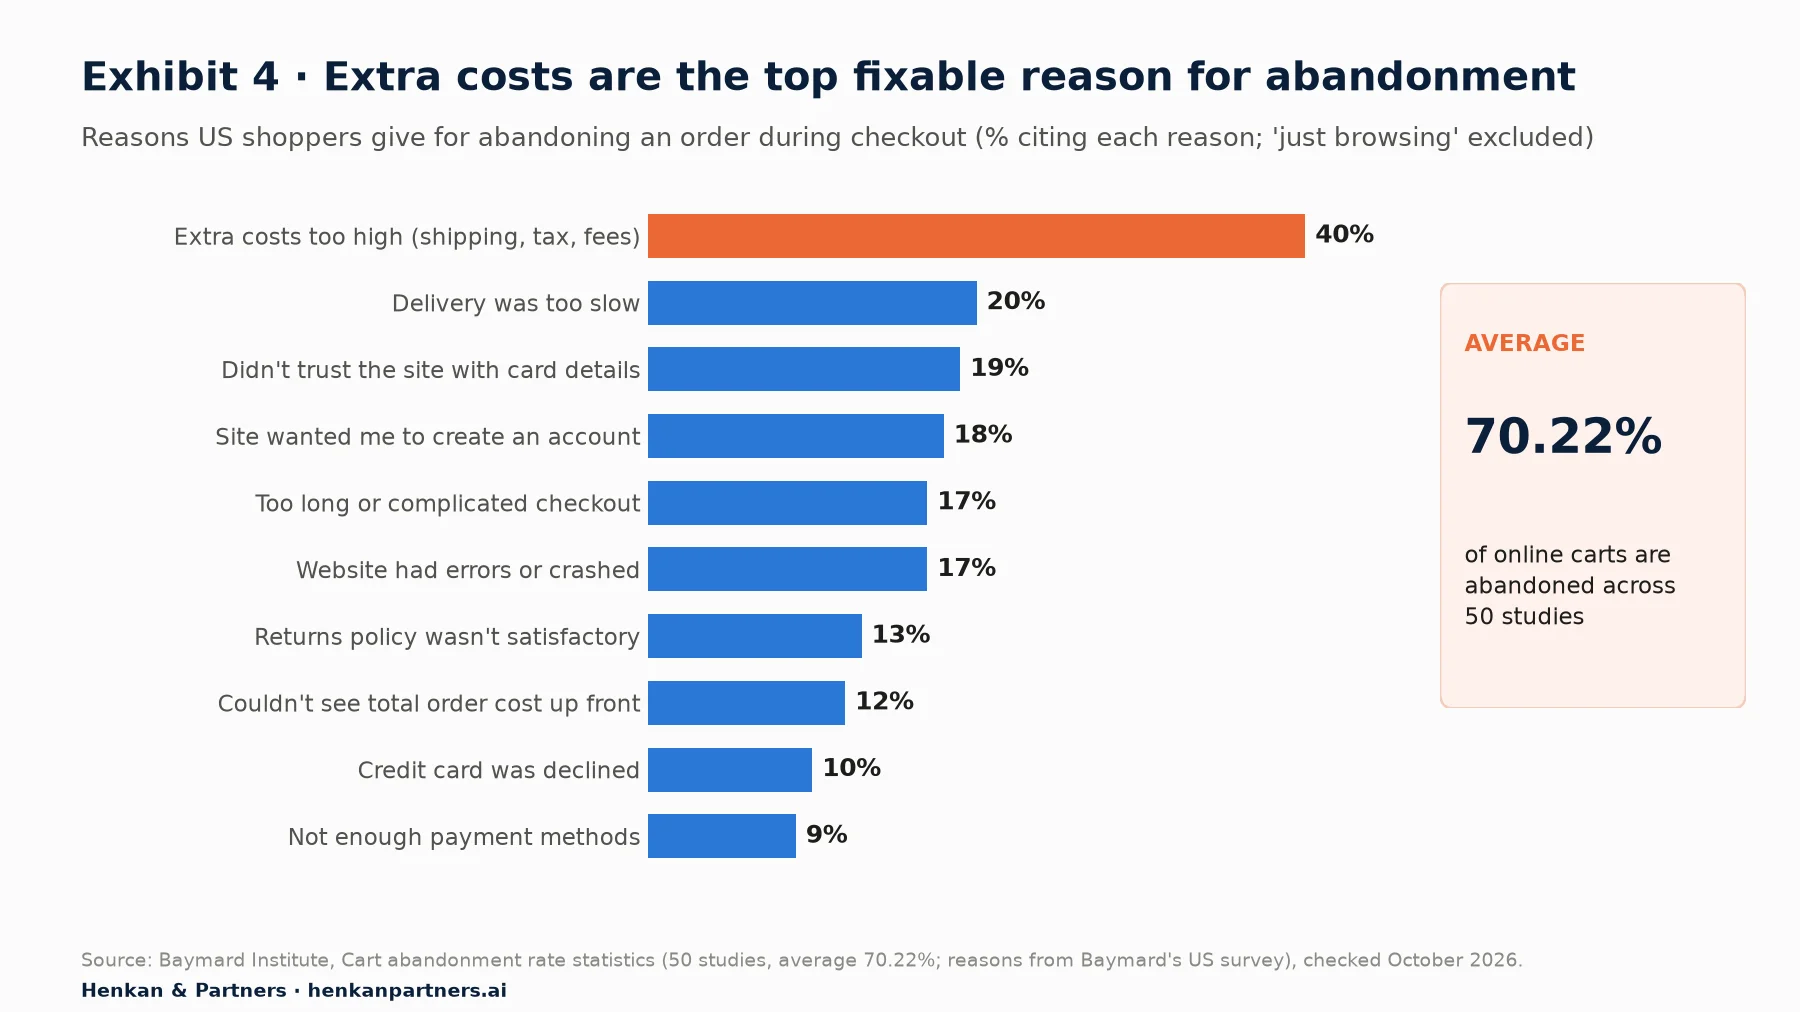
What this shows. GA4 shows which step loses buyers; Baymard's data suggests why it often happens. A big drop after add_shipping_info points to delivery cost or speed; one after add_payment_info points to trust, payment methods or declines. Treat these as hypotheses to confirm.
The report is only as good as add_shipping_info and add_payment_info; Google notes that Shopify stores must add add_shipping_info themselves. Pair drop-off with session replay and our product page and checkout optimisation ideas; funnel and cohort analysis covers custom funnels.
Section 8 · Audiences
Cart abandoners and high-value buyers are the two audiences every shop should build first
An audience is a group of users who meet conditions you define. Use it in reports and, once Google Ads is linked with personalised advertising allowed, for remarketing. Create it under Admin > Data display > Audiences, and know Google's rules:
- Audiences are not retroactive. Users enter from the day you create the audience, although GA4 backfills up to 30 days of data where available. Build Black Friday audiences in September.
- They take 24 to 48 hours to fill, and conditions cannot be edited after saving.
- There are limits. 100 audiences per standard property (400 on Analytics 360), up to 10 conditions per audience, and a maximum membership duration of 540 days.
- Scope matters. Each condition applies across all sessions, within the same session or within the same event.
Recipe 1: cart abandoners, last 7 days
- Admin > Data display > Audiences > New audience > Create a custom audience.
- Include users when the event add_to_cart occurs (scope: across all sessions).
- Add an Exclude group: temporarily exclude users when purchase occurs, so buyers leave the audience as soon as they order.
- Set membership duration to 7 days, to match the window in which a reminder is useful.
- Name it `rmk_cart-abandoners_7d` and check its size after 48 hours.
Recipe 2: high-value buyers
- Create a custom audience and include users when the event purchase occurs with the parameter value greater than your high-value threshold (for example, the top 10% of order values in your back office; illustrative).
- Keep membership long (up to 540 days) and use it as a report comparison and, if consent allows, a Google Ads seed or exclusion list.
Next candidates: viewers who never carted, recent first-time buyers and category buyers. GA4 personalisation segments shows how to rank them; the UTM and ad platform links article covers Google signals and consent.
Section 9 · Predictive audiences
Predictive audiences need 1,000 buyers and 1,000 non-buyers in a seven-day window, which many shops never reach
GA4 can predict three things for each active user: purchase probability (the chance a user active in the last 28 days logs a purchase key event in the next 7 days), churn probability (the chance a user active in the last 7 days is not active in the next 7) and predicted revenue (expected purchase revenue in the next 28 days).
| Template | Google's definition | Typical use |
|---|---|---|
| Likely 7-day purchasers | Users who are likely to make a purchase in the next 7 days | Bid up; avoid discounting likely buyers |
| Likely first-time 7-day purchasers | Users who are likely to make their first purchase in the next 7 days | Welcome offers |
| Predicted 28-day top spenders | Users who are predicted to generate the most revenue in the next 28 days | Early access; exclude from discounts |
| Likely 7-day churning purchasers | Purchasing users who are likely to not visit your property in the next 7 days | Win-back campaigns |
| Likely 7-day churning users | Users who are likely to not visit your property in the next 7 days | Re-engagement content |
The catch is eligibility. Google requires that, over a seven-day period within the last 28 days, at least 1,000 returning users triggered the predictive condition (for example, purchased) and at least 1,000 did not. Purchase events need value and currency, and if model quality drops, predictions stop updating. That excludes many small and mid-sized shops.
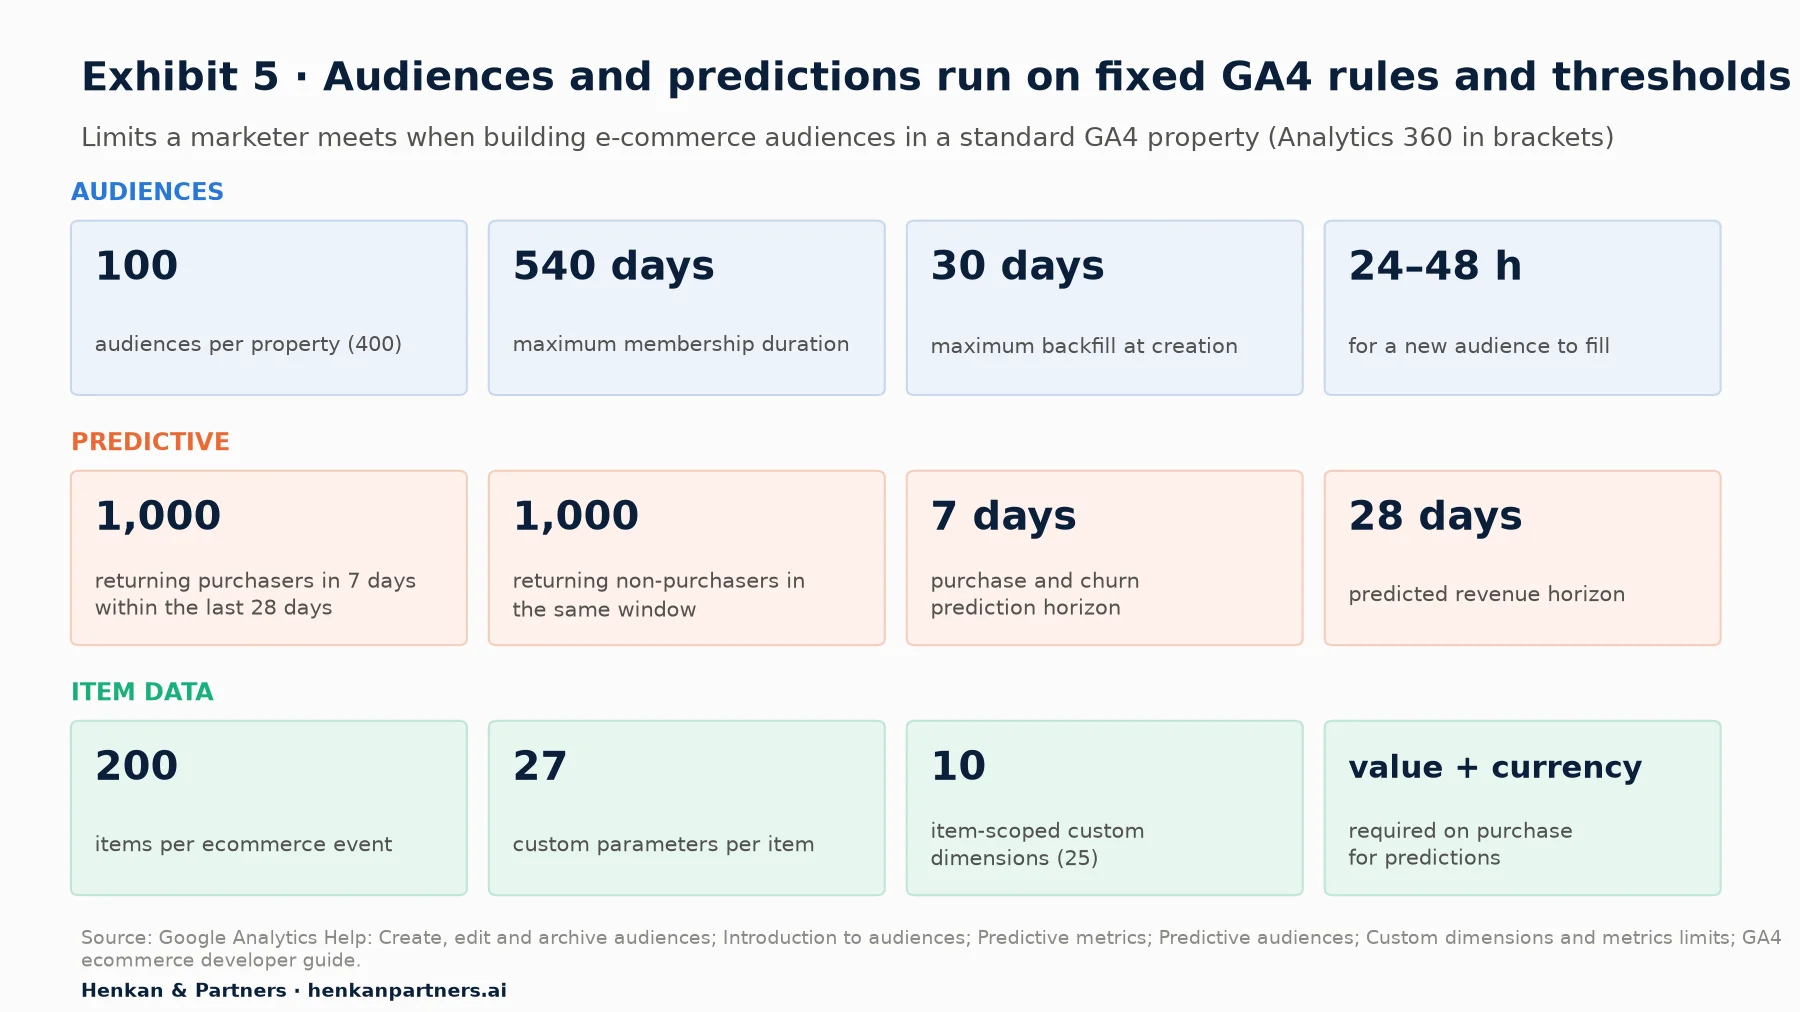
What this shows. These are fixed by Google. The 1,000-and-1,000 rule decides whether predictive audiences exist for you; check the Predictive templates in the audience builder. Item limits only bite for marketplaces with large baskets or rich attributes.
For marketers. If you are not eligible, build a rule-based proxy: users who viewed three or more products and added to cart in the last 7 days, or repeat buyers with an order value above your median.
For leaders. A predictive audience is a targeting tool, not proof of value. Ask for a holdout test before scaling spend on it, as explained in our personalisation ROI measurement article.
Section 10 · Weekly trading review
A one-page weekly trading dashboard keeps the meeting on decisions, not on data
In our experience, reviews that work use one page, the same layout every week and five questions. Build it in GA4, Looker Studio or a spreadsheet.
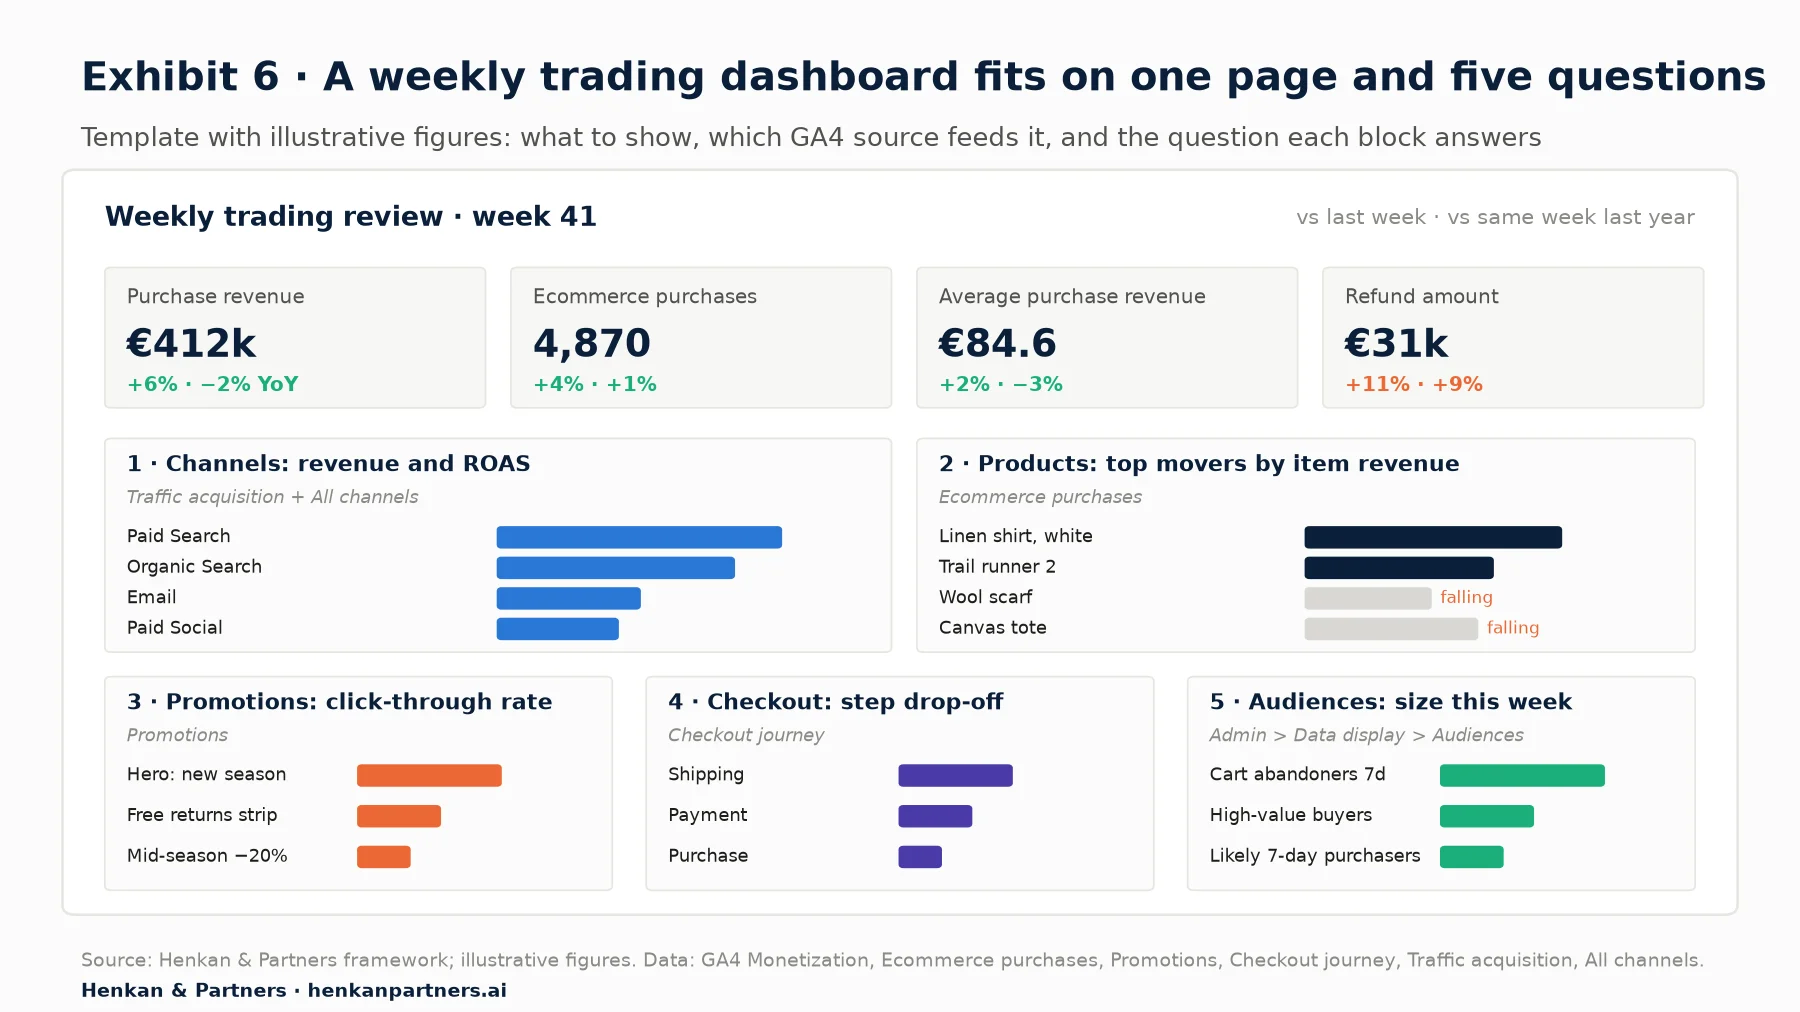
What this shows. Every block answers a question someone in the room can act on: shift budget, fix a product page, swap a banner, fix a checkout step or launch a campaign to an audience. Comparing with the same week last year separates real change from seasonality.
Where AI helps in the trading review, and where it does not
GA4 added generated insights to the Home page in February 2026, summarising the top three data changes since your last visit. Google has also published an experimental Google Analytics MCP server that lets AI assistants query a property in natural language. Both help with a first draft. They do not know your promotions calendar or tracking bugs, and can confidently explain a drop that is really a broken purchase tag. Let AI draft; let a person check against the back office. See e-commerce KPIs and benchmarks for which KPIs deserve a place.
Section 11 · What to do next
What to do next: five steps to a trading view your team trusts
1. Check the e-commerce events this week
List the e-commerce events your shop sends and compare a week of revenue with the order system, using the GA4 audit checklist for e-commerce (step 5 of this path).
2. Ask developers for lists, promotions and carried-forward names
Send Table 3 to your developers, with your naming convention for promotions and lists. Download the GA4 Tracking Request Kit for the event spec template and QA checklist, and record the request in the shared GA4 tracking plan, step 6 of this path.
3. Plot one category by traffic and cart rate
Plot your largest category and agree one leak to fix, one gem to promote and one star to protect.
4. Build cart-abandoner and high-value audiences now
Create both today, check predictive eligibility, and plan a holdout for the first one you activate.
5. Run the one-page trading review for four weeks
Use the Exhibit 6 layout for four weeks, then drop blocks that led to no decision. For help with events, reports or the review, talk to us.
FAQ
Frequently asked questions about GA4 e-commerce reports
Frequently asked questions
What are GA4 e-commerce reports?
They are the Google Analytics 4 reports built on the recommended e-commerce events: Monetization overview, Ecommerce purchases, Promotions, Purchase journey and Checkout journey under Reports > Monetization, plus revenue columns in acquisition and landing page reports.
Where are the e-commerce reports in GA4?
In the Life cycle collection under Reports > Monetization. If one is missing, an editor or administrator can add it back from the report library.
Why is my GA4 Ecommerce purchases report empty?
GA4 does not collect e-commerce events automatically. Your site must send events such as view_item, add_to_cart and purchase with an items array. Google notes that if a required parameter is missing, the event is treated as a custom event and does not appear in the report.
What is cart-to-view rate in GA4?
It is the number of users who added a product to their cart divided by the number of users who viewed the same product.
What is the difference between total revenue and purchase revenue in GA4?
Purchase revenue covers e-commerce and in-app purchases. Total revenue adds subscriptions and advertising revenue, minus refunds.
Why do my GA4 promotions show clicks but no revenue?
Usually because the promotion name is only sent with the view and click events. Google asks you to add promotion_id or promotion_name to every subsequent e-commerce event (add_to_cart, begin_checkout, purchase) if you want to link purchases to a promotion.
How do I create a cart abandonment audience in GA4?
Go to Admin > Data display > Audiences, create a custom audience that includes users who triggered add_to_cart, temporarily excludes users who triggered purchase, and set a membership duration such as 7 days. It fills within 24 to 48 hours.
Why can't I use predictive audiences in GA4?
Your property must have at least 1,000 returning users who purchased and 1,000 who did not over a seven-day period within the last 28 days, send purchase events with value and currency, and keep model quality above Google's threshold.
Can I see return on ad spend in GA4?
Yes, in Advertising > Planning > All channels, which shows ads cost, cost per key event and return on ad spend. Costs come from linked Google ad accounts and imported cost data.
Key terms
- Monetization reports
- The group of GA4 reports under Reports > Monetization that show revenue, buyers, products, promotions and checkout steps. They matter because they are where trading questions are answered.
- Recommended e-commerce events
- Google's standard event names for shopping actions, from view_item_list to purchase and refund. They matter because the reports only populate when these exact names and parameters are sent.
- Items array
- The list of products attached to an e-commerce event, each with an ID or name, price, quantity and other attributes. It matters because all product-level metrics are built from it.
- Item-scoped metric
- A metric that counts products inside events, such as items added to cart. It matters because it cannot be combined with event-scoped metrics in one table.
- Cart-to-view rate
- Users who added a product to cart divided by users who viewed it. It matters because it isolates how well the product page and offer persuade.
- Item list
- A named set of products shown together, such as a category page, search results or a carousel, tracked with view_item_list and select_item. It matters because list position and design drive what gets seen.
- Internal promotion
- A banner, tile or pop-in on your own site, tracked with view_promotion and select_promotion. It matters because merchandising effort is only measurable if promotions are tracked and carried forward.
- Purchase revenue
- Revenue from e-commerce and in-app purchases. It matters because it is the cleanest GA4 figure to compare with the order system.
- Closed funnel
- A funnel that counts only users who enter at the first step and complete the steps in order. It matters because open and closed funnels give different drop-off rates for the same journey.
- Audience
- A group of users who meet conditions you define, usable in reports and linked ad platforms. It matters because audiences are not retroactive and must be built before you need them.
- Predictive audience
- An audience based on GA4's machine-learned purchase, churn or revenue predictions. It matters because it is only available above Google's 1,000-and-1,000 eligibility threshold.
- Return on ad spend (ROAS)
- Revenue attributed to advertising divided by its cost. It matters because GA4 can only show it when cost data is linked or imported.
Sources
All sources were checked in October 2026. Google documentation is cited as published on Google's help and developer sites at that date; Google updates these pages without version numbers, and interface paths and report placements can change or differ when report collections have been edited. The definitions of cart-to-view rate and item list click-through rate come from Google's Data API documentation and announcements; purchase-to-view rate is described by analogy, as its full definition could not be retrieved from Google's schema page. Baymard Institute data combines 50 third-party studies and Baymard's own US survey. Exhibits 2, 3 and 6 and Table 2 are Henkan & Partners frameworks with illustrative data, not benchmarks.
- Google Analytics Help (n.d.). Monetization overview report.
- Google Analytics Help (n.d.). Ecommerce purchases report.
- Google Analytics Help (n.d.). Promotions report.
- Google Analytics Help (n.d.). Purchase journey report.
- Google Analytics Help (n.d.). Checkout journey report.
- Google Analytics Help (n.d.). Landing page report.
- Google Analytics Help (n.d.). All channels performance report.
- Google Analytics Help (n.d.). About ecommerce metrics.
- Google Analytics Help (n.d.). Set up ecommerce events.
- Google Analytics Help (n.d.). Ecommerce exploration solutions.
- Google Analytics Help (n.d.). Traffic acquisition report.
- Google for Developers (n.d.). Measure ecommerce.
- Google for Developers (n.d.). Google Analytics Data API schema.
- Google Analytics API notifications (2021). Schema updates in the Google Analytics Data API (cartToViewRate, itemListClickThroughRate).
- Google Analytics Help (n.d.). Introduction to audiences in Google Analytics.
- Google Analytics Help (n.d.). Create, edit and archive audiences.
- Google Analytics Help (n.d.). Predictive metrics.
- Google Analytics Help (n.d.). Predictive audiences.
- Google Analytics Help (n.d.). Custom dimensions and metrics limits.
- Google Analytics Help (n.d.). Connect Google Merchant Center to Google Analytics.
- Google Analytics Help (2026). What's new in Google Analytics (entries of 10 February, 28 July and 10 August 2026).
- Google Analytics (n.d.). Google Analytics MCP Server (Experimental). GitHub.
- Baymard Institute (2025). Cart abandonment rate statistics.
- Ahava, S. (2023). Google Analytics 4: Ecommerce guide for Google Tag Manager.