Focus
Debugging and QA for GA4: DebugView, Tag Assistant, Network Requests and Automated dataLayer Tests
Alexandre Suon · 2026-10-02
GA4 debugging is the developer's job of proving that every event leaves the page, reaches Google Analytics and lands in reports exactly as the tracking spec says. This guide shows you how to do it step by step with DebugView, Tag Assistant and the browser's Network tab, how to recognise the bugs that break most GA4 implementations, and how to turn manual checks into automated dataLayer tests and production alerts.
Executive summary
- Debug in layers, from the dataLayer to the report, and stop at the first layer that is wrong. An event crosses five layers (dataLayer, tag manager, network, GA4 collection, processed data), each with its own tool.
- DebugView is your same-day test bench, because reports lag by hours. DebugView shows events from a debug device in a 60-second stream and keeps the last 30 minutes. Standard reports need 2 to 6 hours for intraday data and Google warns that processing can take 24 to 48 hours.
- The /g/collect request is the ground truth. Reading its parameters (event name, currency, transaction ID, consent state, debug flag) tells you what GA4 actually received, before any setting or filter changes it.
- A handful of bugs cause most broken GA4 data. Missing or empty transaction IDs, missing currency, double page views in single-page apps, tags that fire before the consent default, stale items from an ecommerce object that was never cleared, and debug mode left on in production.
- Test both consent states, because a large share of real traffic arrives denied. Among visitors who answer the banner, Didomi measured average consent rates of 71% in France and 75.1% in Western Europe in 2025 (vendor data), a fifth to a quarter of users never answer, and events from visitors who have not consented do not appear in DebugView.
- Automate the contract, then monitor production. Validate dataLayer pushes against a JSON schema in unit tests, assert pushes and collect hits in Playwright or Cypress, run a 20-minute manual checklist per release, and alert on anomalies with GA4 custom insights and daily BigQuery checks.
Section 1 · Why it matters
GA4 bugs are silent and often permanent, so QA has to be a routine, not a rescue
GA4 debugging and QA is the practice of verifying, before and after each release, that every Google Analytics 4 event is pushed, fired, sent, received and reported with the names, parameters and values agreed in the tracking spec, using tools such as DebugView, Tag Assistant, the browser's Network tab, automated tests and production monitoring.
A broken analytics event rarely breaks the website. Nothing turns red, no customer complains, and the checkout keeps working. The first person to notice is usually an analyst, weeks later, staring at a revenue line that no longer matches finance. By then the damage is done, because much of GA4 cannot be repaired after the fact.
Google's documentation is clear about what you cannot undo. Data filters "do not affect historical data", excluded data "is never processed", and BigQuery data cannot be re-exported. An event that was never sent, or sent with the wrong currency, stays wrong in every report built on it. The only cheap moment to catch a tracking bug is before it ships.
This is the third article in The ABC of GA4 for Developers. The first, the GA4 event data model, limits and gotchas, explains what GA4 can store. The second, from tracking request to dataLayer spec, explains how to build the events. This one asks how you prove they work, today and after every release. For the generic mechanics of how GA4 turns hits into numbers, see how GA4 actually works.
For developers. Treat tracking like any other interface your code exposes: it has a contract (the event spec), tests that enforce it, and monitoring that tells you when it breaks.
For leaders. Every tracking bug that reaches production costs analyst time and, worse, a decision made on wrong data. A release checklist and a few automated tests cost far less than one bad quarter of attribution.
Section 2 · The method
Debug layer by layer, from the dataLayer to the report, and stop at the first layer that is wrong
Most debugging time is wasted by starting in the wrong place, usually a report. The faster method is to walk the event's path in order and stop at the first layer where reality differs from the spec. Everything downstream of that layer is a symptom, not a cause.
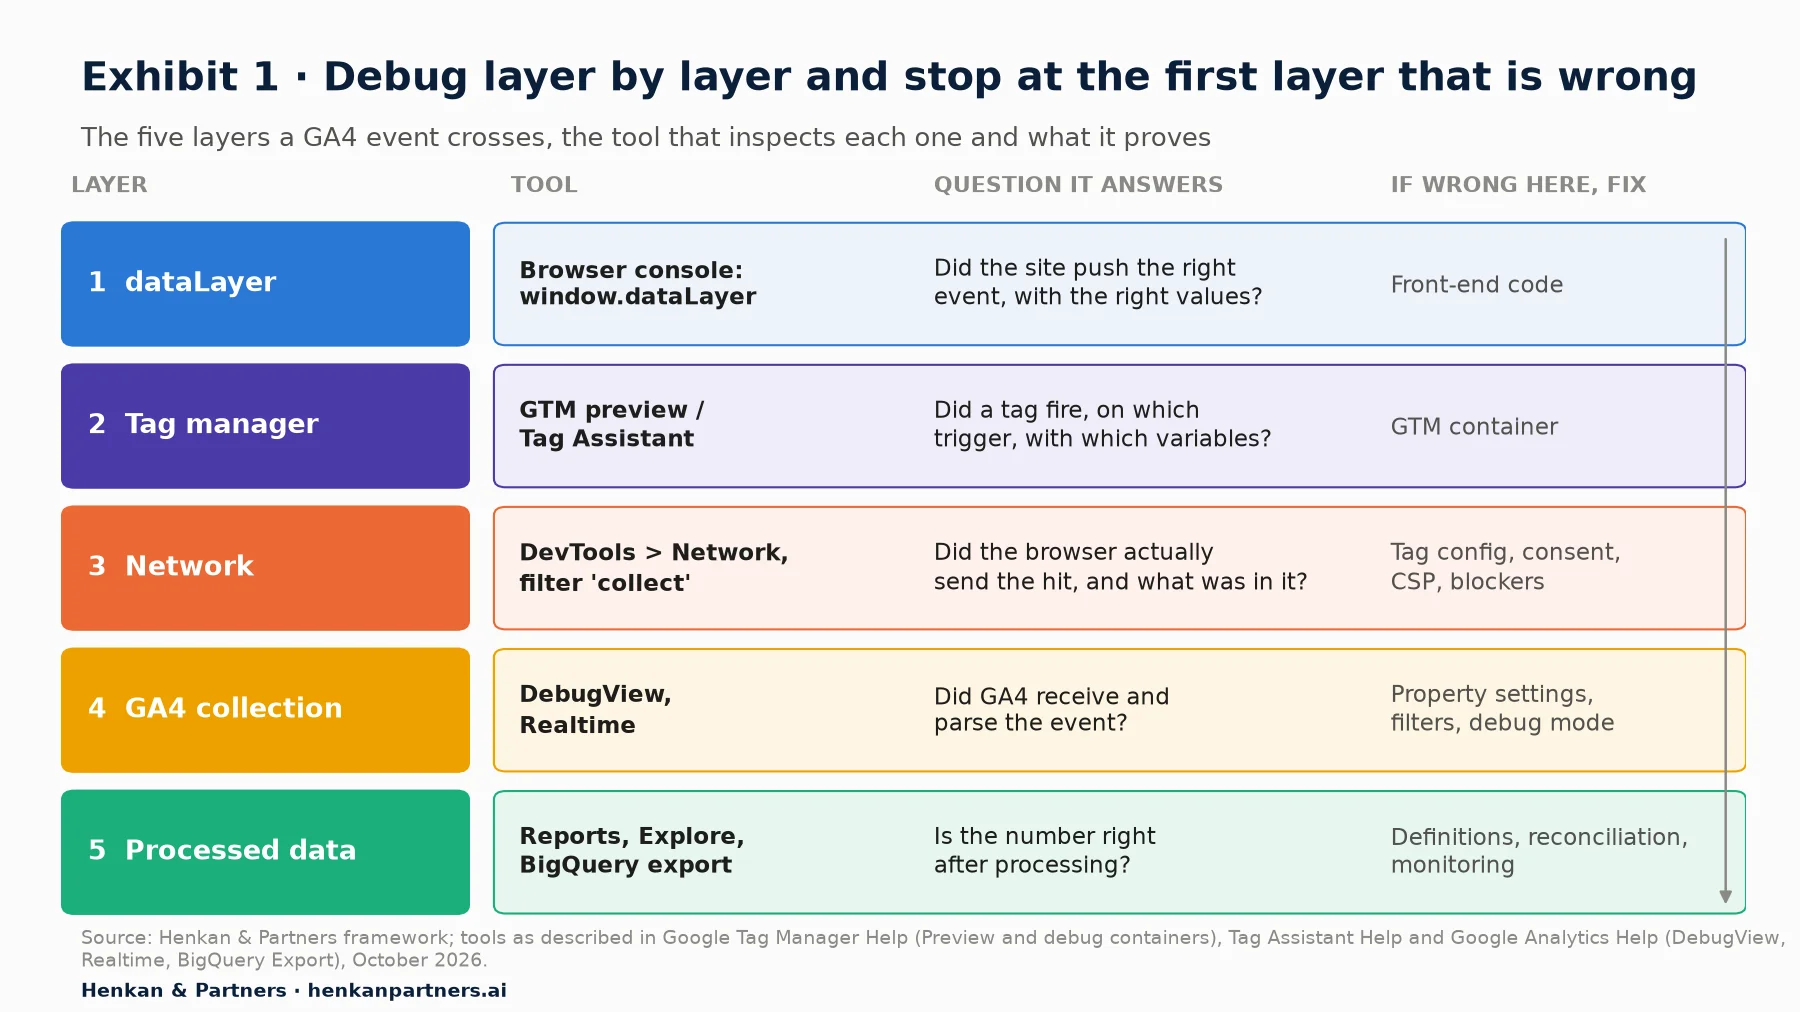
What this shows. Each layer answers one question and points to one owner. If the dataLayer push is wrong, no amount of GTM work will fix it; if the push is right but no request leaves the browser, the problem is in the tag, the consent set-up or a blocker. Working top to bottom means each finding narrows the search instead of widening it.
In practice the layers map to five quick checks you can run in this order on any page:
- dataLayer. In the browser console, type `dataLayer` and inspect the last pushes. Check the event name, the `ecommerce` object and the types (a price sent as the string "64,95" is a bug).
- Tag manager. In GTM preview or Tag Assistant, select the event in the left-hand summary and check which tags fired, which did not, and what values the variables resolved to.
- Network. In DevTools, filter the Network tab on `collect` and open the request. Confirm the event name and parameters are in the payload.
- GA4 collection. In DebugView, select your device and confirm the event arrives with its parameters.
- Processed data. The next day, compare the report or the BigQuery export with your source of truth, usually the order database.
Section 3 · The tools
Tag Assistant shows what fired, DebugView shows what GA4 received, and you need both
Step 1: Connect Tag Assistant or GTM preview
If you deploy GA4 through Google Tag Manager, start in the container workspace: click Preview, enter the site URL and click Connect. Google describes preview as a way to "browse a site on which your container code is implemented as if the current container draft was deployed". The debug interface then lists each dataLayer message with the tags that fired and the values of every variable, and you can share a preview link with a tester.
If you use gtag.js directly, go to tagassistant.google.com, click Add domain, enter the URL and click Connect. The Tag Assistant Chrome extension is optional but recommended: Google notes that it enables detection of the Google tag inside iframes and opens the debug window in a new tab instead of a pop-up. Tag Assistant does not support AMP, and ad blockers, content security policies and consent tools can interfere with the connection.
Step 2: Watch the events arrive in DebugView
DebugView lives in GA4 under Admin > Data display > DebugView. It only shows devices in debug mode, and there are three ways to get there, all documented by Google:
- Tag Assistant or GTM preview. Connecting adds a parameter to the page address that turns on debug mode for your session. This is the easiest option during development.
- gtag.js. Add `debug_mode: true` to the config command, for example `gtag('config', 'G-XXXXXXXXXX', { debug_mode: true })`.
- Google Tag Manager. Set the `debug_mode` parameter to `true` in the Google tag configuration.
Once events flow, the middle column (the seconds stream) shows events logged in the last 60 seconds, the left column (the minutes stream) shows one circle per minute for the last 30 minutes, and the right column shows the top events of that period and the current user properties. Use the Debug device selector to focus on your device, then click each event and check its parameters against the spec.
Gotcha. Google states that "setting the parameter to `false` doesn't disable debug mode". To turn it off you must remove `debug_mode` entirely. A tag that ships to production with `debug_mode: false`, or with a variable that resolves to false, still sends debug hits. Google also recommends filtering out debug traffic so it does not affect reports, which is what the Developer traffic data filter does.
Why DebugView sometimes shows nothing
An empty DebugView is the most common complaint in GA4 debugging, and the causes are usually outside GA4. Google lists two: client-side privacy controls, and consent mode when the user has not consented. Practitioner guides such as Analytics Mania's add ad blockers and privacy browsers, a content security policy blocking google-analytics.com, a wrong Measurement ID and an active internal traffic filter matching your IP. Check them in that order.
Step 3: Know when each surface can show your event
DebugView and the Realtime report (Reports > Realtime, last 30 minutes) are the only places to validate on the same day. Everything else waits for processing. Google's data freshness page gives typical times for standard properties: intraday data in 2 to 6 hours, daily data in about 12 hours, and a general warning that "data processing can take 24-48 hours", during which reports may change. The BigQuery daily export typically lands mid-afternoon in the property's time zone, and can slip to the next day.
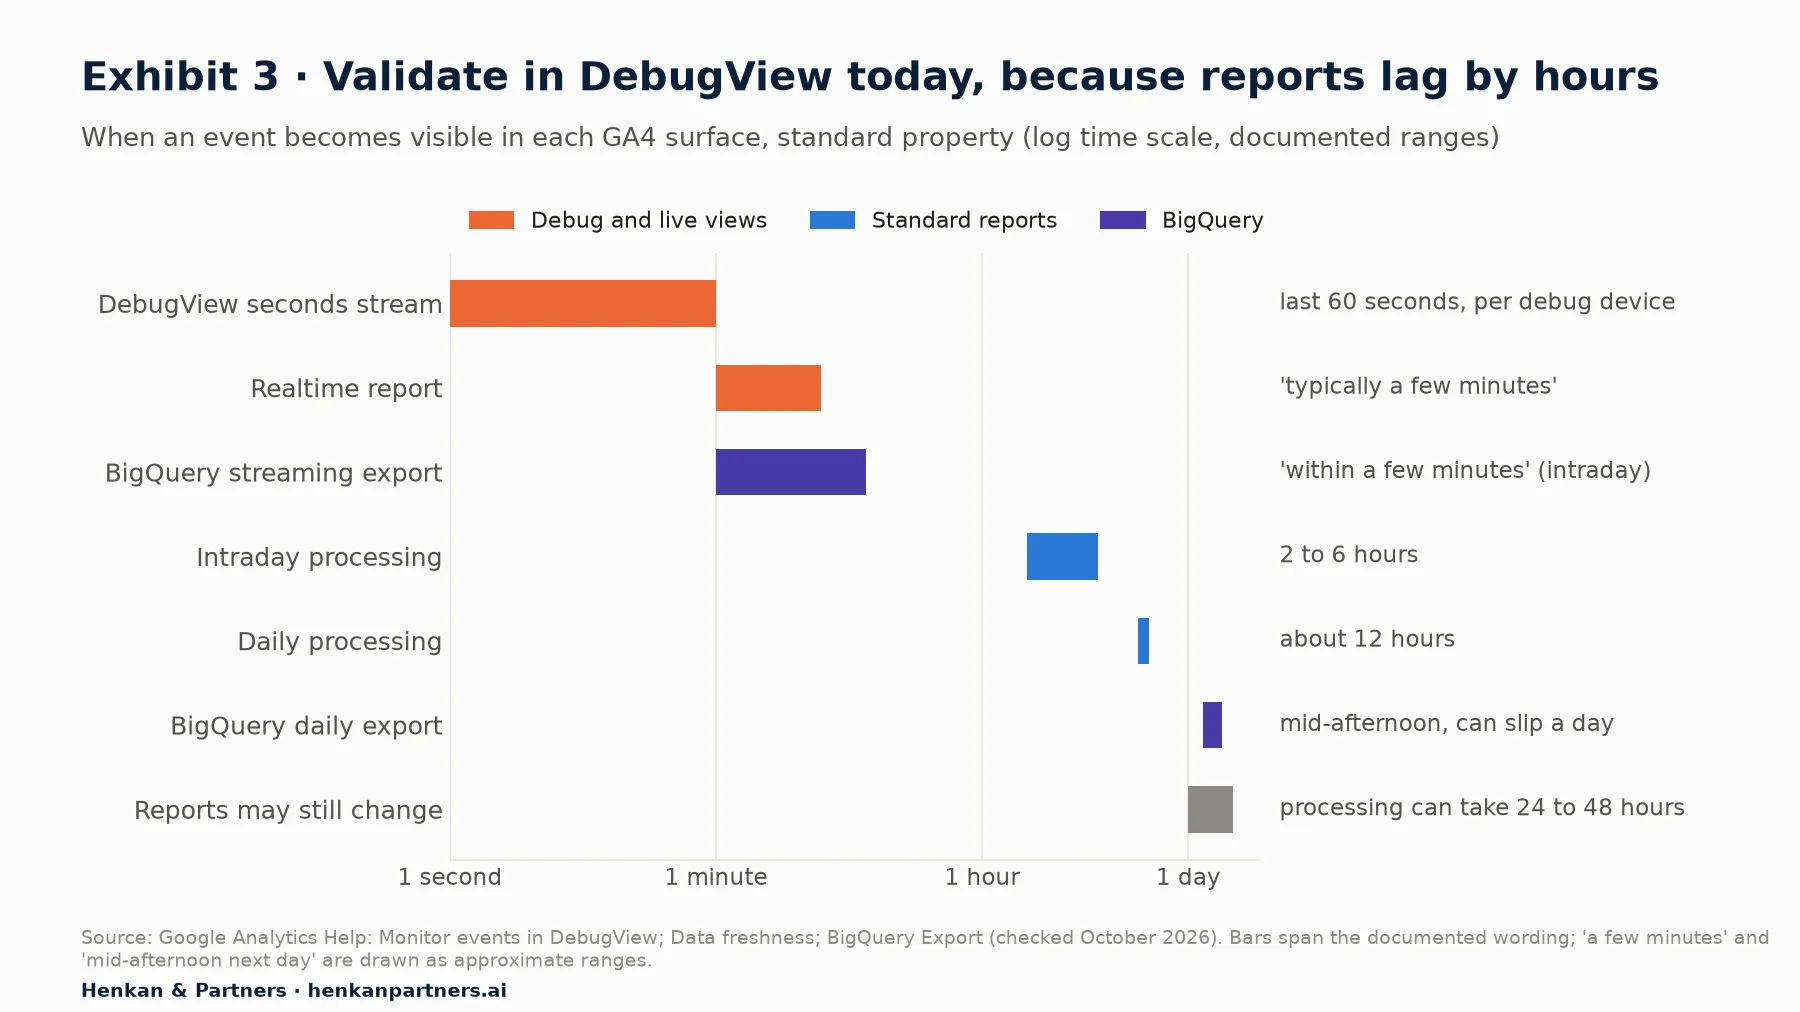
What this shows. From seconds to two days, about five orders of magnitude separate the fastest and the slowest view of the same event. Validating a release in standard reports means waiting a day and risking a second release on top of an unverified one. DebugView, Realtime and the Network tab are where QA happens; reports and BigQuery are where you confirm the numbers the next day.
Section 4 · The network request
The /g/collect request is the ground truth, so learn to read it
DebugView tells you what GA4 parsed. The network request tells you what the browser sent, which is one layer earlier and immune to property settings. On a website, the Google tag sends events to an endpoint ending in `/g/collect`, usually on google-analytics.com, or on your own domain if you use server-side Google Tag Manager.
To read it: open DevTools, go to the Network tab, tick Preserve log (so the request survives a redirect to the confirmation page), type `collect` in the filter box, then trigger the event. The URL carries the parameters shared by the request; when events are batched, each event's own parameters sit on separate lines of the request body. Google does not publish the full parameter list, but practitioner documentation such as David Vallejo's Measurement Protocol v2 reference agrees on the main ones.
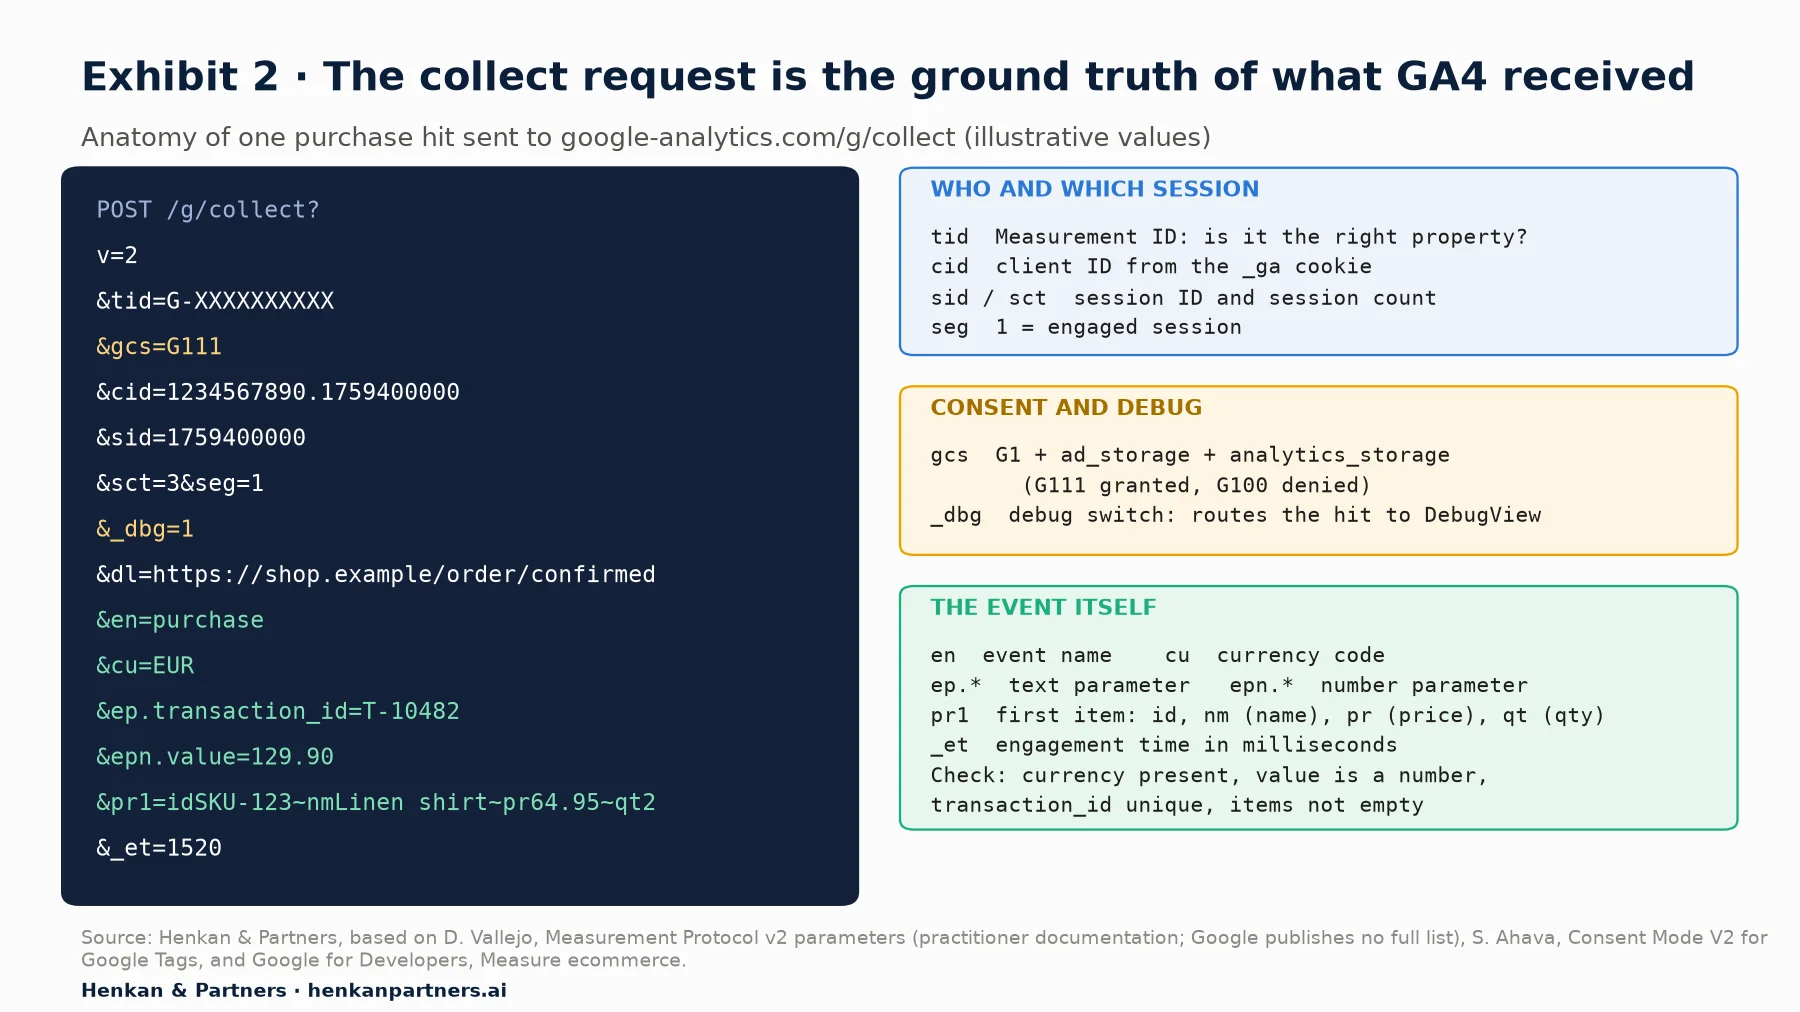
What this shows. A purchase hit is short enough to check by eye. Five fields catch most e-commerce bugs: `tid` (the right property), `en` (the right event name), `cu` (currency present), `ep.transaction_id` (present and unique) and `pr1` onwards (one entry per item, with price and quantity). The `gcs` and `_dbg` fields explain most cases of events that were sent but never appeared in DebugView or reports.
| Parameter | Meaning | What to check |
|---|---|---|
| tid | Measurement ID of the data stream | Matches the property you are looking at; no staging ID in production |
| en | Event name | Exact spelling and case from the spec (GA4 event names are case sensitive) |
| **ep. / epn.** | Text / number event parameters | Numbers go out as `epn.`; a value sent as `ep.value` arrived as text |
| cu | Currency code | Present whenever a value is sent; ISO 4217 code such as EUR |
| pr1, pr2… | Items, with sub-keys such as id, nm, pr, qt | One per item; price and quantity present |
| cid / sid | Client ID and session ID | Stable across pages of one visit; a new cid on every page inflates users |
| gcs | Consent state for ad_storage and analytics_storage | G111 when both are granted, G100 when both are denied |
| _dbg | Debug switch | Present in your test session, absent in production |
Server-side events sent with the Measurement Protocol have no browser to inspect: send the payload to the validation endpoint, `/debug/mp/collect`, which returns `validationMessages` (it does not check your `api_secret`). See GA4 BigQuery export and Measurement Protocol for developers.
Section 5 · Common bugs
Six bugs break most GA4 implementations, and each leaves a recognisable signature
Across the audits we run, the same few defects explain most broken GA4 data (in our experience). None of them is exotic. Each has a clear signature in one of the layers, and a fix that belongs to one owner.
Duplicate or missing purchases
Signature: GA4 purchases exceed or swing away from back-end orders. Cause: the transaction ID is missing, empty or not unique. Google deduplicates purchase events that share a transaction ID, but only for web streams, and warns against sending an empty string as the transaction ID, because GA4 will then "deduplicate all purchase events" that carry it. A hard-coded or empty ID therefore undercounts, while a missing ID lets every confirmation-page reload count again. Check: in the network request, `ep.transaction_id` is present and matches the real order number. Fix: push the purchase once, server-rendered from the order record, and send the real order ID.
Missing or malformed currency and value
Signature: revenue is zero or absurd in monetisation reports while purchase counts look normal. Cause: Google's ecommerce guide says to "set currency at the event level when sending value (revenue) data"; when it is missing, or the value arrives as a formatted string, revenue cannot be computed correctly. Check: `cu` is present and `value` goes out as a number (`epn.value`). Fix: send numbers, not locale-formatted strings, and set currency on every event that carries a value.
Double page views in single-page apps
Signature: DebugView shows two `page_view` events per route change. Cause: enhanced measurement can send page views on browser history changes (it listens for `pushState`, `popState` and `replaceState`), and the site or GTM also sends a manual page view on the same change. Google's single-page app guide warns: "If you configure your tags using Google Tag Manager, don't enable automatic history tracking in Google Analytics, as this can lead to double-counting page views." Check: in DebugView, click to a new virtual screen and confirm exactly one `page_view`, with updated page location and referrer. Fix: choose one mechanism and switch the other off.
Tags that fire before the consent default
Signature: hits go out before the banner loads, or `gcs` contradicts the user's choice. Cause: Google warns that "if your consent code is called out of order, consent defaults won't work." GTM's Consent Initialization trigger exists so consent settings are honoured before any other trigger fires. Check: in Tag Assistant, open the earliest Consent event and check that all four parameters (`ad_storage`, `analytics_storage`, `ad_user_data`, `ad_personalization`) have a default before any GA4 tag fires. Fix: set the default first, use `wait_for_update` (a value in milliseconds) if your banner loads asynchronously, then call the update command.
Stale items from an ecommerce object that was never cleared
Signature: a `view_item` event carries the items of the previous list, or an `add_to_cart` reports two products when one was added. Cause: the dataLayer merges objects, so leftover `ecommerce` keys survive into the next push. Every GTM example in Google's ecommerce guide starts with `dataLayer.push({ ecommerce: null })` to "clear the previous ecommerce object". Check: in the console, inspect the pushes in sequence. Fix: clear before every ecommerce push. Design details are in the dataLayer spec article.
Debug mode, staging IDs and test traffic left in production
Signature: strangers' devices appear in DebugView, or production reports contain test orders. Cause: `debug_mode` hard-coded in a tag (remember, false does not turn it off), a staging Measurement ID in the production build, or QA purchases sent to the live property. Check: in production, the request has no `_dbg` and the right `tid`. Fix: inject debug mode only through Tag Assistant during tests, keep Measurement IDs in environment configuration, and activate the developer traffic filter.
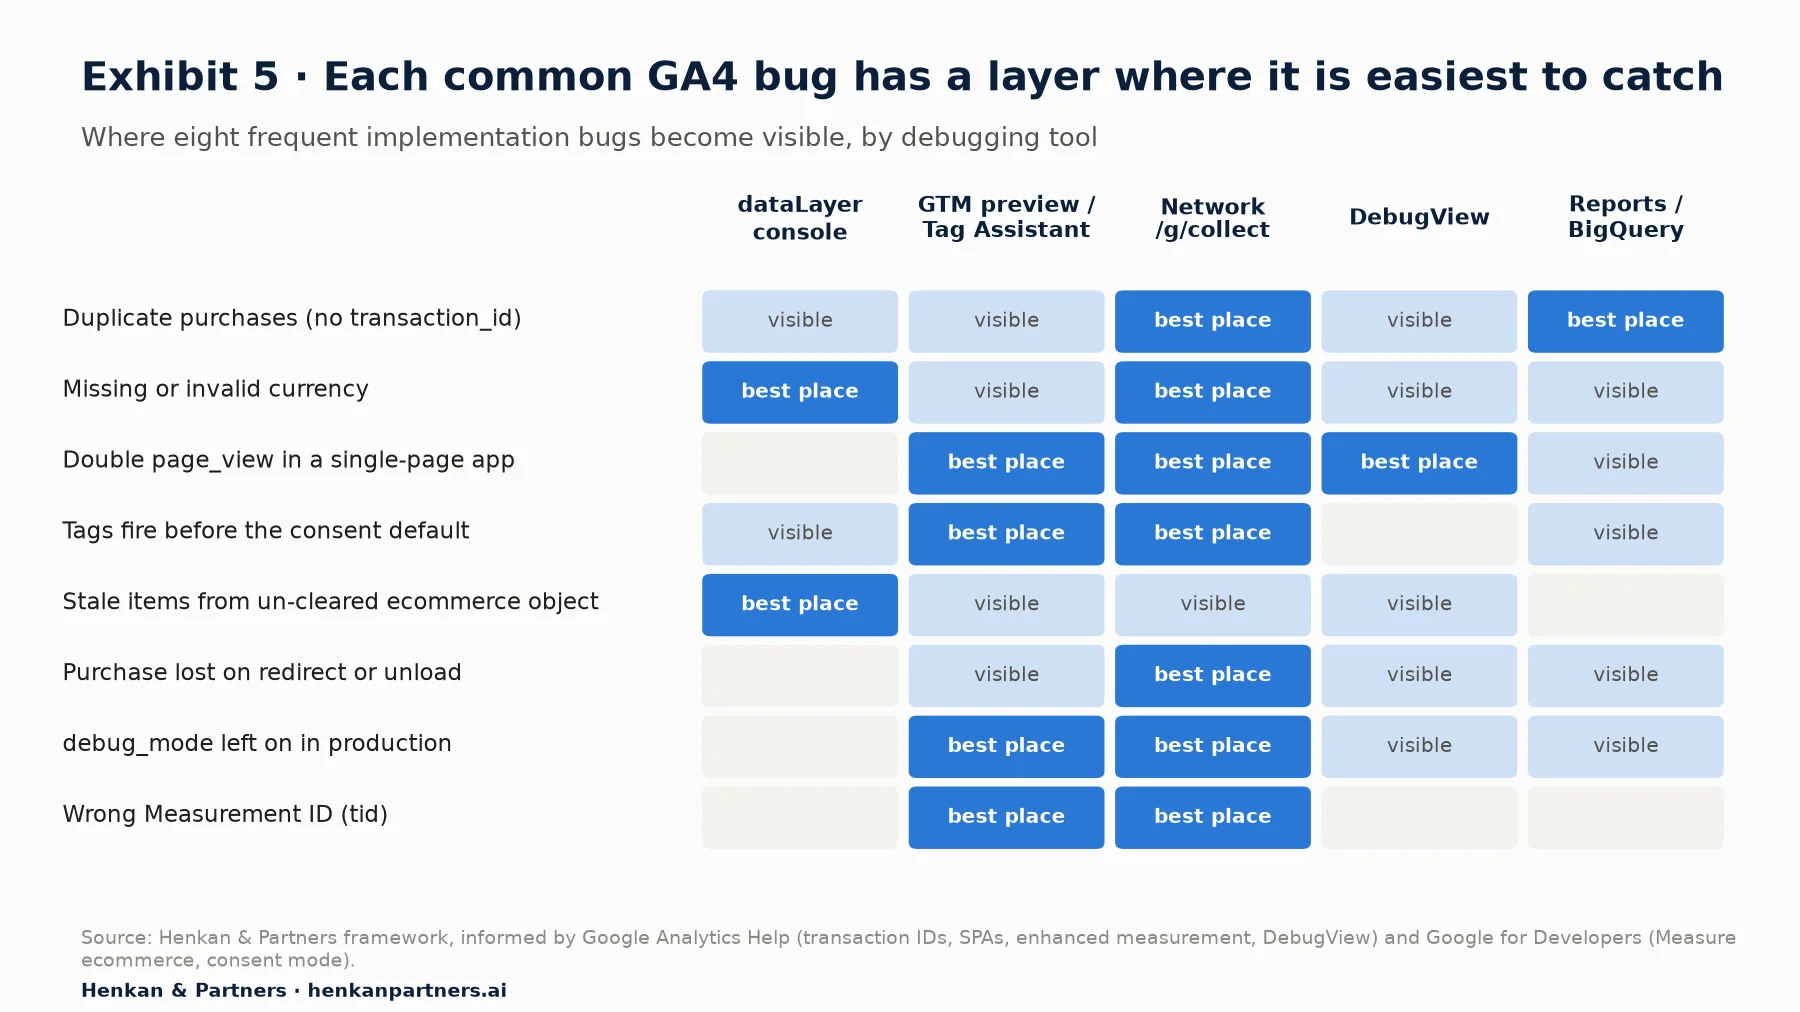
What this shows. The Network column is the densest: almost every bug is visible in the request, which is why it belongs in every QA pass. DebugView is blind to two important cases, consent-denied traffic and the wrong Measurement ID, because in both the event never reaches the property you are watching. Reports and BigQuery catch duplicates best, but only after a day.
Section 6 · Consent
Test both consent states, because a large share of real traffic arrives denied
Most developers test with consent granted. Real users behave differently. Didomi's 2026 benchmark, based on consent interactions collected in 2025, puts the average consent rate (opt-ins as a share of visitors who accept or refuse) at 75.1% in Western Europe and 71% in France (vendor data). It also found that, depending on the region, between 21.7% and 27.4% of users leave the banner unanswered, so for them the default state is the only state your tags ever see.
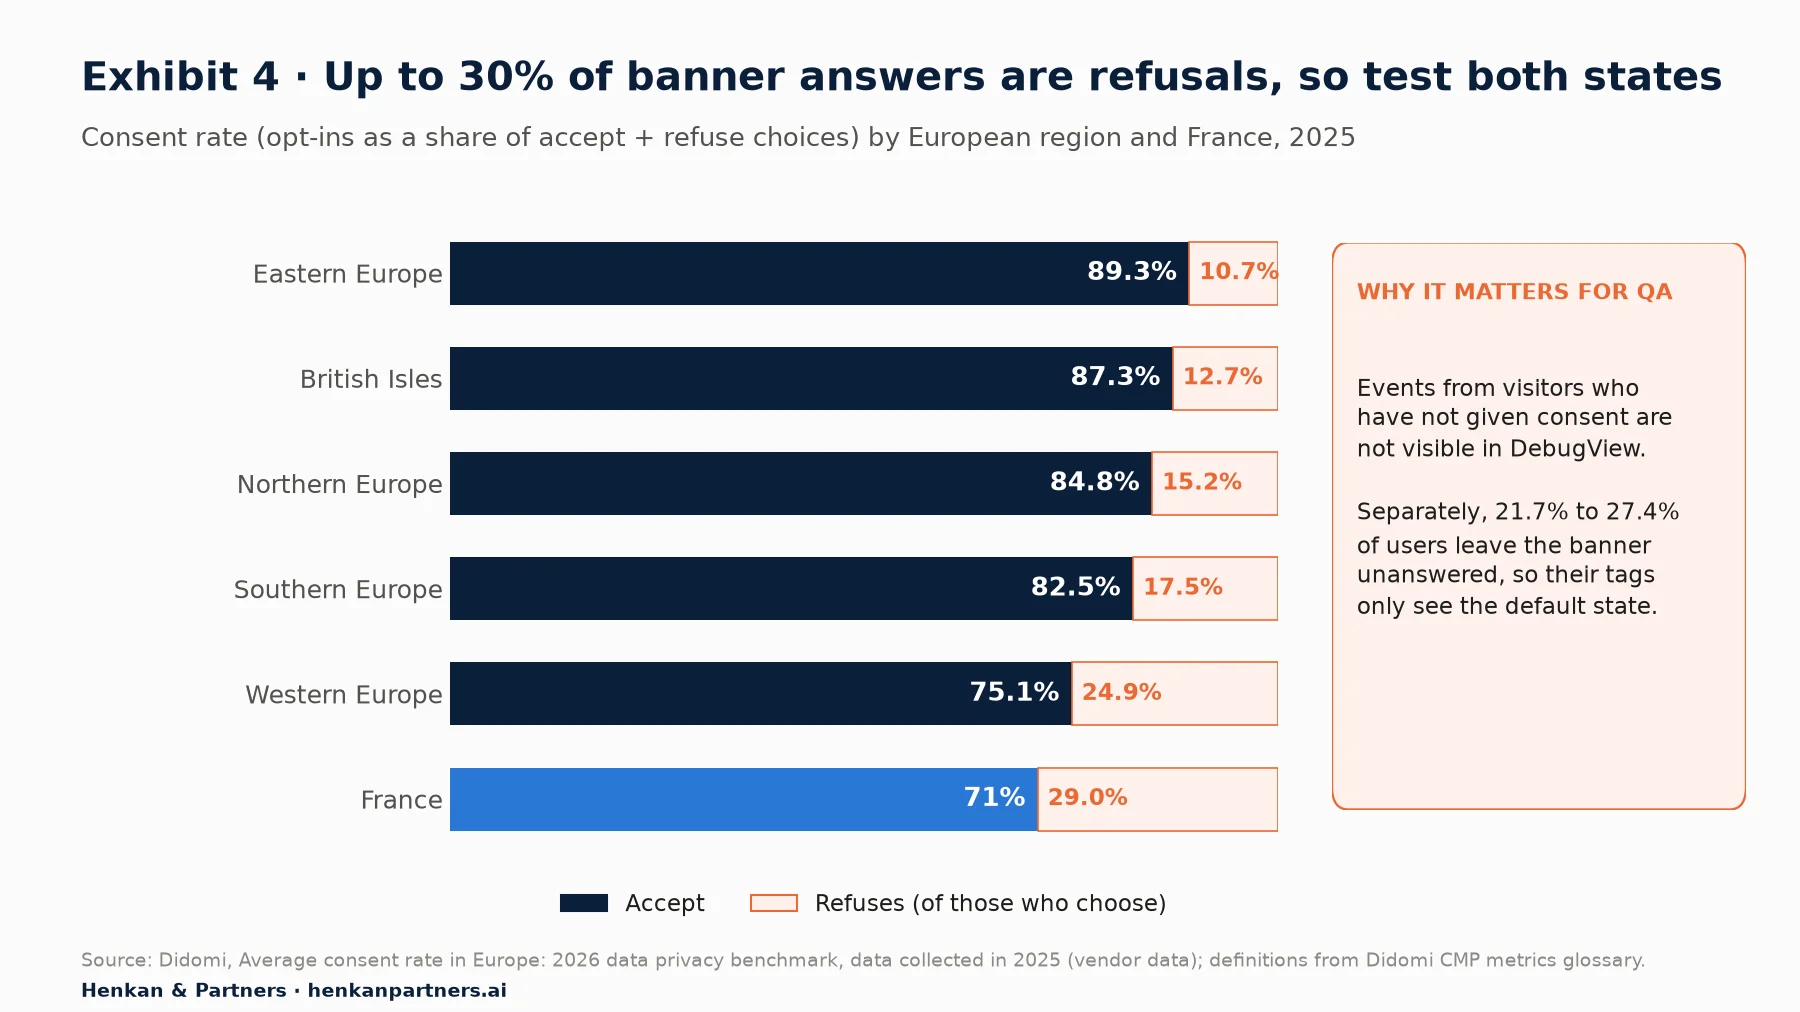
What this shows. Among European visitors who answer the banner, between one in ten and three in ten refuse, depending on the market, and a further fifth to a quarter never answer. Their sessions behave differently in GA4: no identifiers are stored and, with consent mode, their events are not shown in DebugView. If QA only covers the granted path, the denied path, which can be a quarter of your traffic, ships untested.
A consent QA pass takes five minutes:
- Fresh session, banner untouched. Open a private window with Tag Assistant connected. Before clicking anything, open the first Consent event and check the On-page Default column: every consent type should have its intended default.
- Deny. Refuse in the banner. Check the On-page Update column and, in the Network tab, that hits carry `gcs=G100` (or whatever matches your policy) and that no tag you classify as non-essential fires.
- Accept. Repeat in a new session and accept. Check `gcs=G111` and that the update happened before the first GA4 event you care about, usually `page_view`.
- Change your mind. Reopen the banner, withdraw consent, and check that the update is sent.
For the legal side and what changes before 2027, see user consent in e-commerce. For how consent mode affects reported numbers and behavioural modelling, see the GA4 audit checklist.
Section 7 · Release QA
A 20-minute release checklist catches most regressions before customers do
Automated tests catch regressions in the flows you thought to test. A short manual pass catches the rest, such as a new payment provider that redirects through another domain. Run this checklist on staging before every release that touches templates, checkout, consent or the tag container (Henkan & Partners framework).
| # | Check | Where | Pass when |
|---|---|---|---|
| 1 | Correct container and Measurement ID load | Tag Assistant, Network | One Google tag per ID; staging uses the staging property |
| 2 | Consent default set before any GA4 tag | Tag Assistant > Consent | All four types have a default in the first Consent event |
| 3 | One page_view per page or virtual route | DebugView | Exactly one, with updated page location |
| 4 | Listing and product events | dataLayer, DebugView | view_item_list, select_item, view_item carry items with item_id or item_name |
| 5 | Cart events | dataLayer, Network | add_to_cart and remove_from_cart carry the right item, quantity, value and currency |
| 6 | Checkout steps | DebugView | begin_checkout, add_shipping_info, add_payment_info fire once each |
| 7 | Purchase | Network (Preserve log) | One hit, real transaction ID, numeric value, currency, all items |
| 8 | Confirmation reload | Network | No second purchase push, or same transaction ID |
| 9 | Consent denied path | Network | gcs reflects refusal; non-essential tags silent |
| 10 | No personal data | Network | No email, phone or name in URLs or parameters |
| 11 | No debug flag in the production build | Network | No _dbg, no debug_mode in the published container |
| 12 | GTM version documented | GTM > Versions | Version name and notes describe the change |
Our view. The checklist is only as good as the evidence it leaves. Ask the tester to save a HAR file of the checkout run or a screenshot of each DebugView event, and attach it to the release ticket. When numbers look wrong next month, that evidence settles in minutes what would otherwise take a day of archaeology. The same discipline applies to A/B tests, see the A/B test QA checklist.
Section 8 · Automated tests
Automated tests should assert the dataLayer contract and the outgoing hit, not the GA4 interface
Manual QA does not scale with release frequency. Test the two things your code controls, what it pushes to the dataLayer and what the browser sends, and never assert on GA4 reports in CI: they are hours behind.
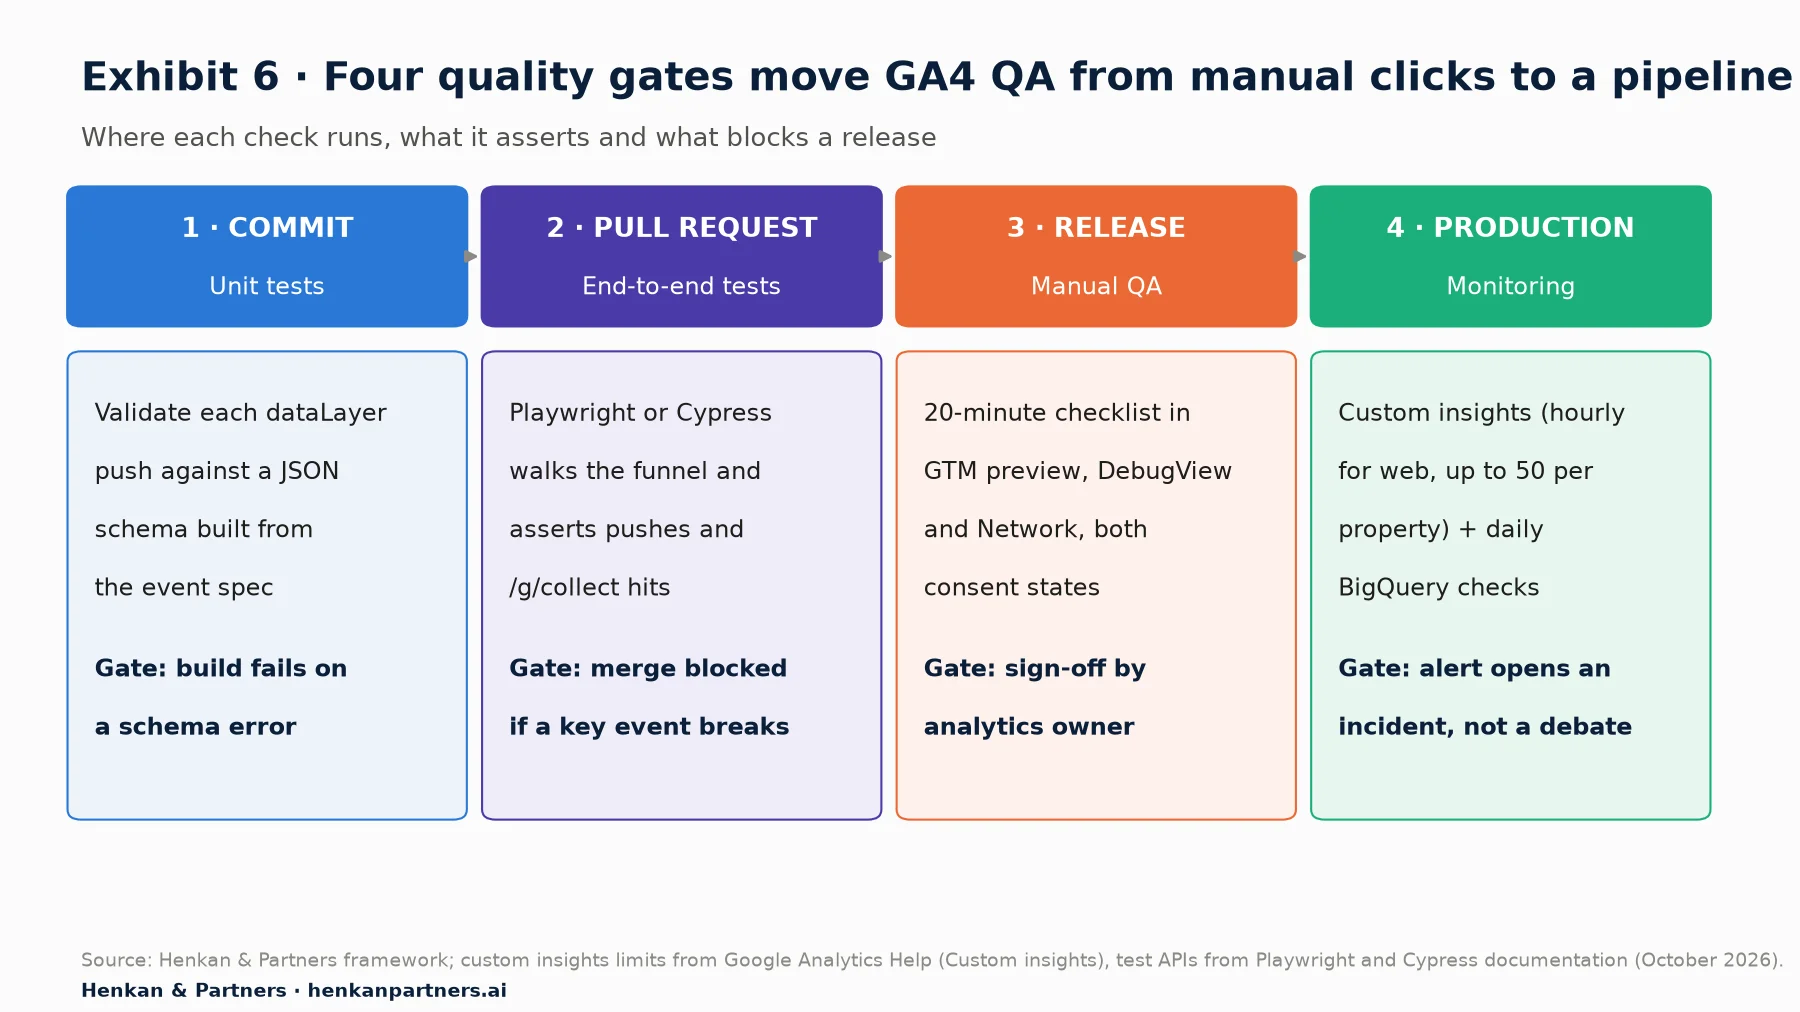
What this shows. Each gate catches a different class of bug at a different cost. Schema tests are instant and catch type and naming errors. End-to-end tests catch broken triggers and missing hits. Manual QA catches what nobody thought to automate. Monitoring catches what slipped through, before an analyst does.
Gate 1: validate pushes against a JSON schema
Turn each event in the spec into a JSON Schema and validate every push in unit tests with a validator such as Ajv, which supports drafts up to 2020-12. Google's ecommerce reference gives you the rules to encode: `transaction_id` is required for purchases, currency must accompany value, and each item needs an `item_id` or an `item_name`.
// purchase.schema.json (excerpt), derived from the event spec
{
"type": "object",
"required": ["event", "ecommerce"],
"properties": {
"event": { "const": "purchase" },
"ecommerce": {
"type": "object",
"required": ["transaction_id", "value", "currency", "items"],
"properties": {
"transaction_id": { "type": "string", "minLength": 1 },
"value": { "type": "number" },
"currency": { "type": "string", "pattern": "^[A-Z]{3}
Gate 2: assert pushes and hits in Playwright or Cypress
End-to-end tests walk the funnel on a test build and check both layers. In Playwright, `page.evaluate` reads `window.dataLayer`, `page.on('request')` captures outgoing hits, and `page.route` lets you answer the hit locally so test traffic never reaches a real property. Because the Google tag may batch several events in one request, parse both the query string and the body lines.
import { test, expect } from '@playwright/test';

// One request can carry several events: shared params in the URL, one body line per event
function ga4Events(req) {
  const url = new URL(req.url());
  const lines = (req.postData() || '').split('\n').filter(Boolean);
  const shared = Object.fromEntries(url.searchParams);
  return lines.length
    ? lines.map(l => ({ ...shared, ...Object.fromEntries(new URLSearchParams(l)) }))
    : [shared];
}

test('purchase: one valid push and one GA4 hit', async ({ page }) => {
  const hits = [];
  await page.route('**/g/collect**', route => route.fulfill({ status: 204 })); // keep test hits out of GA4
  page.on('request', req => { if (req.url().includes('/g/collect')) hits.push(...ga4Events(req)); });

  await page.goto('/checkout?test-order=1');
  await page.getByRole('button', { name: 'Place order' }).click();
  await page.waitForURL('**/order/confirmed**');

  const pushes = await page.evaluate(() => window.dataLayer.filter(e => e.event === 'purchase'));
  expect(pushes).toHaveLength(1);
  expect(pushes[0].ecommerce.currency).toMatch(/^[A-Z]{3}$/);
  expect(typeof pushes[0].ecommerce.value).toBe('number');

  await expect.poll(() => hits.filter(h => h.en === 'purchase').length).toBe(1);
  const hit = hits.find(h => h.en === 'purchase');
  expect(hit['ep.transaction_id']).toBeTruthy();
  expect(hit.cu).toBe(pushes[0].ecommerce.currency);
});
The Cypress equivalent uses `cy.intercept` with an alias and `cy.wait`, which yields the request so you can inspect its body, and `cy.window()` to read the dataLayer:
cy.intercept('POST', '**/g/collect*', { statusCode: 204 }).as('ga4');
cy.visit('/product/sku-123');
cy.get('[data-test=add-to-cart]').click();
cy.window().its('dataLayer').should(dl => {
  const evt = dl.filter(e => e.event === 'add_to_cart').pop();
  expect(evt.ecommerce.items).to.have.length(1);
  expect(evt.ecommerce.currency).to.match(/^[A-Z]{3}$/);
});
cy.wait('@ga4');
Two practical notes. Set the consent state explicitly at the start of each test (for example by seeding the consent cookie with `page.addInitScript`) and run key flows in both states. And Playwright warns that a service worker can hide requests from routing, so block service workers in the test context if hits seem to vanish.
Section 9 · Production monitoring
Production monitoring closes the loop, with alerts in GA4 and checks in BigQuery
Tests prove the code works in a controlled run. Production adds what you could not simulate: new browsers, a payment provider's change, a tag pasted into the container on a Friday. Monitoring asks one question every day: did yesterday's data behave like the days before?
Alerts with GA4 custom insights
GA4 can watch metrics for you. From the Insights card, choose View all insights, then Create. Google lets you evaluate conditions hourly (web data only), daily, weekly or monthly, either as a threshold (for example, purchases down more than 20%) or as an anomaly that GA4 detects itself, and email the result to named people. A property can hold up to 50 custom insights. Start with three: an anomaly on purchases, an anomaly on `page_view` count, and an hourly drop on your main lead or sign-up event.
Daily checks in BigQuery
If the property is linked to BigQuery (data only starts flowing once the link is in place, and exported data cannot be re-exported, so link it early), a few scheduled queries catch what aggregate alerts miss. Two examples, using fields from Google's export schema; the export and its costs are covered in GA4 BigQuery export for developers:
-- Yesterday's purchases with a missing or repeated transaction ID
SELECT ecommerce.transaction_id AS transaction_id, COUNT(*) AS purchase_events
FROM `my-project.analytics_123456789.events_*`
WHERE _TABLE_SUFFIX = FORMAT_DATE('%Y%m%d', DATE_SUB(CURRENT_DATE(), INTERVAL 1 DAY))
  AND event_name = 'purchase'
GROUP BY transaction_id
HAVING transaction_id IS NULL OR transaction_id IN ('', '(not set)') OR COUNT(*) > 1;

-- Yesterday's purchases without a currency parameter
SELECT COUNTIF((SELECT value.string_value FROM UNNEST(event_params) WHERE key = 'currency') IS NULL) AS no_currency,
       COUNT(*) AS purchases
FROM `my-project.analytics_123456789.events_*`
WHERE _TABLE_SUFFIX = FORMAT_DATE('%Y%m%d', DATE_SUB(CURRENT_DATE(), INTERVAL 1 DAY))
  AND event_name = 'purchase';
Add a third check on the `privacy_info.analytics_storage` field, which records Yes, No or Unset, to spot sudden shifts in the share of consented events after a banner change. Remember that standard properties have a daily export limit of 1 million events.
The one metric worth a dashboard: GA4 purchases over back-end orders
The most useful single monitor compares GA4 purchases with orders in your own database, day by day. The ratio is never 100%, because of consent, blockers and lost hits, but it is stable for a given site. A sudden move is a bug until proven otherwise.
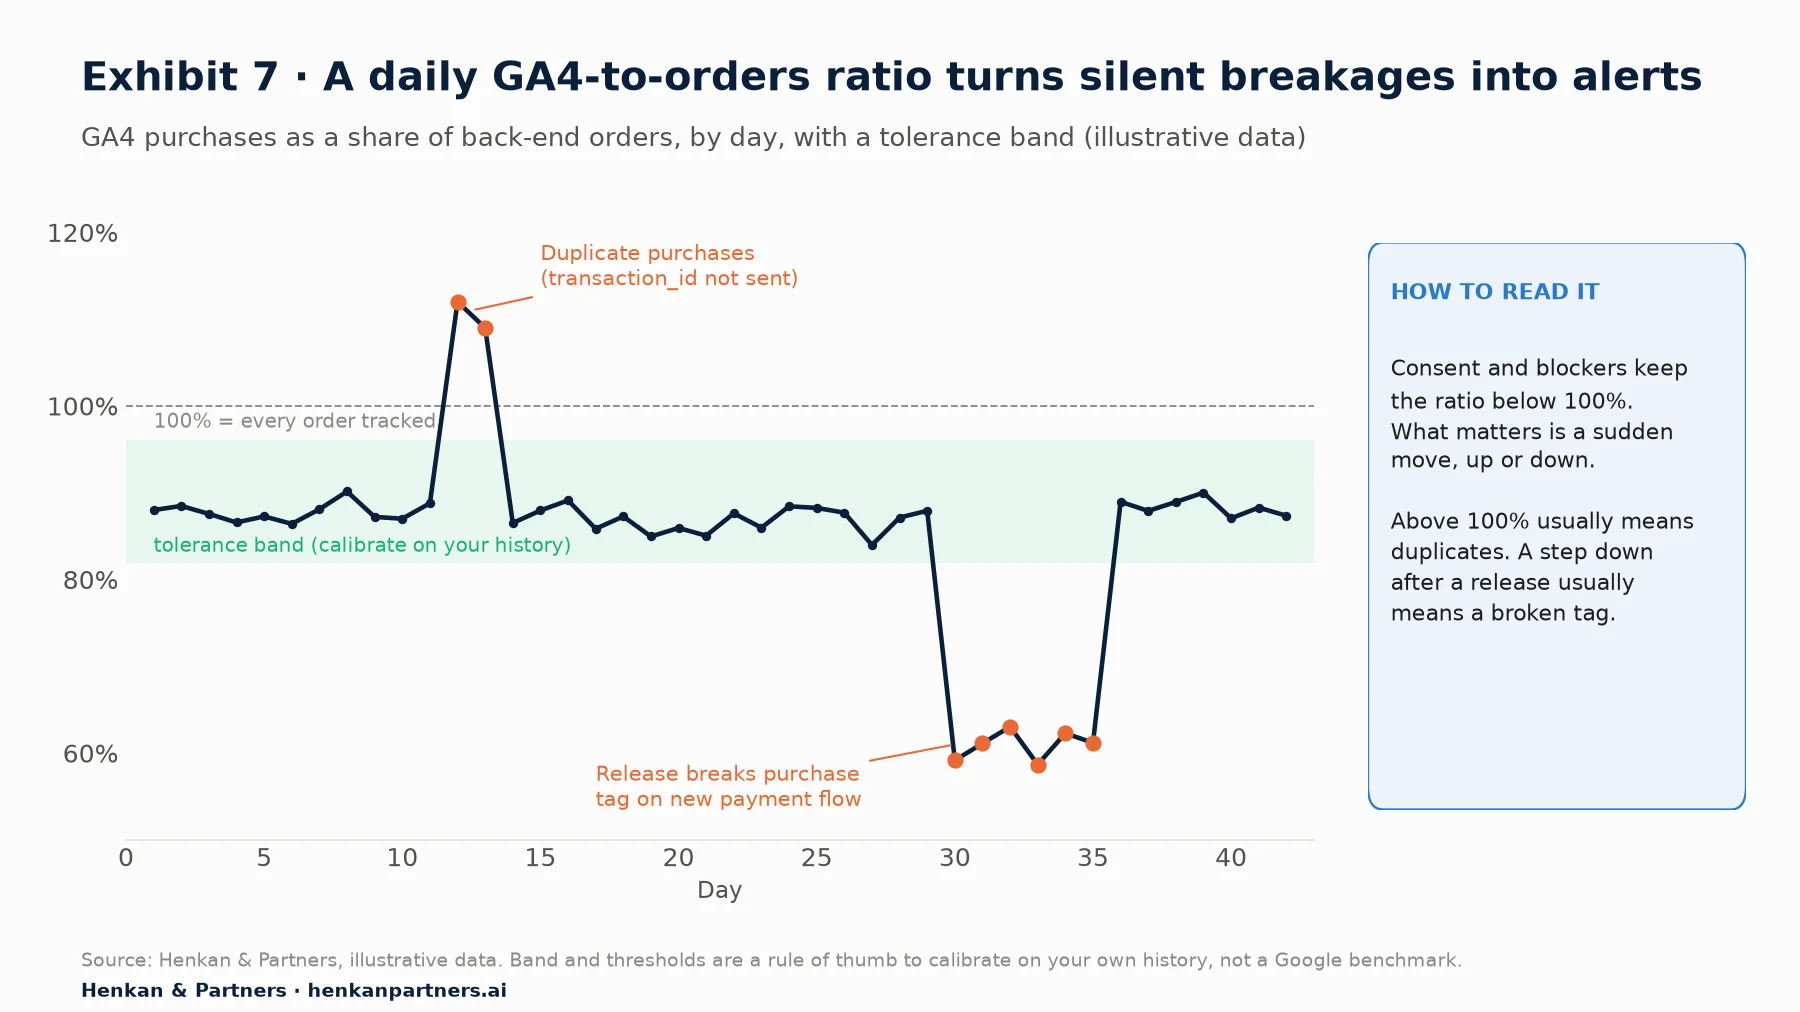
What this shows. The level of the line matters less than its steadiness. A jump above 100% almost always means duplicates; a step down right after a release almost always means a broken tag or trigger. In this example, a daily alert on the ratio would have turned six days of lost purchase data into one.
Where AI helps, and where it does not
AI assistants help when they work from your spec: they draft JSON schemas and Playwright tests from an event table, decode a pasted collect request and write BigQuery checks. Google's experimental, read-only Google Analytics MCP server exposes tools such as `run_realtime_report`, so an agent can confirm after a release that purchases are arriving. The risks are concrete: invented parameter names or limits, tests that confidently assert the wrong thing, and personal data leaked in pasted payloads. Review generated assertions against the spec, and never give an agent write access to the container.
Section 10 · What to do next
What to do next
1. Run the five-layer check on your purchase flow this week
Walk one real purchase on staging through the dataLayer, Tag Assistant, the Network tab and DebugView. Most teams find at least one of the six bugs in Section 5 on the first pass.
2. Adopt the release checklist
Put Table 2 into your release template, with HAR files or screenshots as evidence. Make the analytics owner's sign-off a required step for any release that touches checkout, consent or the container.
3. Automate one test per key event
Write the schema and the Playwright or Cypress test for purchase first, then sign-up or lead. Run them on every pull request, in both consent states.
4. Switch on monitoring
Create the three custom insights, link BigQuery if you have not, schedule the two checks, and plot the GA4-to-orders ratio. Agree who receives the alerts and what counts as an incident.
5. Make QA part of the shared tracking plan
QA works best when every request arrives with acceptance criteria. The GA4 tracking plan shows how product, design, engineering and marketing request, build and check tracking together, and you can download the GA4 Tracking Request Kit, which includes the QA checklist, the event spec template and the naming convention.
6. Get a second pair of eyes
If your GA4 numbers have drifted from finance and nobody can say why, we can audit the implementation and set up the tests and monitoring with your team. Talk to us.
Disclosure: Henkan & Partners sells analytics implementation, QA and audit services.
FAQ
Frequently asked questions about GA4 debugging and QA
Frequently asked questions
What is GA4 DebugView?
DebugView is a GA4 report, under Admin > Data display > DebugView, that shows events from devices in debug mode as they arrive: a 60-second stream of events with their parameters, a minute-by-minute view of the last 30 minutes, the top events and the current user properties. It is the main way to validate GA4 tracking on the same day.
How do I enable debug mode in GA4?
Connect Tag Assistant or GTM preview to the site, which turns debug mode on for your session; or add debug_mode: true to the gtag config command; or set the debug_mode parameter to true in the Google tag in GTM. To turn it off, remove the parameter: Google states that setting it to false does not disable debug mode.
Why is GA4 DebugView not showing any events?
Usually consent (events from users who have not consented are not shown), ad blockers, a content security policy, a wrong Measurement ID, an internal traffic filter matching your IP, or debug mode not being on. Check the Network tab first: if no /g/collect request leaves the browser, the problem is not in GA4.
How do I see GA4 network requests in Chrome?
Open DevTools, go to the Network tab, tick Preserve log, and type collect in the filter. Each GA4 hit is a request to an endpoint ending in /g/collect. Shared parameters are in the URL; when events are batched, each event's parameters are on a separate line of the request body.
What does gcs=G100 mean in a GA4 request?
The gcs parameter encodes consent for ad_storage and analytics_storage after the prefix G1. G100 means both are denied, G111 both granted, G110 ads only and G101 analytics only. A newer gcd parameter encodes all four consent types, including how each was set by default and update.
How long does it take for GA4 events to appear in reports?
DebugView and Realtime show events within seconds to minutes. For standard properties, Google gives typical times of 2 to 6 hours for intraday data and about 12 hours for daily data, and warns that processing can take 24 to 48 hours, during which reports may change.
How do I stop duplicate purchases in GA4?
Send a unique, real transaction_id with every purchase. GA4 deduplicates purchases sharing a transaction ID on web streams only, and treats an empty string as a shared ID. Push the purchase once, from the order record.
Key terms
- DebugView
- The GA4 report that shows events from debug devices in real time. It matters because it is the only GA4 surface that confirms an event's parameters on the same day.
- Debug mode
- A flag (debug_mode, sent as _dbg) that routes a device's events to DebugView. It matters because it must be removed, not set to false, to switch off.
- Tag Assistant
- Google's debugging tool at tagassistant.google.com, with an optional Chrome extension, that shows which Google tags fired and with what data. It matters for checking triggers and consent order.
- GTM preview mode
- A Google Tag Manager mode that runs the unpublished container draft on your site and connects it to Tag Assistant. It matters because you can test changes before anyone else sees them.
- /g/collect request
- The network request the Google tag sends to GA4, carrying one or more events. It matters because it shows exactly what GA4 received, before processing.
- dataLayer
- A JavaScript array on the page through which the site passes events and data to the tag manager. It matters because it is the contract between front-end code and tracking.
- Ecommerce object clearing
- Pushing ecommerce: null before each ecommerce event. It matters because the dataLayer merges objects and leftover items otherwise leak into the next event.
- transaction_id
- The unique order identifier sent with purchase and refund events. It matters because GA4 uses it to deduplicate purchases on web streams.
- gcs / gcd
- Request parameters that encode the consent state of a hit. They matter because they explain why events were sent but not stored or not shown in DebugView.
- Consent Initialization trigger
- A GTM trigger designed to ensure consent settings are honoured before any other trigger fires. It matters because consent defaults set late do not work.
- Developer traffic filter
- A GA4 data filter that excludes activity from developers using debug mode. It matters because excluded data is never processed and the filter is not retroactive.
- Custom insights
- GA4 alerts evaluated hourly (web), daily, weekly or monthly on thresholds or anomalies, up to 50 per property. They matter because they flag tracking breakages before analysts do.
- Measurement Protocol validation server
- The /debug/mp/collect endpoint that returns validation messages for server-side events. It matters because server events cannot be inspected in a browser.
- JSON Schema
- A standard for describing the expected shape of JSON data. It matters because it turns an event spec into an automated test of every dataLayer push.
Sources
All sources were checked in October 2026. GA4 interface paths, limits and timings come from Google's current documentation; GA4 changes often, so re-check before relying on a specific figure. Didomi consent rates are vendor data. Practitioner documentation (David Vallejo, Simo Ahava, Analytics Mania) is used for the /g/collect parameters and DebugView troubleshooting, which Google does not fully document. Exhibits 1, 5 and 6, Tables 1 and 2 and the code examples are Henkan & Partners frameworks; Exhibit 7 uses illustrative data.
- Google Analytics Help (n.d.). GA4: Monitor events in DebugView.
- Google Analytics Help (n.d.). GA4: Data freshness.
- Google Analytics Help (n.d.). GA4: Realtime report.
- Google Analytics Help (n.d.). GA4: Data filters.
- Google Analytics Help (n.d.). Event naming rules.
- Google Analytics Help (n.d.). GA4: Enhanced measurement events.
- Google Analytics Help (n.d.). GA4: Minimize duplicate key events with transaction IDs.
- Google Analytics Help (n.d.). GA4: Create custom insights.
- Google Analytics Help (n.d.). GA4: BigQuery Export.
- Google Analytics Help (n.d.). GA4: Set up BigQuery Export.
- Google Analytics Help (n.d.). GA4: BigQuery Export schema.
- Google for Developers (n.d.). Measure ecommerce.
- Google for Developers (n.d.). Recommended events reference.
- Google for Developers (n.d.). Measure single-page applications.
- Google for Developers (n.d.). Validate events (Measurement Protocol).
- Google for Developers (n.d.). Set up consent mode on websites.
- Google for Developers (n.d.). Debug consent mode.
- Google Tag Manager Help (n.d.). Preview and debug containers.
- Google Tag Manager Help (n.d.). Page view triggers.
- Google Tag Manager Help (n.d.). Tag Assistant Chrome extension.
- Tag Assistant Help (n.d.). Troubleshoot with Tag Assistant.
- Google Analytics (n.d.). Google Analytics MCP Server (Experimental). GitHub.
- Vallejo, D. (2020). APP + WEB: Google Analytics Measurement Protocol version 2 (practitioner documentation).
- Ahava, S. (n.d.). Consent Mode V2 for Google Tags (practitioner documentation).
- Analytics Mania (n.d.). DebugView in Google Analytics 4 not working? Here are 18 solutions (practitioner documentation).
- Didomi (2026). Average consent rate in Europe: 2026 data privacy benchmark (vendor data).
- Didomi (n.d.). CMP metrics glossary (vendor documentation).
- Playwright (n.d.). Network and Page API.
- Cypress (n.d.). cy.intercept().
- Ajv (n.d.). Ajv JSON schema validator.