Focus
How to Measure an Experimentation Culture: Programme Metrics, a Learning Library and a Maturity Self-Assessment
Alexandre Suon · 2026-10-01
A culture of experimentation that nobody measures fades the day its champion leaves. This deep dive shows how to measure it: the programme metrics that matter (speed, trust, learning, reach and impact), how to build a learning library that turns single tests into institutional memory, and a five-level experimentation maturity model with a self-assessment and a one-page scorecard you can use this quarter.
Executive summary
- What you do not measure fades. In Speero's 2024 maturity audits (agency data, 154 programmes), 66% had no programme-level metrics and only 8% strongly agreed they had them. Without numbers, a programme depends on one enthusiastic person.
- Measure five families, not one number. Speed (tests per month, time to decision), trust (valid-test rate), learning (learning rate, with win rate as context), reach (teams testing, share of key decisions tested) and impact (winners implemented, attributed value).
- Learning rate is a better health metric than win rate. Win rates cluster around 12% in Optimizely's customer data (vendor data) and in Spotify's two main experimentation units. Spotify's learning rate, the share of tests that give a valid, decision-ready answer, averages 64% but ranges from 16% to 76% between teams.
- A learning library is the memory of the culture. Microsoft researchers place searchable institutional memory in the most mature stage of their model; in 2021-22, 58% of programmes audited by Speero had no knowledge base at all.
- A five-level maturity model shows where to invest next. Our model runs from Ad hoc to Repeatable, Trusted, Scaled and Evidence by default, across six dimensions. Twelve questions place you on it; the weakest dimension sets your real level.
- Review a one-page scorecard every quarter. Pair every speed metric with a quality metric, never set a win-rate target, and report losses avoided next to wins.
Section 1 · Why measure
A culture of experimentation needs its own metrics, or it fades when its champion leaves
Experimentation programme metrics are the measures an organisation uses to judge the health of its testing programme as a whole (how fast it decides, how far results can be trusted, how much it learns, how widely evidence is used and what it is worth), as opposed to the metrics used to judge a single A/B test.
Most programmes are measured, if at all, one test at a time. That says nothing about whether the organisation is getting better at deciding with evidence. A programme can run fifty tests a year and still leave every important decision to opinion.
The overview of how to build a culture of experimentation argues that culture is about who is allowed to be wrong and what gets rewarded. This article is about the next step: making that culture visible, so that it survives a reorganisation, a new CEO or the departure of the person who started it.
The gap is wide. Speero, a consultancy that runs free maturity audits, publishes what respondents report about their own programmes. The data is self-reported and comes from teams interested enough to take an audit, so it probably flatters the market.
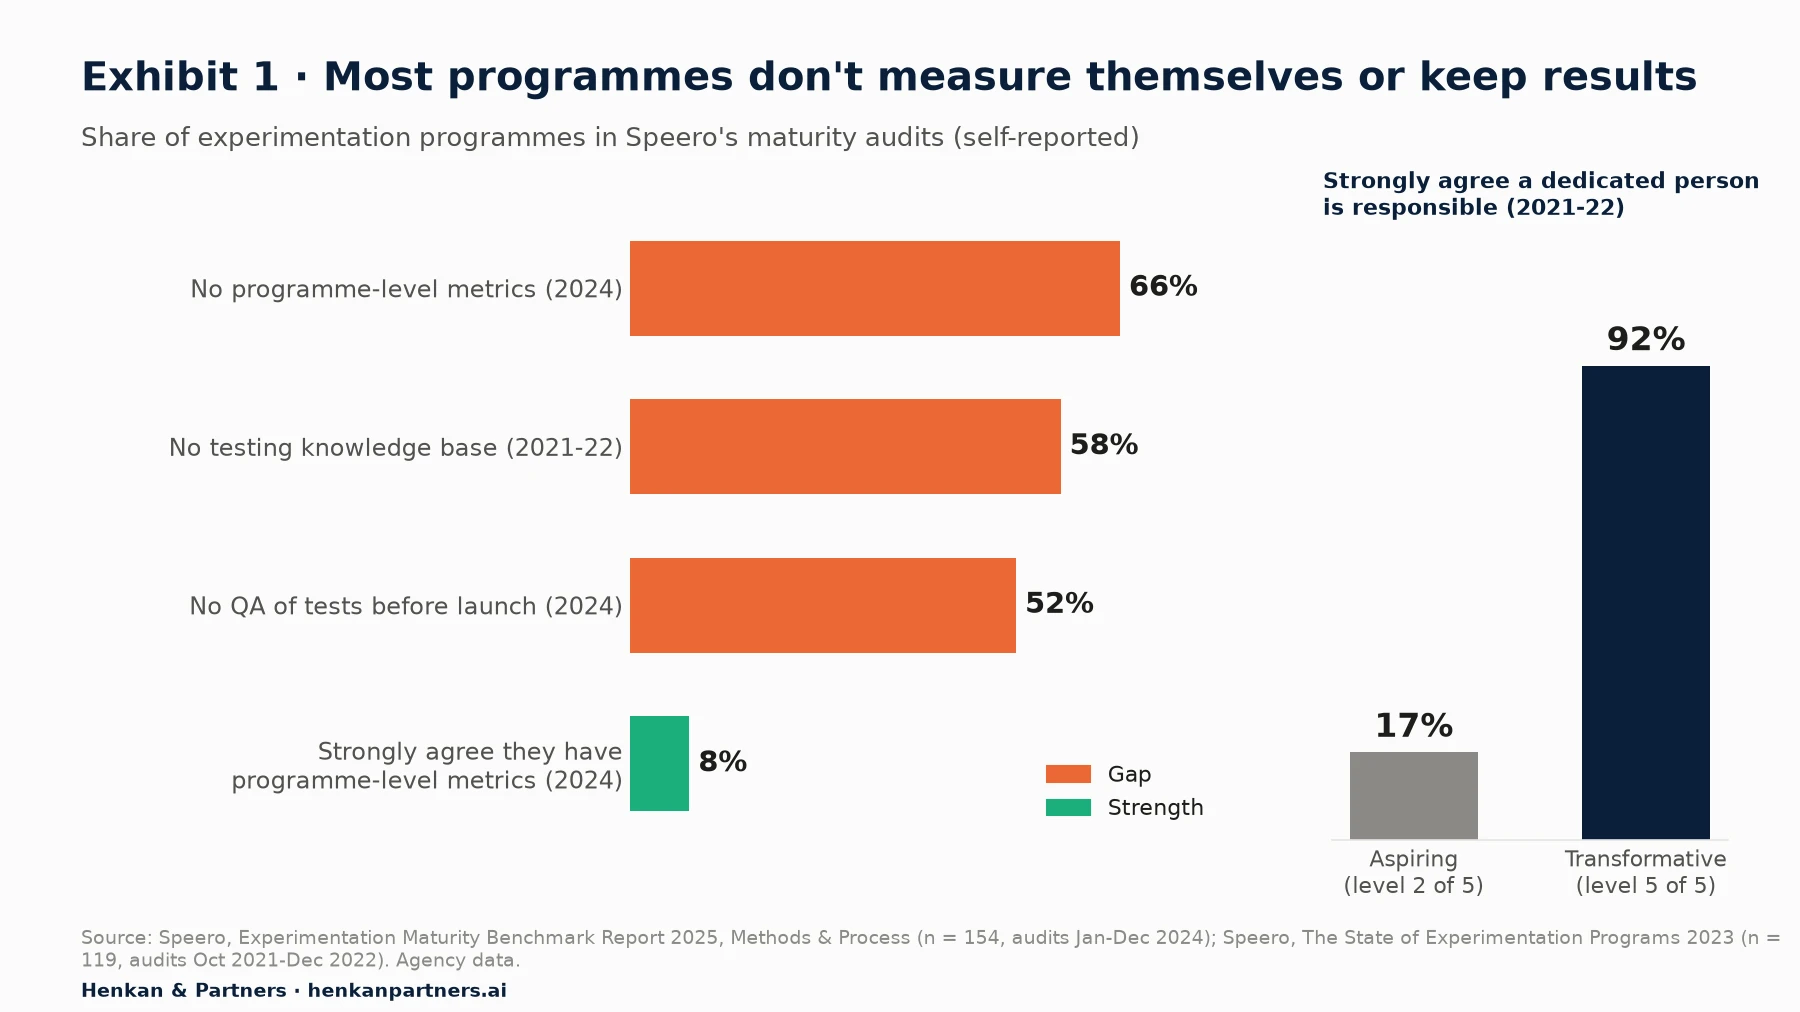
What this shows. Missing measurement and memory are at least as common as missing QA. The right-hand panel shows why that matters: ownership rises sharply with maturity, and Speero found that 91% of respondents with no dedicated team also had no knowledge base. When nobody owns the programme, nobody keeps its score or its history.
A 2023 Kameleoon survey of 159 managers in the US and UK found that businesses with "well-established" programmes that test across their full stack were "69% more likely to grow significantly" (vendor data, self-reported and correlational). The safer conclusion is narrower: a programme that can show its speed, quality and value on one page is far easier to fund than one with only a list of winners.
For leaders. Ask your programme owner one question: "If you left tomorrow, what would we still know?" If the answer is a folder of slide decks, the culture is not yet institutional, whatever the test count says.
Section 2 · The metric tree
Experimentation program metrics fall into five families: speed, trust, learning, reach and impact
Published sets of programme metrics mix how much a programme does with how well it does it. Speero's 2021 list pairs test velocity with test quality, efficiency and "program agility", the number of days from hypothesis to live test to implementation. Optimizely, a testing vendor, warns that "most successful programs don't just run more tests, they run better ones". We group these ideas into five families.
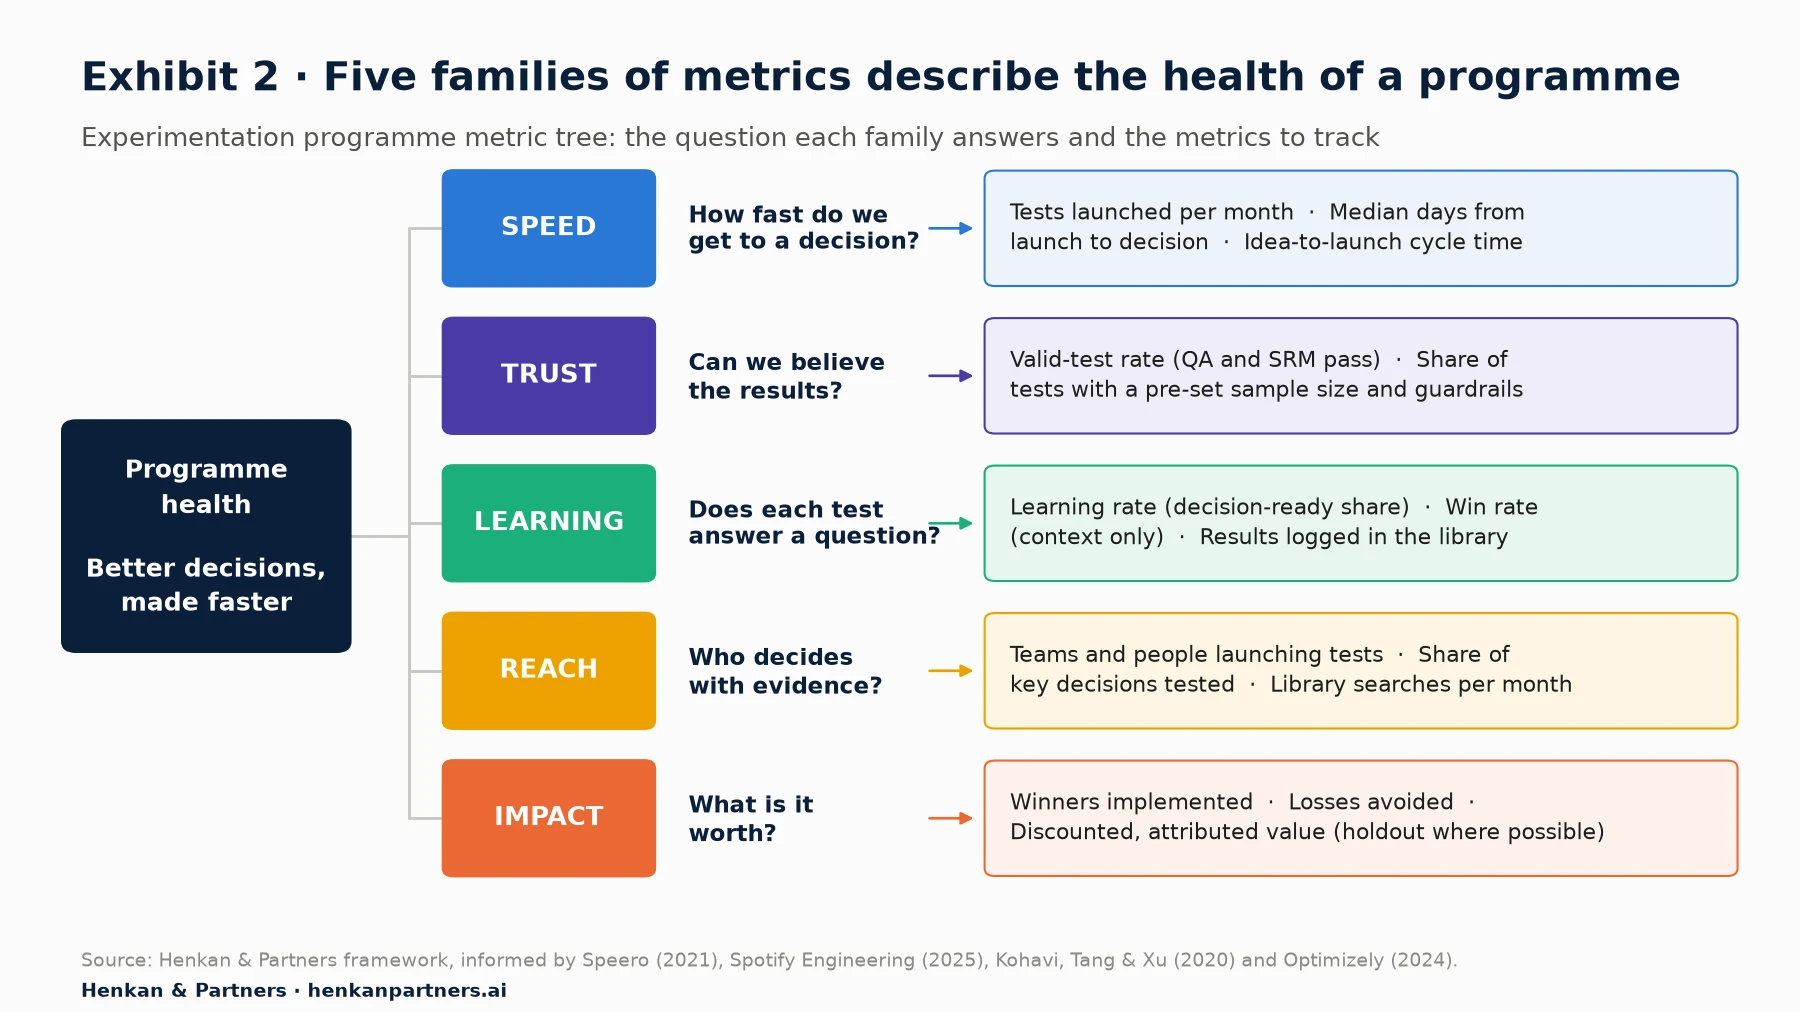
What this shows. The families balance each other. Speed without trust produces fast, wrong answers. Learning without reach stays inside one team. Impact without learning produces a few lucky wins and no understanding of why. A scorecard needs at least one metric from each family, and the families matter more than the exact metrics you pick.
Each metric can be gamed on its own: tests split into trivial changes, failed tests quietly re-run, data re-cut until something looks significant. Two rules keep the tree honest. First, pair every speed metric with a trust metric: a jump in velocity alongside a drop in the valid-test rate is a warning, not a success. Second, never set a target for win rate. Most ideas fail, and a target pushes analysts towards finding wins that are not there. Our list of A/B testing mistakes that fake a result shows how easily that happens.
Section 3 · Speed
Velocity matters, but time to decision says more about the culture
Test velocity, the number of experiments launched in a period, is the most common programme metric because it is easy to count. Optimizely's analysis of 127,000 experiments on its platform gives reference points (vendor data): the median company runs 34 experiments a year, about three a month; around 200 a year puts a company in the top 10%, and the top 3% run more than 500.
Velocity is a useful early signal, but the same vendor's earlier research shows the limit of chasing volume.
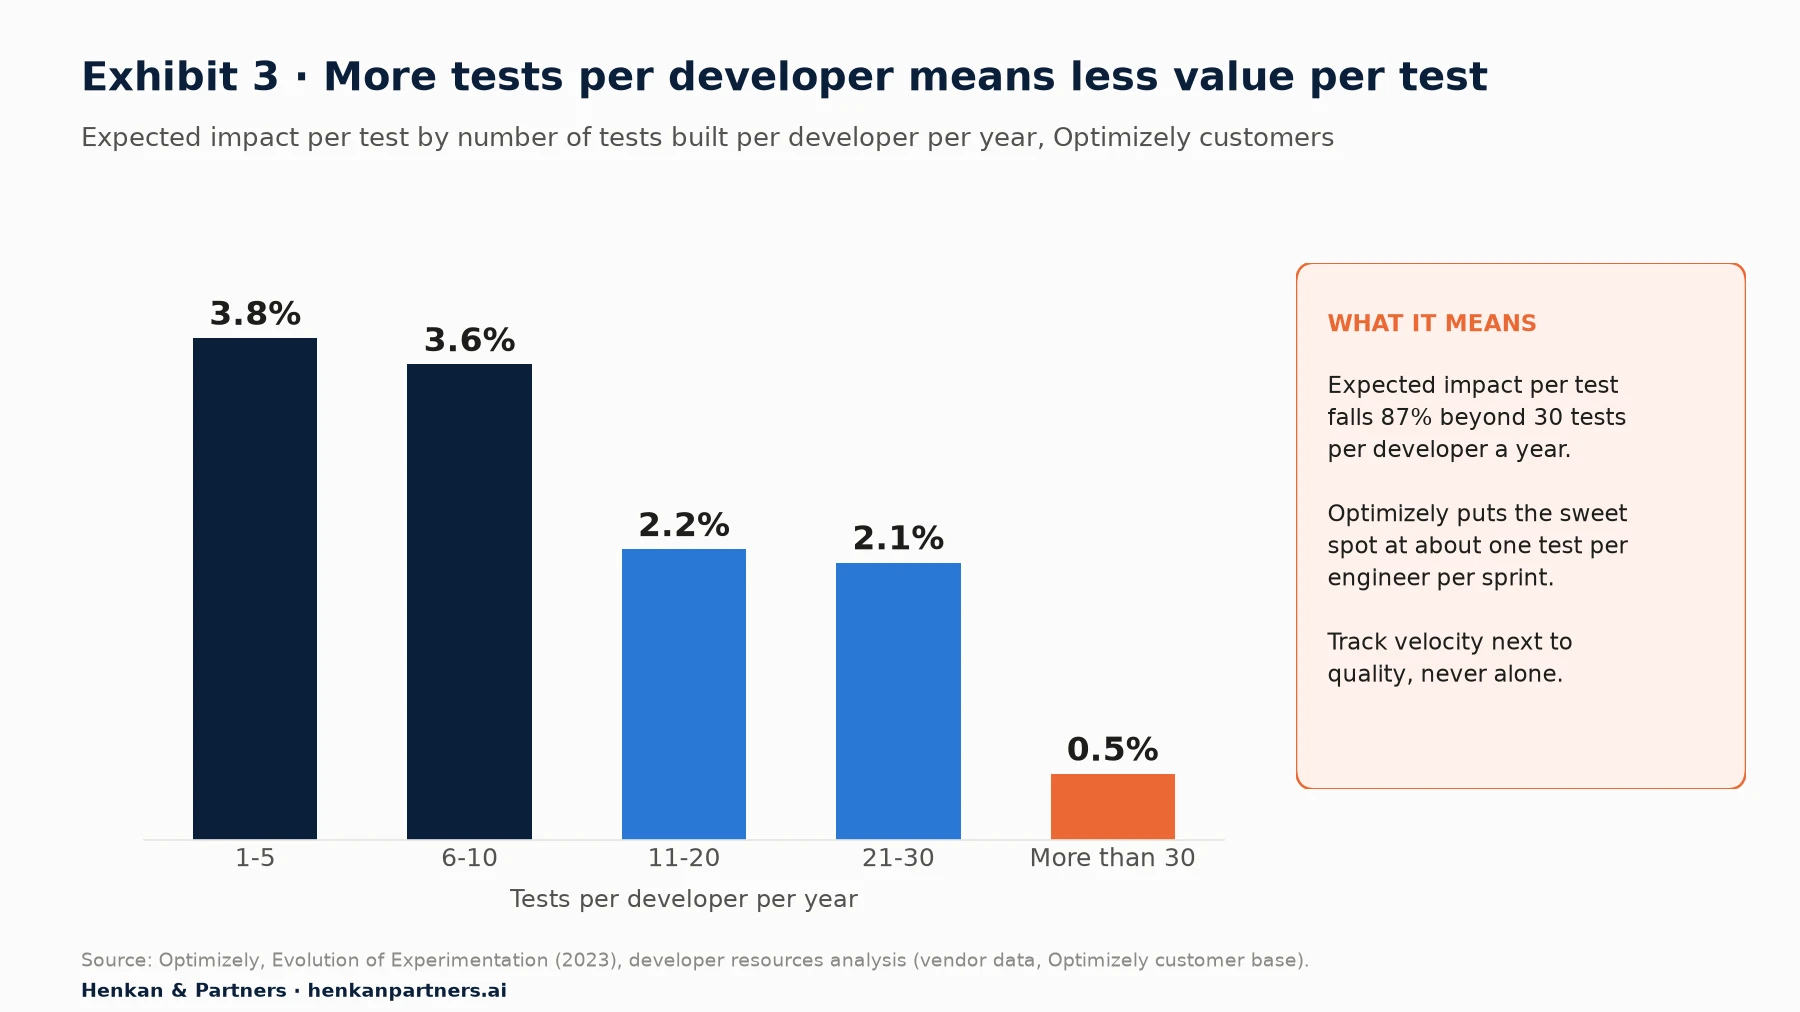
What this shows. When developers build more than 30 tests a year each, Optimizely reports an 87% drop in expected impact per test, and puts the sweet spot at around one test per engineer per two-week sprint, about 24 a year. The likely reason is that teams under volume pressure test smaller, safer changes. Velocity is a capacity metric, and should be read next to quality and impact, never on its own.
Time to decision is the metric we find most revealing. It measures the median number of days from launch to a recorded decision: ship, stop or iterate. A programme that takes six weeks to decide anything has a culture problem, not a tooling problem: usually nobody owns the decision, or results wait for a senior person's meeting.
Time to decision (days) = date decision recorded - launch date
Idea-to-launch cycle time (days) = launch date - date idea approved in backlog
Report the median, not the mean: one stuck test should not hide twenty fast ones.
The companion article on building momentum in an experimentation programme covers how to raise velocity without lowering quality.
Section 4 · Trust and learning
Win rate is a poor health metric; learning rate and valid-test rate are better
Win rate is the number executives ask for, and the easiest to misread: a low win rate can mean bold testing as easily as poor ideas.
Spotify proposed a better measure in 2025. Its learning rate counts an experiment as successful if it is valid, meaning "the setup and data collection worked as intended (e.g., traffic flowed, metrics were measured, no sample ratio mismatches)", and decision-ready: it either found an improvement without regressions, detected a regression, or was neutral while being powered well enough to detect the effect it was looking for.
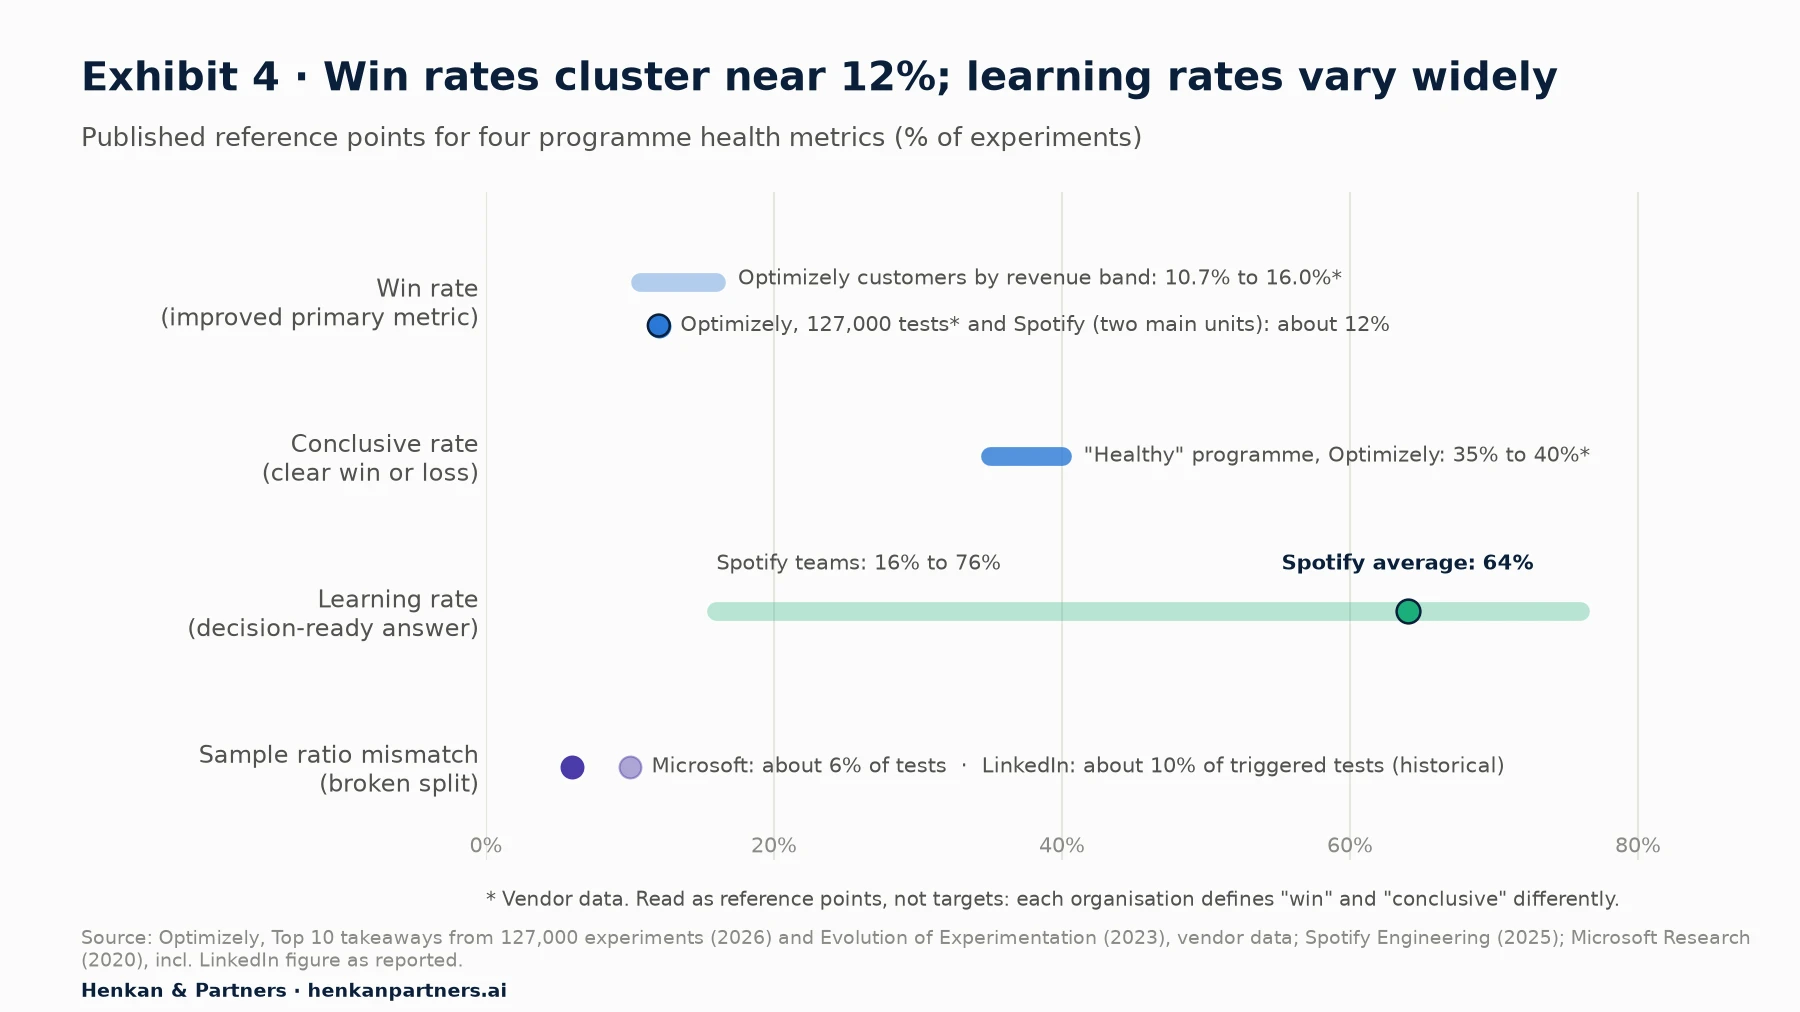
What this shows. Win rates sit in a narrow band around 12% across Optimizely's customer base and in Spotify's two main experimentation units, so they say little about the health of any one programme. Learning rates spread far more widely: Spotify's teams range from 16% to 76%. That spread is what makes learning rate useful. It separates teams that design clean, well-powered tests from teams that run tests nobody can act on.
Optimizely uses a related idea, the conclusive rate. It says "a healthy program has a 35-40% conclusive rate, which means roughly 60% of tests don't produce a clear win or loss" (vendor data). Its definition is narrower than Spotify's, because a well-powered neutral result counts as learning at Spotify but not as conclusive at Optimizely. Pick one definition, write it down, and keep it stable so the trend means something.
The valid-test rate protects everything else
A learning rate is only as good as the data under it. The valid-test rate is the share of completed tests that passed pre-launch QA, passed the sample ratio mismatch (SRM) check and had no unresolved data incident. SRM means the split between groups differs from the one planned, for example 52/48 instead of 50/50, which signals that something in assignment or tracking is broken. Microsoft's experimentation team reported in 2020 that "about 6% of A/B tests have an SRM" and that LinkedIn found about 10% of its triggered tests used to suffer from the problem.
A programme that reports no SRM at all is probably not checking. Speero's 2024 audits found that 52% of businesses "don't QA tests before launch" (agency data). Our A/B test QA checklist covers the checks, and our guide to guardrail metrics covers when to stop a test that is doing harm.
For marketers. Report learning rate first and win rate second. "We ran 18 tests; 11 gave us a clear answer; 2 shipped and 3 stopped changes that would have hurt revenue" tells a stronger story than "we had 2 winners".
For leaders. If the valid-test rate drops, slow down before you scale up. One broken test presented as a win can undo a year of credibility.
Section 5 · Reach
The best culture metric is the share of key decisions that were tested
Reach describes the culture: how far evidence has spread into decisions. Kohavi, Tang and Xu devote a chapter of their book to institutional memory and meta-analysis of past experiments. In our experience, three reach metrics capture that spread best.
- Active teams and experimenters. Teams, and individual people, who launched at least one test in the quarter. It shows whether testing is spreading beyond the core team.
- Share of key decisions tested. Agree a short list of decision types with your sponsor, for example any change to checkout, pricing display, navigation, search or a major feature. Each quarter, count how many such decisions were tested or had a written reason not to test.
- Library usage. Searches of the learning library per month, or the share of new test ideas that cite a past result.
Illustrative example. A fashion retailer lists 20 key decisions in a quarter. Seven were tested, two had a documented reason not to test (a legal change and a platform migration), and eleven shipped on opinion. The share of key decisions tested is 9 out of 20, or 45%. The conversation with the sponsor is no longer about how many tests ran, but about which of those eleven untested decisions should have been tested.
Reach depends on how the programme is organised. Whether testing should sit in one central team, a centre of excellence or every product team is the subject of our companion piece on choosing an experimentation operating model, and how to talk about these numbers to each audience is covered in how to talk about experimentation to every stakeholder.
Section 6 · Impact
Report value conservatively, or the programme loses credibility with finance
Impact is the family most often overstated. The usual error is to add up the uplift of every winning test and call it the programme's value. But winners are often overestimated, effects fade and overlapping tests do not simply add up.
Optimizely's own data shows the decay (vendor data): most experiment uplifts fall "to 80% of their first month value after a year, except for revenue, which retains 91% after a year", while custom metrics retain only 57%. Our article on experimentation ROI sets out a full method, including holdout groups. For the scorecard, three impact metrics are enough.
| Metric | Definition | Why it matters |
|---|---|---|
| Implementation rate | Share of winning variants live in production within 60 days of the decision | A winner that is never built is value found but not banked; it is also a sign that decisions are not owned |
| Losses avoided | Count, and estimated value, of changes stopped because a test showed harm | Makes the protective value of testing visible and rewards honest reporting |
| Attributed value | Annualised value of implemented winners, discounted for decay and uncertainty, agreed with finance; validated with a holdout where possible | Gives the sponsor a number that survives scrutiny |
Attributed value (year) = sum over implemented winners of [ measured effect x annual baseline x decay factor x confidence discount ]
Decay factor: from your own re-tests or holdouts; vendor data suggests roughly 0.8 for most metrics after a year
Confidence discount: agreed with finance (in our experience 0.5 is a sensible starting point for single tests)
In our experience, the implementation rate is the most neglected number in the whole scorecard. We regularly find winners from months earlier that were never built, because the test and the backlog had different owners.
Section 7 · Learning library
A learning library turns individual tests into institutional memory
A learning library (also called a test repository or knowledge base) is a searchable record of every experiment an organisation has run, with its hypothesis, design, result, decision and learning. It is how a programme remembers.
The research is consistent on this point. In their Experimentation Evolution Model, Microsoft researchers Fabijan, Dmitriev, Olsson and Bosch place institutional memory in the most mature "Fly" phase: to stop an experiment owner repeating a test that was already run, the platform should keep searchable metadata such as the "hypothesis, experiment outcome, selected markets and execution date". Booking.com's team names "a central repository of successes and failures to allow for knowledge sharing" first among the practices that let it democratise experimentation.
Most organisations are far from this. Speero's 2021-22 audits found that 58% of respondents had no testing knowledge base, and its 2024 commentary still put the figure at about half (agency data).
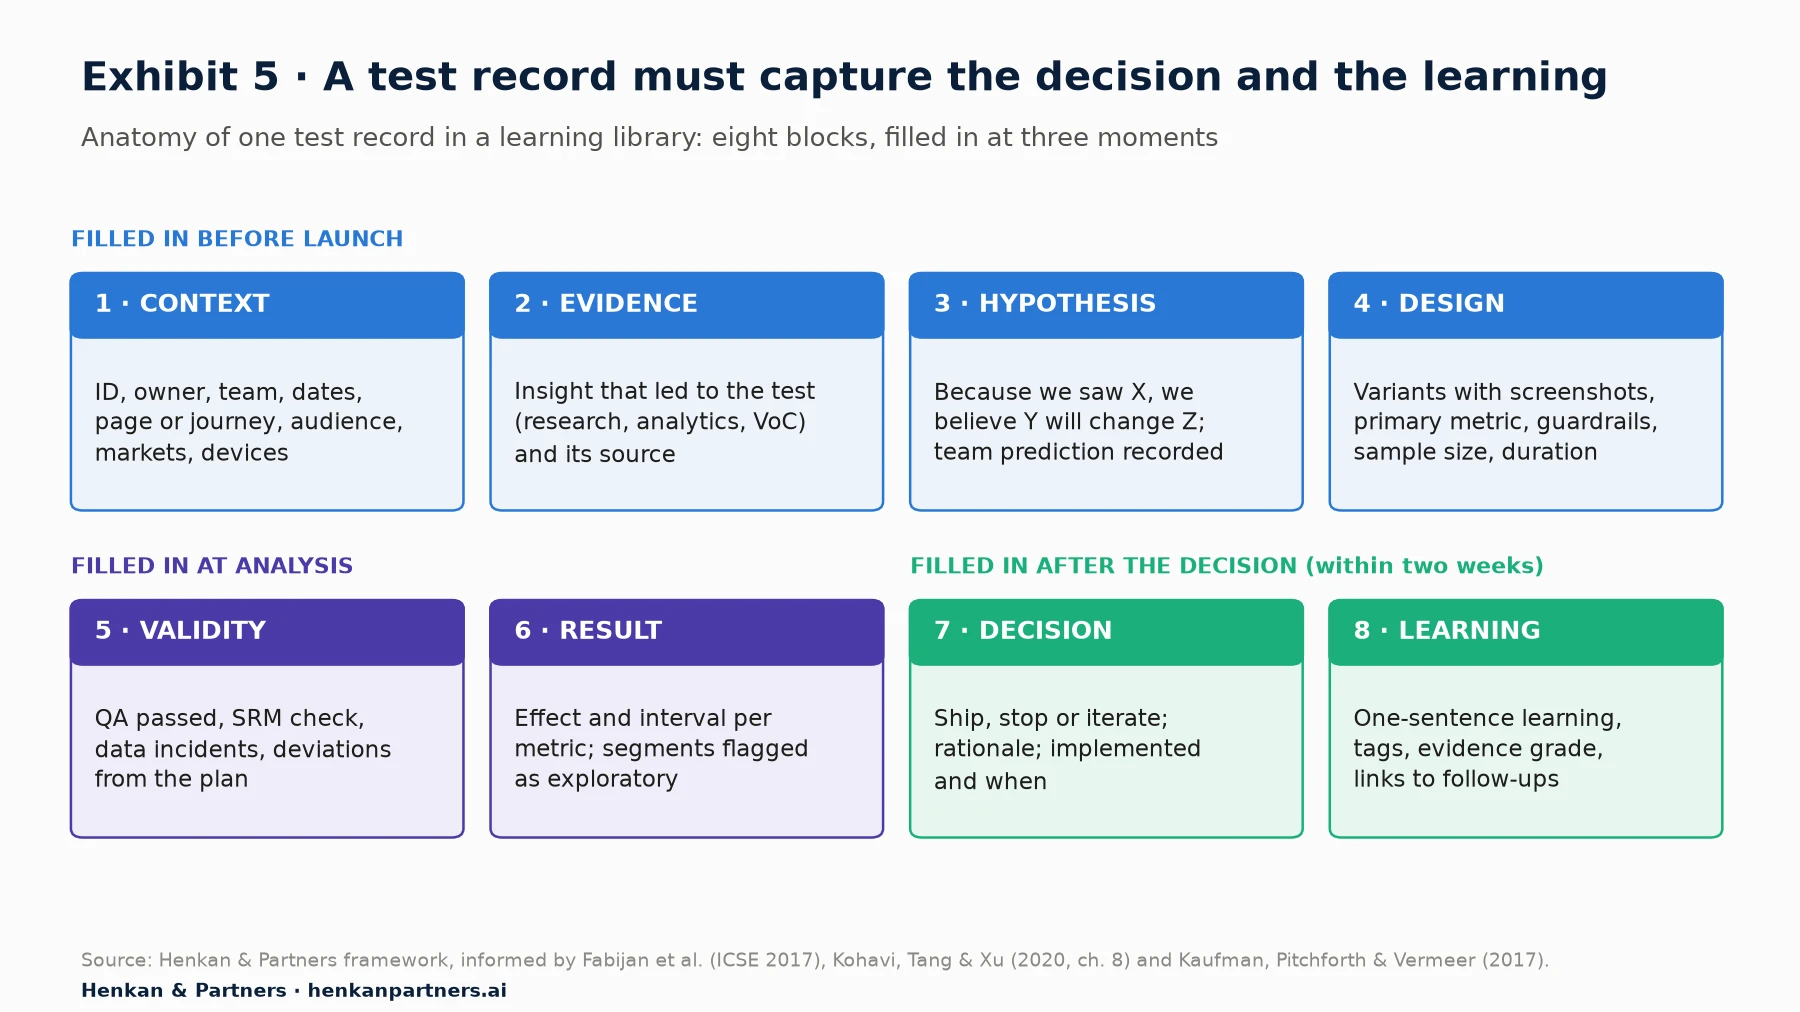
What this shows. Most test logs stop at block 6, the result. The value sits in blocks 7 and 8: what was decided, why, and what the organisation now believes. Filling the record at three moments keeps it accurate.
Tag every test so the library can answer questions
A library is only searchable if tests are tagged consistently. We recommend five tag groups, each with a short fixed list of values that only the programme owner can extend.
- Where: page type or journey step (home, listing, product page, basket, checkout, account, app screen).
- What changed: lever (copy, layout, imagery, price display, delivery promise, social proof, navigation, search, personalisation, performance).
- Why: the behavioural principle or customer problem behind the hypothesis (for example trust, clarity, effort, urgency, choice overload).
- Who: audience, device and market.
- How sure: an evidence grade (for example A = valid, well-powered, replicated; B = valid single test; C = exploratory or underpowered).
With consistent tags, the library supports meta-analysis: looking across many tests to find patterns no single test can show, such as which levers work on mobile, which pages respond to change at all, or whether a type of idea keeps losing. According to the same summary, Kohavi, Tang and Xu also suggest using this history to quantify the programme's contribution and the share of features launched through experiments. Run one meta-analysis a year and present it to the sponsor. Our article on turning customer insights into a test backlog shows how library learnings feed the next round of hypotheses.
Tools range from a spreadsheet to a wiki, a testing-platform feature or a dedicated repository; Airbnb even open-sourced its Knowledge Repo for sharing analyses. The tool matters less than the standard record and the discipline of filling it in.
Disclosure: Henkan & Partners develops Stuart Repo, an experimentation memory product that stores tests, learnings and decisions and makes them available to AI assistants. The record structure above is tool-neutral and works in any system.
Section 8 · AI
AI makes a learning library more valuable, and a messy one more dangerous
AI assistants and agents change what a library is for. A product manager can ask "What have we learned about delivery messaging on mobile product pages?" and get a summary with links to the tests. The Model Context Protocol (MCP), "an open-source standard for connecting AI applications to external systems", makes it practical to connect an assistant to a test repository, analytics and a backlog at once.
Vendors are moving in this direction. Optimizely reports that "19.54% of follow-up tests are driven by agent recommendations grounded in prior results" from its Opal AI agents (vendor data, with no independent measure of the quality of those tests). Our article on AI agents in experimentation maps what agents can do at each step of the workflow.
Three risks come with this, and all three are risks of the library, not of the model.
- Garbage in, confident garbage out. An assistant will summarise an underpowered test or a test with an SRM failure as fluently as a clean one. Evidence grades and validity fields must be in the record, and the assistant must be told to use them.
- Learnings stated as laws. "Urgency messaging works" is not a learning; "countdown banners raised add-to-basket on mobile listing pages in two valid tests" is (illustrative wording).
- Access and confidentiality. Test results contain commercial data. Give assistants read-only, role-based access.
Our view. The organisations that will get most from AI in experimentation are not the ones with the most advanced models. They are the ones with five years of clean, consistently tagged test records. Start building that record now; the AI layer can be added later.
Section 9 · Maturity model
Five levels of maturity take a programme from occasional tests to evidence by default
Maturity models are useful when they show what to do next. Ours is a Henkan & Partners framework informed by two published models. The Experimentation Evolution Model from Microsoft researchers (Fabijan, Dmitriev, Olsson and Bosch, 2017) describes four phases (Crawl, Walk, Run and Fly) across technical, organisational and business dimensions. In their account, scaling beyond 100 experiments a year is the work of the Run phase, and in Fly every small change is backed by an experiment, as at Bing, where "thousands of experiments" were active at the same time. Fabijan's 2018 doctoral thesis develops this into the Experimentation Growth Model. Speero scores programmes on five levels from Beginner to Transformative across strategy and culture, people and skills, data and tools, and process.
We use five levels because most e-commerce teams sit in the first step, where Crawl is too broad to guide action, and six dimensions because measurement and memory deserve their own scores.
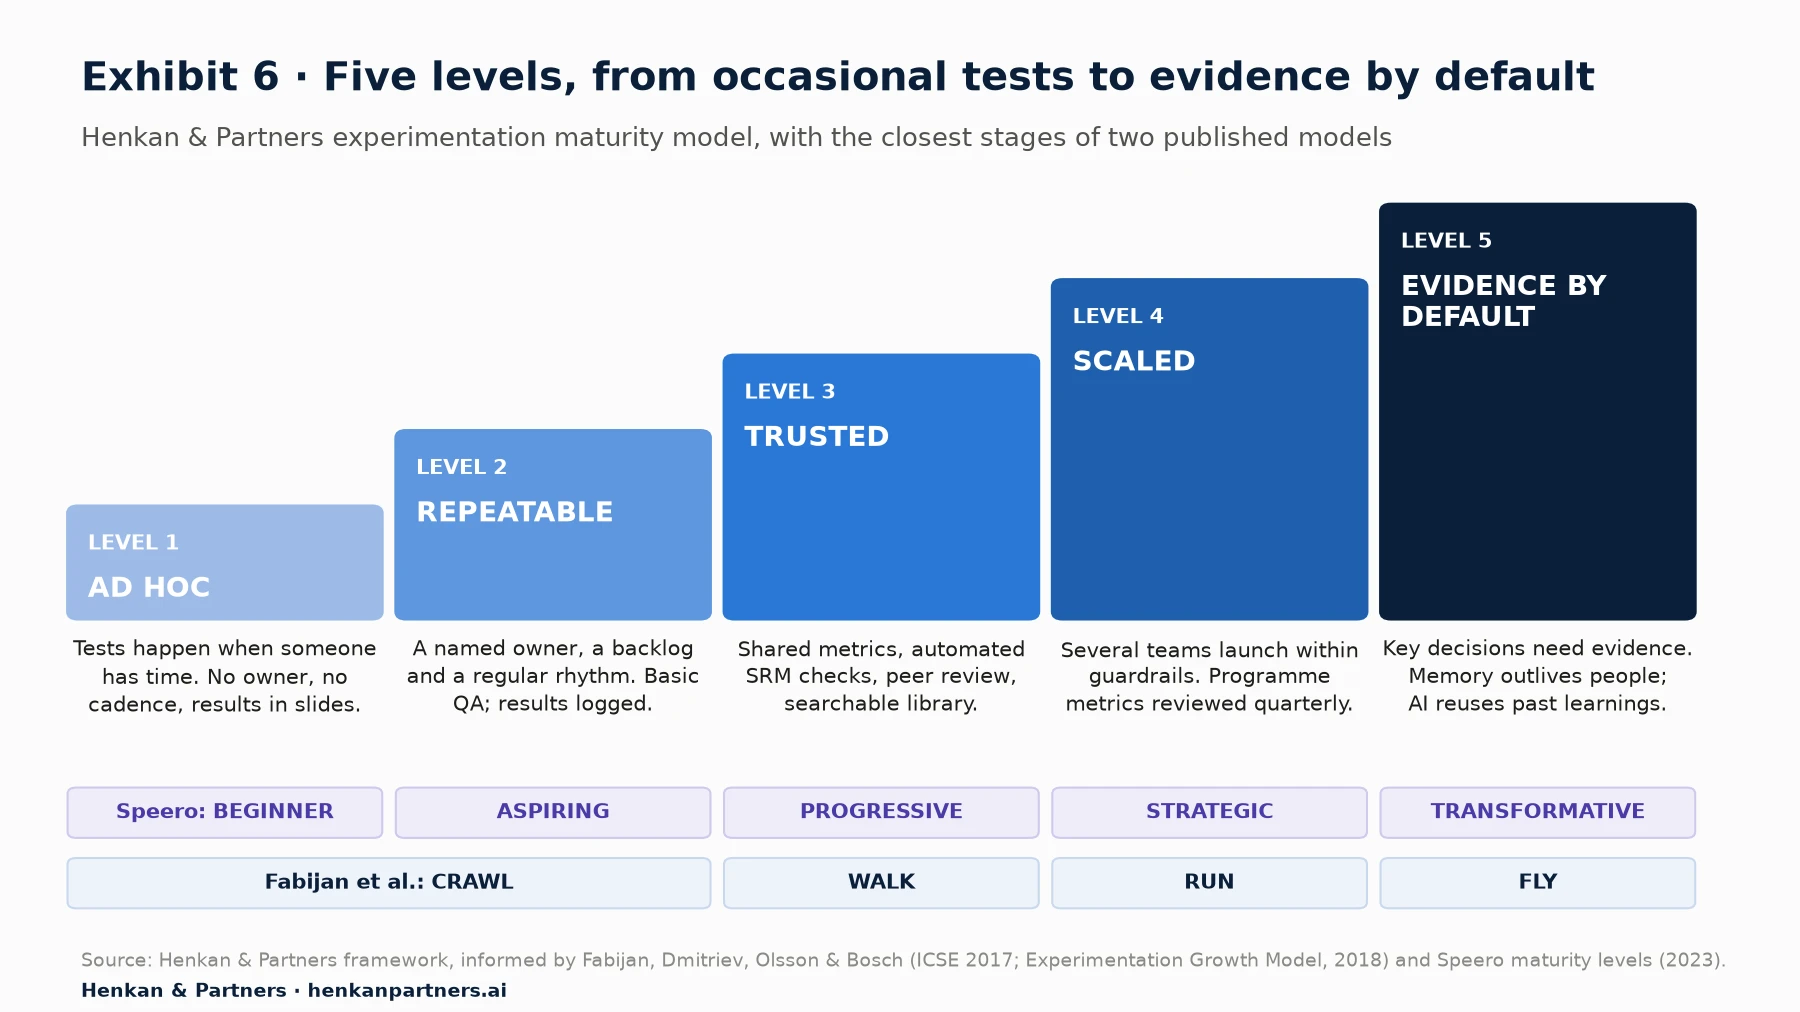
What this shows. Each level adds one kind of capability: an owner and rhythm (2), trustworthy results and memory (3), spread across teams (4), and decisions that require evidence by default (5). The mapping is approximate; the published models use different dimensions and thresholds. What they share is the direction of travel: from a central expert team to many teams testing within shared guardrails.
| Dimension | 1. Ad hoc | 2. Repeatable | 3. Trusted | 4. Scaled | 5. Evidence by default |
|---|---|---|---|---|---|
| Leadership and decisions | Decisions are made by opinion; tests confirm ideas already chosen. | A sponsor backs the programme; some decisions wait for test results. | Leaders accept results that go against them; a written rule says which changes must be tested. | The share of key decisions tested is tracked and reviewed by leadership. | Evidence is expected for every key decision; leaders put their own ideas to a test in public. |
| Ownership and people | No owner; tests are run by whoever has time, or by an agency on request. | A named owner with protected time, supported by a small core team or partner. | The core team sets standards, trains others and reviews every test. | Several teams launch tests, with a champion in each; the central team acts as a centre of excellence. | Most product and marketing teams test on their own; the central team runs the platform and quality. |
| Process and quality | No written hypothesis; QA is ad hoc; tests are stopped when the result looks good. | Hypothesis template, prioritised backlog and a QA checklist before launch. | Sample size and guardrails set before launch; automated sample ratio mismatch (SRM) checks; peer review of analysis. | Standards are built into tools and templates; the valid-test rate is tracked and stays high. | The process is improved from meta-analysis of past tests; quality issues are rare and visible. |
| Metrics and measurement | Only the win or loss of individual tests is reported. | Test count and win rate are tracked. | A scorecard covering speed, trust and learning is reviewed monthly; metric definitions and a primary success metric are shared. | A full scorecard including reach and impact is reviewed quarterly with the sponsor; value is estimated with finance. | Programme metrics are part of business reviews; holdout groups measure cumulative impact; the success metric feeds team goals. |
| Knowledge and memory | Results live in slide decks, inboxes and people's heads. | A shared spreadsheet or page lists tests and outcomes. | A searchable library holds a standard record for every test, losers and flat results included, with consistent tags. | New ideas start with a library search; a meta-analysis runs at least once a year; a results digest goes out regularly. | The library is the system of record, linked to decisions and implementation; AI assistants can query it under governance. |
| Platform and data | A testing tool is used occasionally; analytics has not been audited. | One testing tool, connected to analytics, with basic tracking checks. | Audited analytics, known consent effects, a shared metric catalogue and alerting on broken tests. | Client-side and server-side testing, self-service set-up and integrations with analytics and customer data. | The platform supports many concurrent tests, checks for interactions and stops harmful tests automatically. |
Two cautions. First, levels are not targets for every business. A retailer with modest traffic may run a healthy programme at Level 3 for years. The companion article on how big tech experiments at scale is clear about what cannot be copied without that scale. Second, skipping levels rarely works. Opening testing to many teams (Level 4) before results are trustworthy (Level 3) spreads tests that nobody believes.
Section 10 · Self-assessment and scorecard
Score yourself in 20 minutes, then track a one-page scorecard every quarter
The self-assessment has twelve questions, two per dimension. Answer for what actually happened in the last six months, not for what is planned. Score each from 1 to 5: 1 = never or not in place, 2 = rarely or just started, 3 = sometimes or partly in place, 4 = mostly in place, 5 = always, fully in place and used.
- Leadership and decisions. When a significant change to the site, app or offer is planned, is it tested, or is a reason for not testing written down?
- Leadership and decisions. Do senior leaders put their own ideas to a test and act on results that go against them?
- Ownership and people. Is there a named programme owner with protected time, and a sponsor who reviews the programme at least once a quarter?
- Ownership and people. Do teams beyond the core team launch tests themselves, within shared guardrails? (1 = one person or an agency only; 5 = most product and marketing teams)
- Process and quality. Does every test have a written hypothesis, a primary metric, guardrail metrics and a sample size before launch?
- Process and quality. Are QA and sample ratio mismatch checks run on every test, with failures recorded rather than quietly re-run?
- Metrics and measurement. Do you track programme metrics (speed, trust, learning, reach, impact) and review them on a fixed cadence?
- Metrics and measurement. Is the value of the programme estimated with a documented, conservative method that finance has agreed?
- Knowledge and memory. Is every test, including losers and flat results, stored in one searchable library using a standard record?
- Knowledge and memory. Do new test ideas start with a search of past results, and do you analyse your test history as a whole at least once a year?
- Platform and data. Do you trust the data behind your tests: analytics audited, consent effects understood, metric definitions shared?
- Platform and data. Can tests be set up, monitored and analysed without bespoke engineering each time, and can people (or AI assistants) query results in a governed way?
Dimension score = average of its two questions
Overall score = average of the six dimension scores
Level: 1.0-1.79 Ad hoc | 1.8-2.59 Repeatable | 2.6-3.39 Trusted | 3.4-4.19 Scaled | 4.2-5.0 Evidence by default
Weakest-link rule: your level cannot be more than one level above your lowest dimension
The weakest-link rule matters most. A programme with many teams testing (Level 4 on ownership) but unaudited data (Level 1 on platform and data) is, in practice, a Level 2 programme: its reach multiplies results that may be wrong. Improve the lowest dimension first, then the one your sponsor cares about most.
Illustrative worked example. An online retailer scores leadership 2.5, ownership 3.0, process 3.5, metrics 1.5, memory 2.0 and platform 3.5. The overall average is 2.67, which falls in the Trusted band. But the weakest dimension, metrics at 1.5, sits at Level 1, so the weakest-link rule caps the programme at Level 2, Repeatable. The next quarter's priority is clear: introduce a programme scorecard and a learning library, not more tests or a new tool.
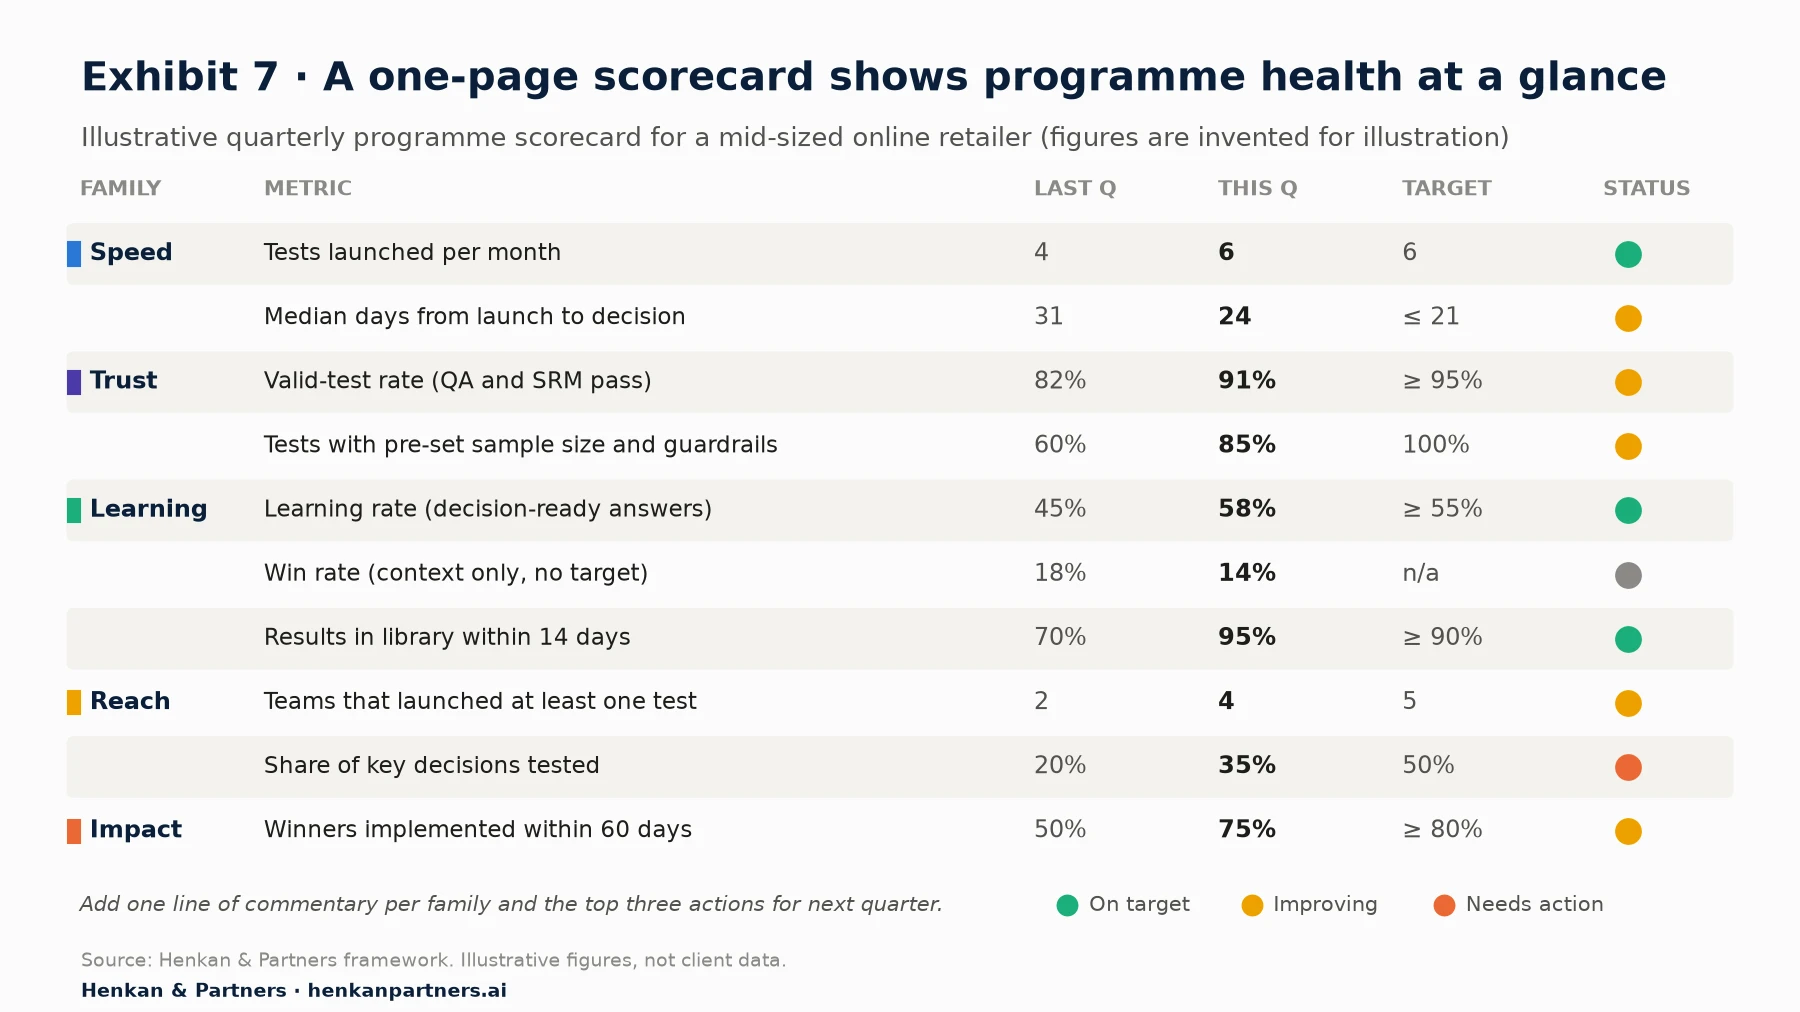
What this shows. Ten metrics fit on one page and cover all five families. Win rate is shown for context with no target. The status column tells the sponsor where to look: here speed, trust and learning are improving, but only a third of key decisions are tested, which is the conversation to have.
Review the scorecard monthly within the programme team and quarterly with the sponsor, with one line of commentary per family and the top three actions for the next quarter. The rituals that keep these reviews alive, from the weekly test review to the quarterly roadmap, are covered in where to start with an experimentation programme. Re-run the self-assessment every six months.
Section 11 · What to do next
What to do next
1. Take a baseline this month
Run the twelve-question self-assessment with two or three colleagues from different teams. Where answers differ, discuss why.
2. Build a first scorecard from the data you already have
Pull the last six months of tests from your testing tool. Count tests launched, median time to decision, valid tests, decision-ready answers and implemented winners.
3. Start the learning library with a standard record
Adopt the eight-block record for every new test from now on, then back-fill the last twelve months, decisions and learnings included. Agree the tag lists before you start.
4. Agree the list of key decisions with your sponsor
Write down which decision types should be tested by default, and start counting the share that were. It is the clearest sign of whether a culture is forming.
5. Put the scorecard on the sponsor's calendar
Book a quarterly review now. Present all five families, losses avoided next to winners, and three actions. To get started faster, download the Experimentation Culture Kit, which includes the maturity self-assessment and a health scorecard template, alongside a one-page charter, ritual agendas, a stakeholder map, objection cards and a RACI. When you are ready to build the team that runs it, read our guide to hiring and training an experimentation team. Want an outside view of where your programme stands? Talk to us.
FAQ
Frequently asked questions about measuring experimentation maturity
Frequently asked questions
What is an experimentation maturity model?
An experimentation maturity model describes the stages an organisation goes through as it moves from occasional A/B tests to making most decisions with experimental evidence. Examples include Microsoft's Crawl, Walk, Run, Fly model and Speero's five levels. Henkan & Partners uses five levels: Ad hoc, Repeatable, Trusted, Scaled and Evidence by default.
What are the most important experimentation program metrics?
Use at least one metric from each of five families: speed (tests per month, time to decision), trust (valid-test rate), learning (learning rate, with win rate as context), reach (teams testing, share of key decisions tested) and impact (implementation rate, losses avoided, discounted value).
What is a good A/B test win rate?
There is no good target. Published win rates cluster around 12%: Optimizely reports 12% across 127,000 experiments (vendor data) and Spotify reports about 12% in its two main experimentation units. Track it for context, never as a goal.
What is the difference between win rate and learning rate?
Win rate counts tests that improved the primary metric. Learning rate, as defined by Spotify in 2025, counts tests that were valid and gave a decision-ready answer: a win, a detected regression, or a well-powered neutral result. Spotify's win rate is about 12% in its two main experimentation units; its learning rate averages 64% across its R&D.
How many A/B tests should we run per month?
It depends on traffic and resources. Optimizely's customer data (vendor data) shows a median of 34 experiments a year, about three a month, and around 200 a year to reach the top 10%. Raise velocity only while the valid-test rate and impact per test hold up.
What should a test repository or learning library contain?
For each test: context, the evidence behind the idea, the hypothesis and prediction, the design (variants, metrics, sample size), validity checks, results, the decision with its rationale, and a one-sentence learning with tags and an evidence grade.
How do you measure a culture of experimentation?
Track the share of key decisions that were tested, the number of teams and people launching tests, and whether results are used: library searches, implemented winners and time to decision. Run a maturity self-assessment every six months.
Can AI help manage an experimentation programme?
Yes, mainly by searching and summarising past tests, suggesting follow-up tests and drafting result write-ups. Standards such as the Model Context Protocol let assistants connect to a test library. The quality of the output depends on the quality of the records, so validity fields and evidence grades must be stored with every test.
Key terms
- Experimentation programme metrics
- Measures of the health of a testing programme as a whole. They matter because single-test results say nothing about whether the organisation is getting better at deciding.
- Test velocity
- The number of experiments launched in a period. It matters as a capacity signal, but rewards small tests if used alone.
- Time to decision
- Median days from launch to a recorded decision (ship, stop or iterate). It reveals whether anyone owns decisions.
- Win rate
- Share of tests where the primary metric improved significantly. Useful context; harmful as a target.
- Learning rate
- Share of tests that were valid and gave a decision-ready answer (Spotify, 2025). It rewards clean, well-powered tests, not lucky ones.
- Conclusive rate
- Share of tests with a clear win or loss. Optimizely calls 35-40% healthy (vendor data); it shows how often tests settle a question.
- Sample ratio mismatch (SRM)
- A difference between the planned and actual split of users between variants. It signals broken assignment or tracking and invalidates results.
- Valid-test rate
- Share of tests that passed QA and the SRM check with no unresolved data incident. It protects the credibility of every other metric.
- Share of key decisions tested
- Share of decisions on an agreed list that were tested or had a recorded reason not to be. The clearest single measure of a culture of experimentation.
- Implementation rate
- Share of winning variants live in production within a set time. It shows whether found value is actually banked.
- Learning library
- A searchable record of every experiment, with decision and learning. It is the programme's institutional memory and the base for AI assistants.
- Meta-analysis
- Analysis across many past tests to find patterns. It turns a library into strategy, for example which levers work on which pages.
- Institutional memory
- Knowledge that stays with the organisation when people leave. Microsoft researchers place it in the most mature phase of experimentation.
- Experimentation maturity model
- A staged description of how testing capability grows. It helps choose the next investment, not award a badge.
Sources
Sources were checked in October 2026. Figures published by testing vendors (Optimizely, Kameleoon) are labelled vendor data, and figures from Speero's self-reported maturity audits are labelled agency data. Exhibits 2, 5, 6 and 7, the maturity model, the self-assessment, the scorecard and the worked examples are Henkan & Partners frameworks; Exhibit 7 and the worked examples use invented figures for illustration.
- Fabijan, Dmitriev, Olsson and Bosch (2017). The Evolution of Continuous Experimentation in Software Product Development, ICSE 2017.
- Fabijan, Malmö University (2018). Data-Driven Software Development at Large Scale: From Ad-Hoc Data Collection to Trustworthy Experimentation, doctoral thesis (chapter 8).
- Fabijan et al., Microsoft Research (2020). Diagnosing Sample Ratio Mismatch in A/B Testing.
- Kaufman, Pitchforth and Vermeer (2017). Democratizing online controlled experiments at Booking.com.
- Kohavi, Tang and Xu (2020). Trustworthy Online Controlled Experiments: A Practical Guide to A/B Testing, Cambridge University Press.
- Bellato, Schultzberg and Ankargren, Spotify Engineering (2025). Beyond Winning: Spotify's Experiments with Learning Framework.
- Optimizely (2026). Top 10 takeaways from running 127,000 experiments (vendor data).
- Optimizely (2023). Evolution of Experimentation (vendor data).
- Optimizely, Wakelin (2024). Scaling experimentation program's metrics (vendor content).
- Speero (2023). The State of Experimentation Programs 2023 (agency data).
- Speero (2025). Experimentation Maturity Benchmark Report 2025, Methods & Process (agency data).
- Speero, Crowell (2024). Why Mature Programs Grow Faster: Speero + Kameleoon Original Research (agency and vendor data).
- Speero, Kelly (2021). CRO / Experimentation Metrics That Matter.
- Kameleoon (2024). The difference between good and great companies when it comes to experimentation (vendor data).
- Airbnb (n.d.). Knowledge Repo, GitHub repository.
- Model Context Protocol (2026). What is the Model Context Protocol (MCP)?.