Focus
Building Momentum in an Experimentation Programme: Progress over Perfection
Alexandre Suon · 2026-10-01
Most experimentation programmes do not die from one bad test. They fade because nothing happens for weeks at a time. This deep dive explains how to build experimentation programme momentum: why a steady rhythm of imperfect but trustworthy tests beats a few perfect ones, how to raise test velocity, balance quick wins with big bets, celebrate losses, tell the story of each result, and spot a stalling programme before it is too late.
Executive summary
- Momentum is a flywheel, and the first turns are the hardest. Practitioners from Microsoft, Booking.com and Outreach describe A/B testing as a flywheel: running tests shows value, value builds interest, interest funds better tools, and better tools lower the cost of the next test. Every useful test pushes the wheel; every untrusted or ignored one slows it.
- Early on, consistency beats rigour, except on trust. You can accept simple designs, one metric and modest ambitions at the start. You cannot accept broken randomisation: about 6% of A/B tests at Microsoft show a sample ratio mismatch (SRM), and a programme that ships one bad result loses its credibility fast.
- Volume is how you find the rare big winners. Only 8% to 33% of experiments win at the companies that publish their rates, and in 1,450 Bing experiments the top 2% of ideas produced 74.8% of the gains. The median Optimizely customer runs 34 tests a year; the top 10% run about 200 (vendor data).
- Run a portfolio, not a queue. Use quick wins to prove the process and earn trust, then move slots towards iterations and big bets as the programme matures. Optimizely reports that tests combining several change types, and tests with four variations, deliver larger effects than simple A/B tests (vendor data).
- Celebrate losses and tell the story well. At Spotify, only about 12% of experiments win in the two units that run most of its tests, but 64% produce a valid, decision-ready learning and 42% end with a decision not to ship after guardrail metrics flag a problem. A one-page write-up that leads with the decision turns each of those results into a reason to keep testing.
- Watch for stall signals and restart deliberately. Falling velocity, cosmetic-only tests, results nobody uses and silence from the sponsor are the warning signs. A 30-day reset, built on one important question, one visible result and a fixed weekly rhythm, usually restarts the wheel.
Section 1 · The flywheel
Momentum comes from many small turns of a flywheel, not from one big result
Experimentation programme momentum is the self-reinforcing rhythm in which a team keeps launching, reading and acting on controlled experiments, so that each result makes the next test easier to fund, faster to build and more likely to be used. It shows up as a steady test velocity, a backlog people want to contribute to, and decisions that visibly change because of evidence.
Most teams start an experimentation programme with energy: a new tool, a sponsor, a backlog of ideas. Six months later, many have run a handful of tests, argued about two of them, and quietly gone back to shipping on opinion. The tool works. What is missing is momentum.
The best description of how momentum forms comes from practitioners who built testing in large organisations. Aleksander Fabijan and Benjamin Arai (Microsoft), Pavel Dmitriev (Outreach) and Lukas Vermeer (Booking.com) based their "A/B testing flywheel" on experience introducing and embedding A/B testing "in over two dozen product teams". Their point is that good-to-great transformations happen "in turns", not all at once. The goal is to "kickstart the flywheel" and then reach enough momentum "such that it continues to spin."
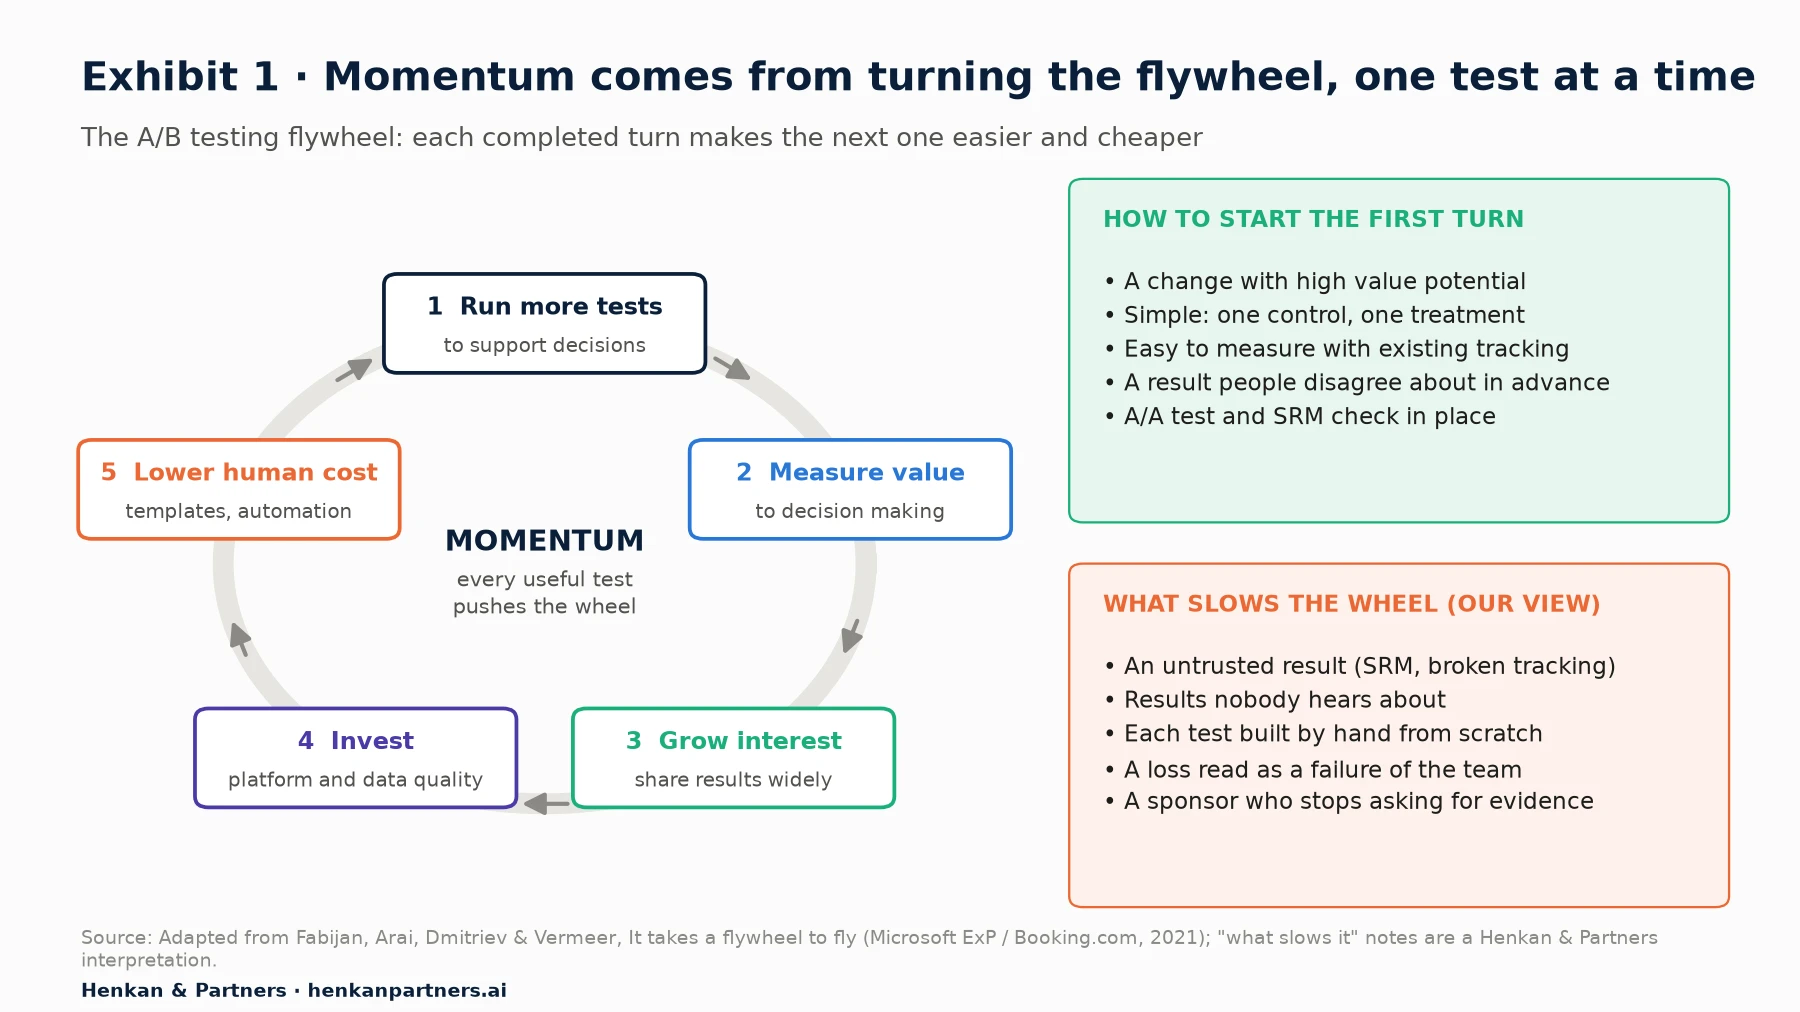
What this shows. Each step feeds the next: more tests produce more measured value, value creates interest, interest justifies investment, and investment lowers the cost of the next test. The authors warn that "every successful A/B test" pushes the flywheel forward "while every failure will slow or push it backward". In our reading, the failures that hurt most are tests that could not be trusted or used, not tests whose variant simply lost.
Two lessons follow for anyone starting or rescuing a programme. First, the early turns matter disproportionately. The authors note that "initial success may quickly propel the A/B testing program forward, while failure may stop the program." Second, the step teams most often skip is the last one. "Lowering the cost of A/B testing is a critical step in the flywheel that is often missed," they write. If every test is built by hand from scratch, the wheel stops when the first enthusiast gets busy.
This article is the third in our learning path on experimentation culture. If you are still finding a sponsor and champions, start with where to start: champions, sponsor and rituals. For the broader picture of what a test-and-learn culture looks like, read how to build a culture of experimentation.
Our view. Momentum is a leading indicator; impact is a lagging one. A programme that runs one trustworthy test a week, every week, will find its big wins. A programme that waits for the perfect test usually runs out of patience first.
Section 2 · Progress over perfection
Early on, consistency beats rigour, but never compromise on trust
Teams new to testing often believe that each experiment must be perfect before it launches: the ideal hypothesis, the full metric suite, the most sophisticated statistics. That standard is admirable and fatal. It slows the first tests to a crawl, and a programme with three tests a year has no rhythm to protect.
The flywheel authors recommend the opposite for the first turn: pick a change with "potential for high impact", keep it a "simple A/B test with 1 treatment and 1 control", and measure it with existing instrumentation rather than building new data pipelines. That is progress over perfection. But they pair it with two investments from day one: A/A tests, which compare two identical versions to check the setup, and sample ratio mismatch detection.
The non-negotiables: what you must never relax
Some shortcuts cost you a little precision. Others cost you the truth. The difference matters because an untrusted result does more damage to momentum than no result at all. Twyman's law, quoted by Ron Kohavi and colleagues, is the right instinct: "any figure that looks interesting or different is usually wrong."
Sample ratio mismatch is the clearest example. An SRM occurs when the split of users between control and variant differs significantly from the split you configured. Microsoft's experimentation team reports that "about 6% of A/B tests have an SRM", and that LinkedIn found about 10% of its zoomed-in tests used to suffer from this bias. Their advice is blunt: do not trust the results of a test with an SRM until you find the root cause.
| Area | Acceptable shortcut early on | Never compromise |
|---|---|---|
| Hypothesis | A short problem statement and expected effect, not a full research brief | Writing down the primary metric and decision rule before launch |
| Design | One control, one variant, one page | Random assignment and a stable split (check for SRM) |
| Metrics | One primary metric plus two or three guardrails | Guardrails on revenue, errors or speed for anything that could hurt customers |
| Statistics | A standard fixed-horizon test with a pre-calculated sample size | No peeking and stopping on the first significant day |
| QA | A short checklist on the main browsers and devices | Checking that tracking fires in both versions before launch |
| Documentation | A one-page result write-up | Recording every test, including losers and invalid ones |
The detailed checks live in our A/B test QA checklist, our guide to sample size and duration and our list of A/B testing mistakes that fake a result. The point here is about sequencing: get the trust basics right once, automate them, and then stop polishing every other detail.
For marketers. It is fine if your first tests are simple. It is not fine if the traffic split is broken or the conversion event fires only in one variant. Ask for an SRM check on every result you present.
For leaders. Do not ask the team for perfect tests. Ask for a steady rhythm and a short list of checks that are never skipped. That combination protects both speed and credibility.
Section 3 · Why volume matters
Most tests lose and a few win big, so volume is how you find the winners
Momentum matters more in experimentation than in most activities because the outcome of any single test is close to a coin toss, and usually a loaded one. Published success rates for experiments, compiled by Kohavi, Deng and Vermeer, range from 33% at Microsoft to 15% at Bing, about 10% at Booking.com, Google Ads and Netflix, and 8% at Airbnb Search. In its analysis titled "Top 10 takeaways from running 127,000 experiments", Optimizely reports that only 12% of experiments produce a statistically significant improvement on the primary metric (vendor data).
The value is also concentrated. Eduardo Azevedo and colleagues analysed 1,450 experiments run at Bing and found that "the top 2% of ideas are responsible for 74.8% of the historical gains." When the distribution of ideas has such fat tails, their model recommends "lean experimentation": test more ideas, each with a smaller sample, rather than a few huge tests. In their simulation, testing 20% more ideas with the same resources increased productivity by about 17%.
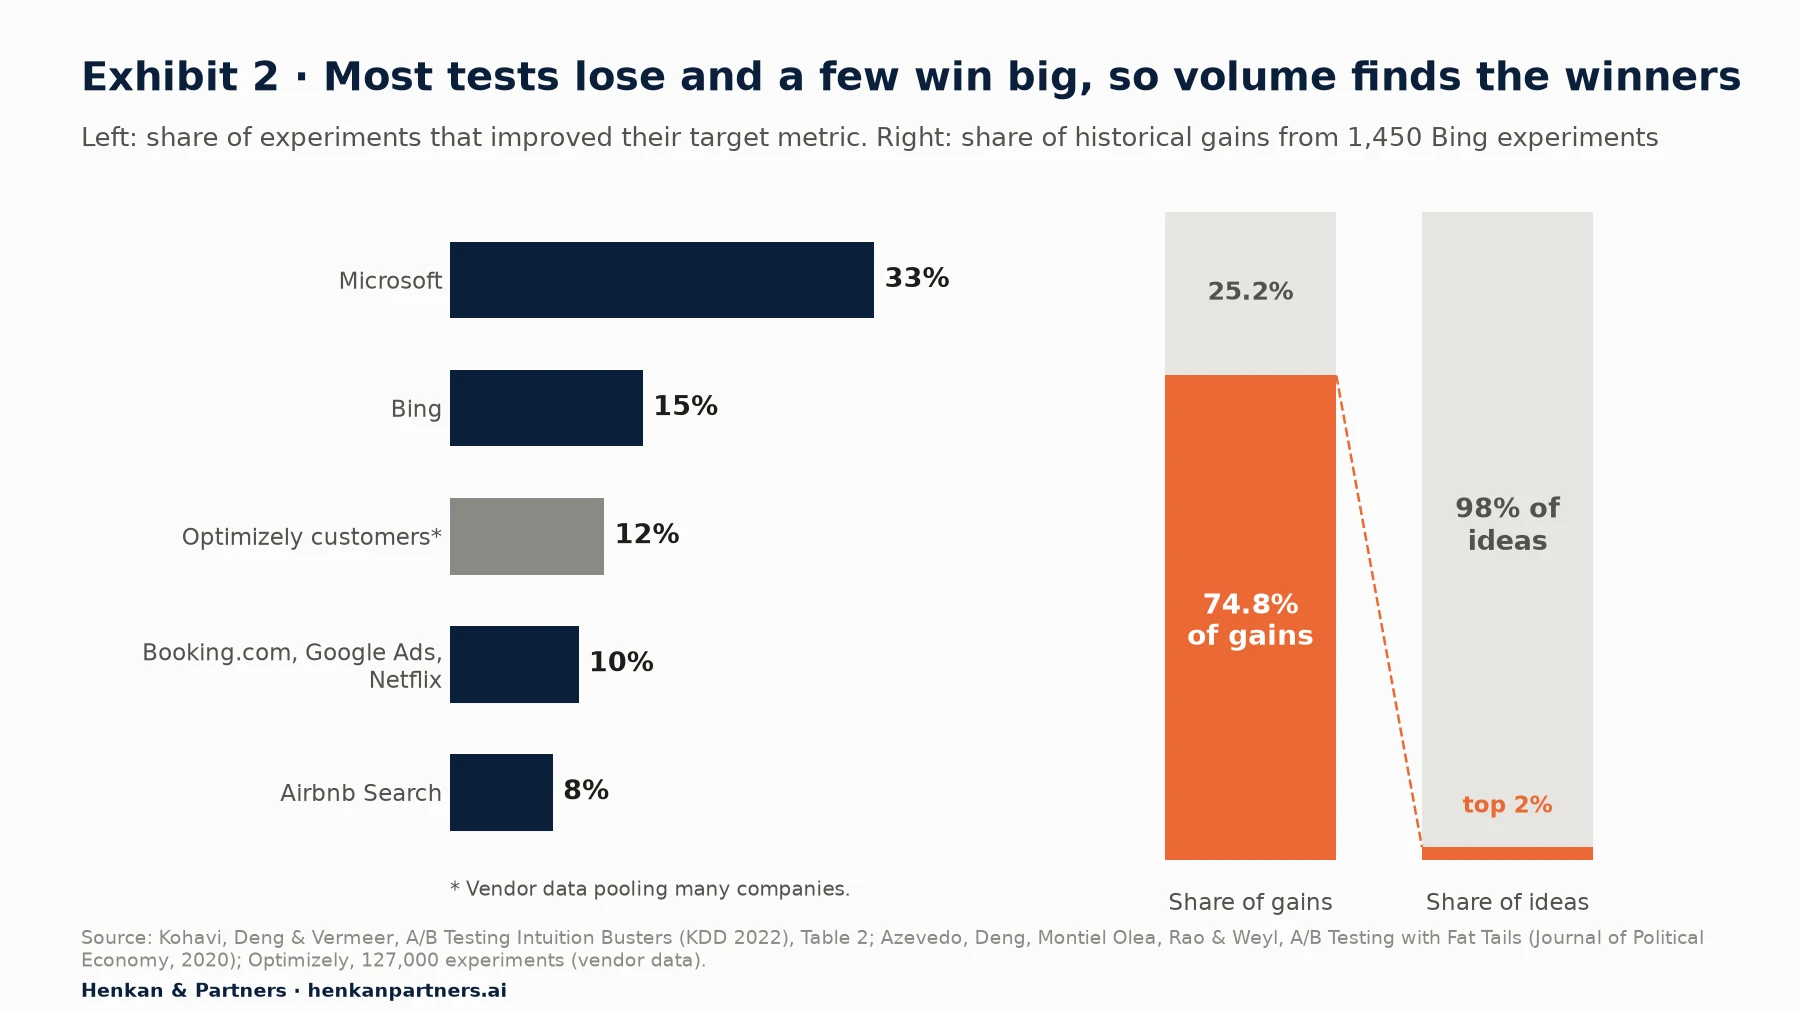
What this shows. If eight or nine tests out of ten do not win, and a handful of ideas produce most of the value, the programme that runs more good tests finds more of those rare winners. Velocity is not vanity here: it is the mechanism by which an experimentation programme captures the tail. The caveat is that this only holds for tests that are trusted and well chosen; more noise does not find more winners.
The Bing ad headline story, told by Kohavi and Stefan Thomke in Harvard Business Review, shows what a slow queue costs. The idea "was one of hundreds of ideas proposed, and the program managers deemed it a low priority". It "languished for more than six months". When it was finally tested, it increased revenue by 12%, worth more than $100 million a year in the United States alone. The same article describes how many small, tested improvements "collectively increased revenue per search by 10% to 25% each year." Momentum, not a single heroic test, produced that result.
Booking.com is the reference case for scale. Thomke reported in 2020 that the company ran "some 25,000 tests a year". Its own engineers wrote in 2017 that, on a daily basis, staff "run and analyse more than a thousand concurrent experiments". You do not need that scale. But you do need the habit that produced it. For the big-tech numbers in detail, see how Booking.com, Amazon, Microsoft and others experiment at scale.
Section 4 · Test velocity
Test velocity is the engine of momentum, and cycle time is where you raise it
Test velocity is the number of experiments a programme starts (or concludes) in a period, usually per month or per year. It is the most visible measure of momentum, and the easiest to benchmark. Optimizely's analysis of its customer base gives a useful reference: "The median company runs 34 experiments a year. The top 3% run over 500." To reach the top 10%, companies need to run around 200 tests a year (vendor data).
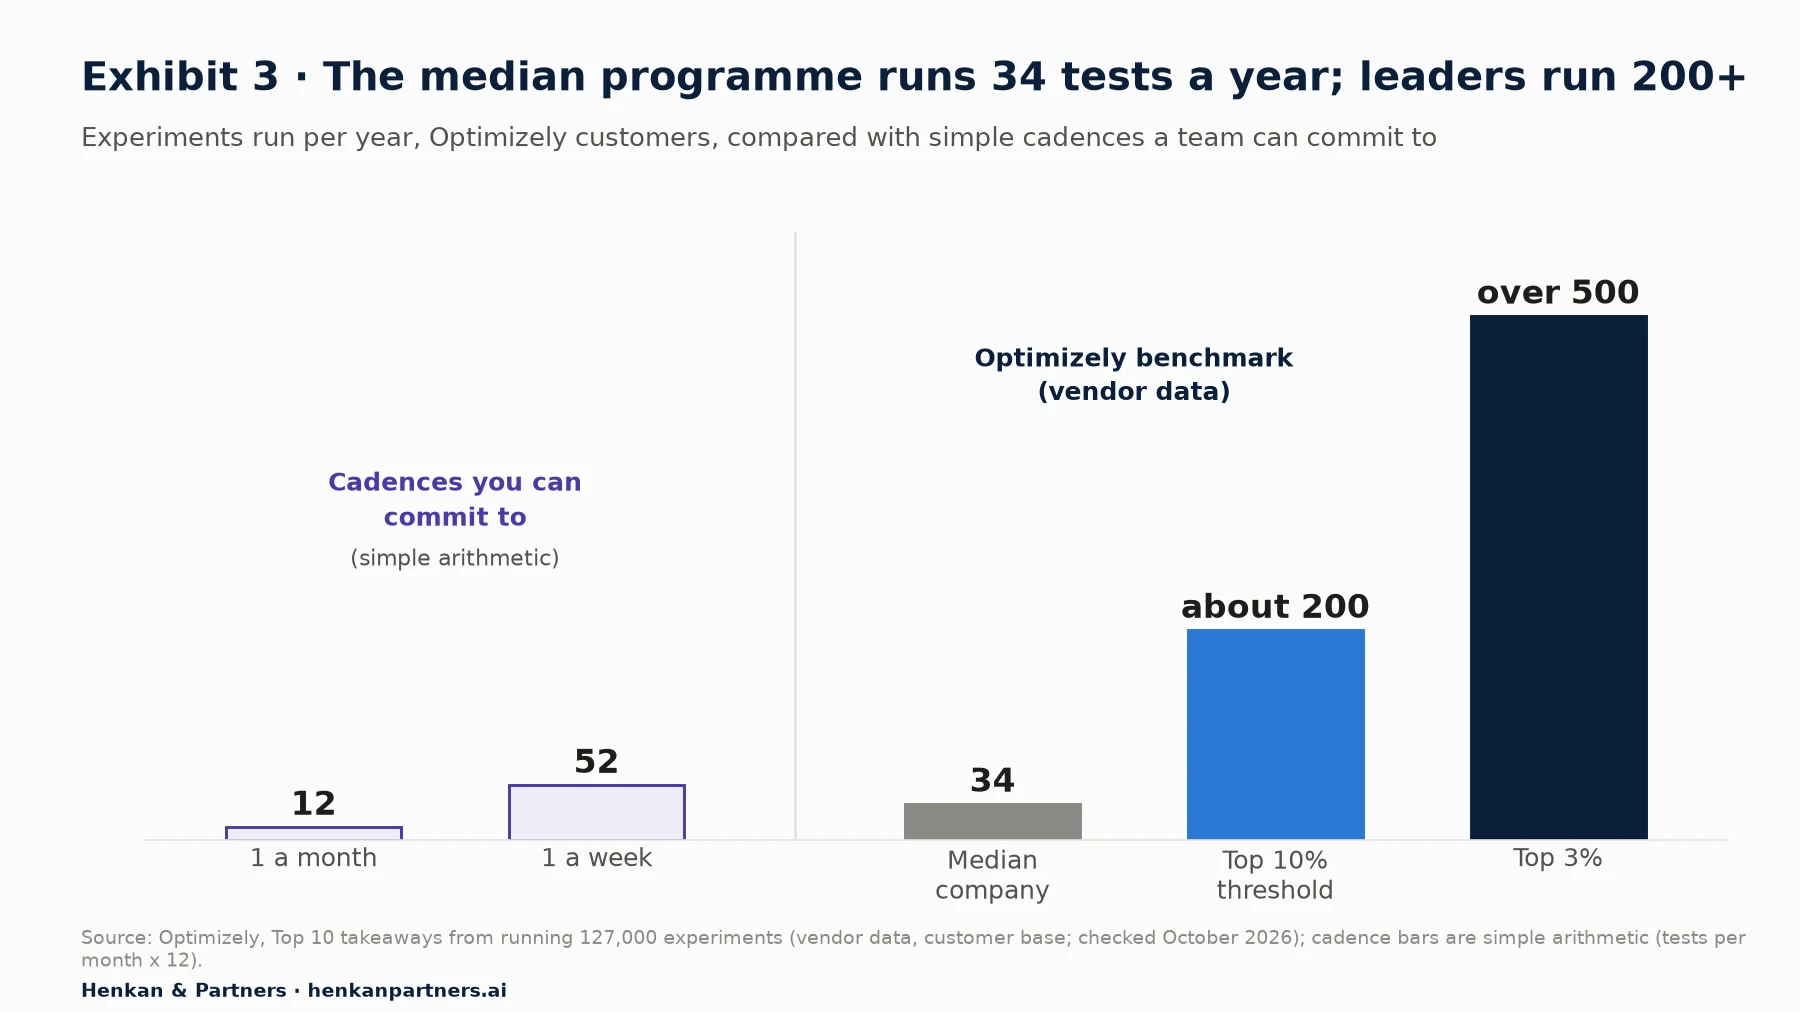
What this shows. The median of 34 tests a year is fewer than three a month. A team that commits to one trustworthy test a week already sits above that median. Leaders run roughly six to fifteen times more than the median, which usually reflects many teams testing in parallel on a shared platform rather than one heroic team.
Benchmarks are a reference, not a target. A site with limited traffic cannot run 200 meaningful tests a year, and a team that inflates velocity with trivial tests is fooling itself. The useful question is not "how many tests should we run?" but "what stops us from running the next good test sooner?" That question leads to cycle time.
Measure cycle time from idea to decision
Cycle time is the elapsed time from an approved idea to a decision based on the result. In our experience, most of it is waiting, not working: waiting for design, for a developer, for QA, for the analyst, for the meeting where the decision is taken. The run time of the test itself, which is fixed by traffic and the effect you want to detect, is often less than half of the total.
| Stage | Typical (illustrative) | After fixes (illustrative) | Main lever |
|---|---|---|---|
| Idea to brief | 10 days | 3 days | A one-page brief template and a weekly intake slot |
| Design and build | 12 days | 5 days | Reusable components; prompt-based or visual editors for simple changes |
| QA | 5 days | 2 days | A standard checklist; QA booked when the build starts |
| Run time | 21 days | 21 days | Fixed by traffic and effect size; do not cut it |
| Analysis and write-up | 6 days | 2 days | A result template with automated SRM and guardrail checks |
| Decision | 8 days | 2 days | A standing weekly review where results are decided, not just presented |
| Total | 62 days | 35 days | About 44% shorter without touching the statistics |
In the illustrative example, the team does not shorten the test at all. It removes waiting. With the same people, cycle time falls from about two months to five weeks, and because several tests can sit in different stages at once, each freed week becomes room for another test.
Six levers that raise velocity without lowering quality
- Keep a ready backlog. At least four or five briefed, prioritised ideas should be waiting at any time, so a free slot never sits empty. Our guide to turning customer insight into a test backlog covers how.
- Run tests in parallel on different pages or audiences. In our experience, interactions between concurrent tests on different pages are rarely the problem; idle traffic is the bigger cost.
- Test more variants per problem when traffic allows. Optimizely reports that experiments with four variations deliver 3.5 times the expected impact of a typical A/B test (vendor data). More variants need more traffic, so this lever suits high-traffic pages.
- Template everything that repeats. Briefs, QA checklists, result one-pagers and decision logs. This is the "lower the human cost" step of the flywheel.
- Fix a weekly decision slot. Results that wait for a monthly committee add weeks to every test.
- Automate the trust checks. SRM alerts, guardrail monitoring and data-quality checks should run without anyone having to remember them.
AI can raise velocity, but it does not remove judgement
The most visible change of the past two years is the use of AI to build test variations from a prompt. Kameleoon reports a 97% reduction in the time needed to create tests across more than 1,000 prompt-based experiments on 48 websites, against a baseline of three developer days per test (vendor data). Optimizely says that, inside its platform, 19.54% of follow-up tests are now driven by recommendations from its Opal AI agent grounded in prior results (vendor data).
Our own tests are more cautious. In what 19 prompt-built tests tell us, prompting cut build time by about 89% on average, but five of the 19 builds scored below 70% fidelity, so AI-built variants need a stricter launch process, not a looser one. AI agents can also draft briefs, summarise results and search past tests, as we describe in AI agents in experimentation. The risk is that faster building produces more low-value tests. Speed helps momentum only if the backlog is good and the trust checks keep up.
Section 5 · Portfolio
Run a portfolio of quick wins and big bets, and shift the mix as trust grows
A queue of tests treated one by one tends to drift towards whatever is easiest to build. A portfolio is a deliberate split of your testing capacity across types of tests with different costs, risks and pay-offs. It protects momentum, because quick wins keep results flowing, and it protects ambition, because a share of slots is reserved for ideas that could change the business.
Jeff Bezos put the logic of big bets in his 2015 letter to Amazon shareholders: "Given a ten percent chance of a 100 times payoff, you should take that bet every time." In the same letter he wrote that "failure and invention are inseparable twins." An e-commerce team does not need Amazon's appetite for risk, but it does need some bets whose outcome is genuinely uncertain. Optimizely's data points the same way: "experiments combining three or more change types deliver the strongest gains" (vendor data).
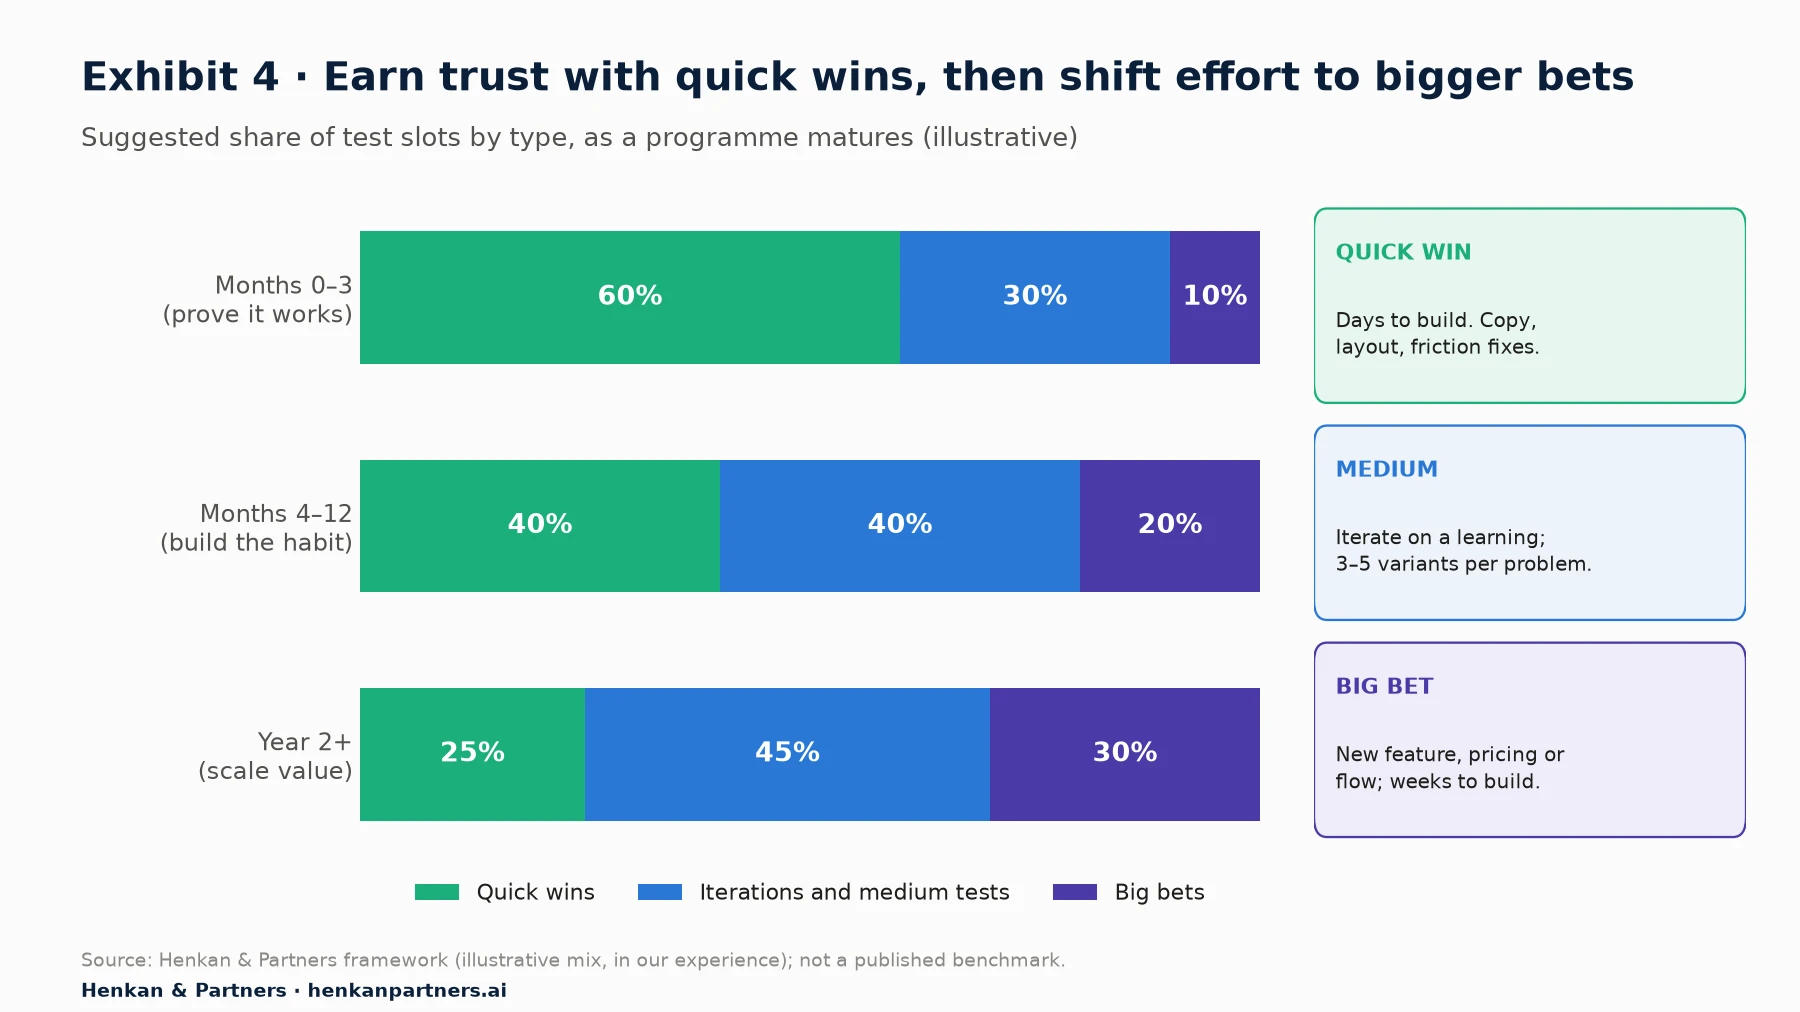
What this shows. In the first quarter, most slots go to quick, cheap tests whose job is to prove that the process works and that results are trusted. As the team earns credibility, capacity shifts towards iterations on what has been learned and towards bigger bets. The exact percentages matter less than the habit of deciding the mix on purpose and reviewing it each quarter.
| Type | What it looks like | Build effort | Why it matters for momentum |
|---|---|---|---|
| Quick win | Clarify delivery costs, fix a confusing form field, reorder product page content | Hours to a few days | Keeps results flowing and proves the process works |
| Iteration | A follow-up to a previous learning, with three to five variants on the same problem | Days | Turns a single result into a line of learning; compounds value |
| Big bet | A new checkout flow, a pricing or delivery-promise change, a new recommendation strategy | Weeks; often needs product and engineering | Where the fat-tail winners usually hide; shows the programme can influence strategy |
Two warnings. A portfolio of only quick wins will stall, because people stop caring about button tests within a year. A portfolio of only big bets will also stall, because results arrive too rarely to keep anyone's attention. The flywheel needs both a steady beat and the occasional result that changes a strategic decision.
For leaders. Ask the team to show you the portfolio mix each quarter. If more than about two-thirds of tests are cosmetic after the first six months, the programme is optimising what is easy rather than what matters.
Section 6 · Celebrating losses
A test that stopped a bad change saved money, so celebrate it like a win
The fastest way to kill momentum is to treat a losing test as a wasted one. If people are judged on wins, and most tests do not win, most people look bad most of the time. They react by running safer tests, stopping early when a result looks good, or presenting a flat result as "directionally positive".
Spotify has published the clearest alternative. Its data scientists define an "Experiment with Learning" as one that "produces valid and decision-ready results": a win, a regression detected, or a neutral result from a test strong enough to detect an effect. Across Spotify's research and development, the learning rate averaged 64%, while the win rate was 12% in the two units that run about 80% of its experiments. In a separate 2026 post, Spotify reports that 42% of its experiments end with the team deciding not to ship after guardrail metrics detect problems, and argues that this stops product regressions from reaching its users.
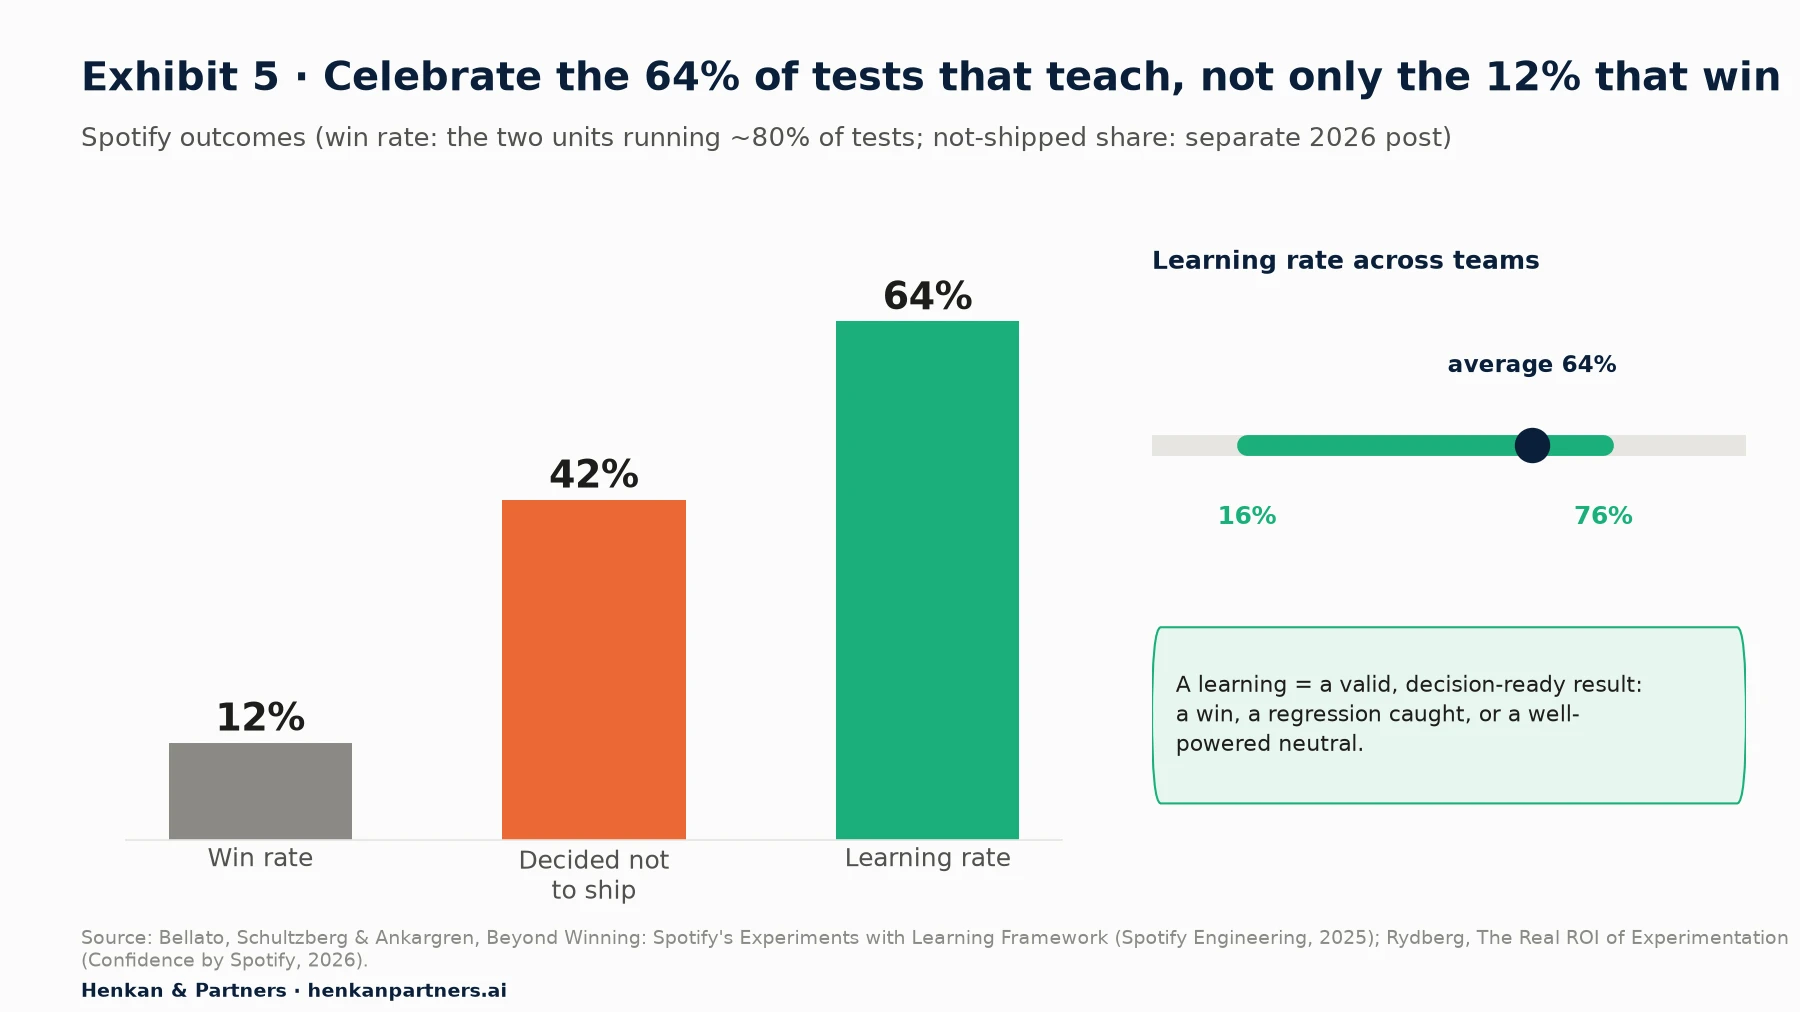
What this shows. Measured by wins, Spotify's programme looks like it fails nearly nine times in ten. Measured by learning, almost two-thirds of tests produce a decision the company can act on. The spread from 16% to 76% across teams also shows that learning rate is something a team can improve, mainly by running well-powered, valid tests.
How to put a number on a loss
Celebrating a loss is easier when you can show what it saved. The simplest estimate multiplies the revenue exposed to the change by the negative effect measured and the time the change would otherwise have stayed live.
Loss avoided (per month) = revenue exposed per month x measured negative effect
Illustrative: EUR 2,000,000 x 1.5% = EUR 30,000 per month not lost
Over six months before anyone would have noticed: about EUR 180,000
Treat this as an order of magnitude, not an accounting figure: the measured effect has a confidence interval, and some bad changes would have been caught another way. The calculation of programme value, including losses avoided, is covered in depth in our article on experimentation ROI. The cultural point is simpler. Kohavi and Thomke describe a Bing integration with social media that "cost Microsoft more than $25 million to develop and produced negligible increases in engagement and revenue." Every programme has the chance to stop the next one of those early.
Make losses visible and safe
- Open the monthly review with the best loss, not the best win: the test that taught the most or stopped the most expensive mistake.
- Report a learning rate alongside the win rate in every programme update, using a definition like Spotify's.
- Credit the person who proposed a test that lost for the money it saved. Never name a loser as a failure in public.
- Write the learning, not just the verdict. "Customers did not value the size guide because returns are free" is reusable; "Variant B lost" is not.
Section 7 · Storytelling
Results only build momentum if people read them, so write each one as a one-page story
A result nobody reads cannot change a decision, and a result that changes no decision does not turn the flywheel. Yet most test reports are written for analysts: tables of metrics, p-values, segment cuts. Executives skim the first line, see "not significant" and move on. The fix is a short, consistent format that leads with the decision.
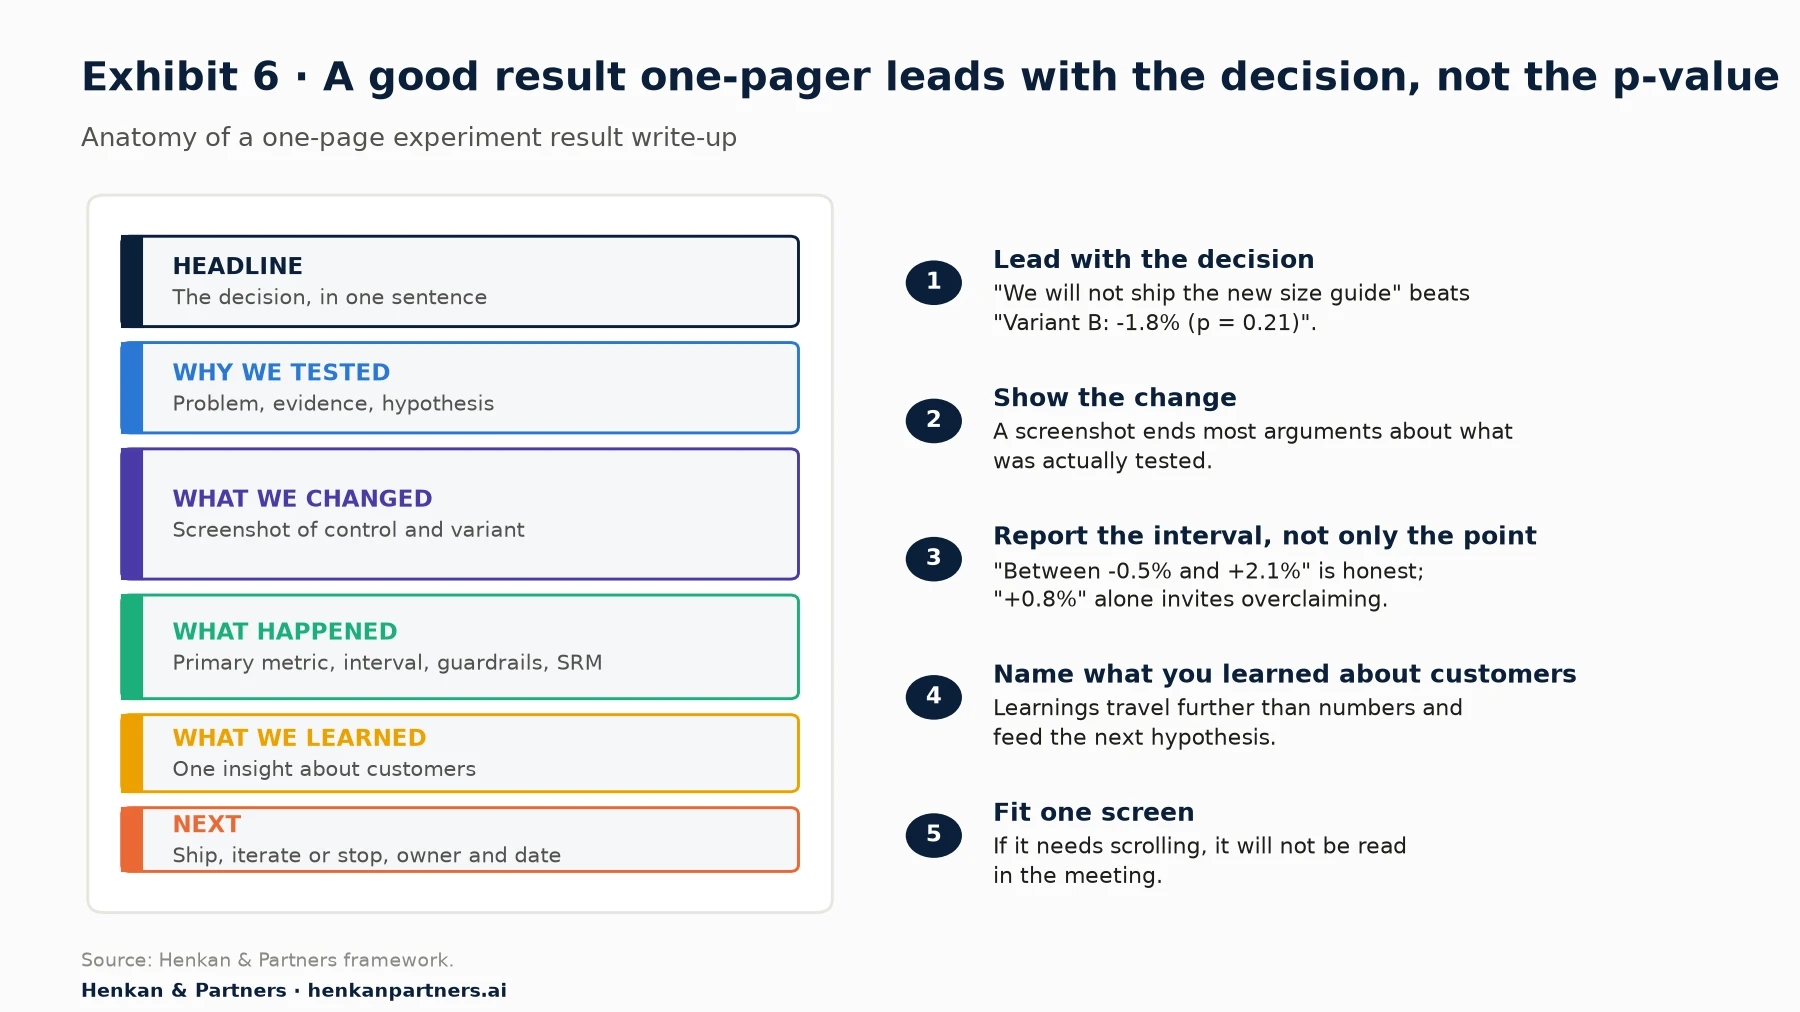
What this shows. The order follows the questions a busy reader asks: what did we decide, why did we test, what did customers see, what happened, what did we learn and what happens next. The statistics are there, including the interval and the SRM check, but they support the story rather than lead it.
Five rules for a result one-pager
- Lead with the decision. "We will not roll out the new size guide; we will test a shorter version on mobile next" is a headline. "Variant B: -1.8%" is a data point.
- Show the change. Screenshots of control and variant end most arguments about what was actually tested.
- Report a range, not just a number. "Between -0.5% and +2.1%" is honest; "+0.8%" on its own invites overclaiming. Remember Twyman's law when a result looks too good.
- Name one thing you learned about customers. Learnings travel further than numbers and feed the next hypothesis.
- Make it findable. Every one-pager goes into a searchable library. Booking.com describes its experiment platform as "a searchable repository of all the previous successes and failures, dating back to the very first experiment."
Distribution matters as much as format. A short fortnightly or monthly digest, a two-minute slot in an existing leadership meeting, and a channel where every result is posted all keep results in front of people. The flywheel step "grow interest" depends on it: in the authors' words, when results from one team's tests "are shared broadly, this can lead to interest" from new teams. For how to pitch the same result to finance, design or engineering, see how to talk about experimentation to every stakeholder.
For marketers. Write the headline of the one-pager before the test launches, with a blank for the result: "If the variant wins, we will ... If it loses, we will ...". It forces a decision rule and makes the write-up take minutes, not days.
Section 8 · HiPPO pressure
Handle HiPPO pressure and "the test lost, so it was useless" with rules agreed in advance
Momentum is most fragile when a result contradicts someone senior. Ron Kohavi and colleagues put the problem in the title of a 2007 paper: "Listen to Your Customers not to the HiPPO", the highest paid person's opinion. The same paper describes Amazon's culture "where data trumps intuition" and notes that "failing fast and knowing that an idea is not as great as was previously thought helps provide necessary course adjustments."
You rarely win these moments in the meeting itself. You win them before the test starts, by agreeing the primary metric, the decision rule and what happens if the result is flat. Then the conversation after the test is about applying a rule everyone accepted, not about whose opinion is better.
| What you hear | What is behind it | A response that keeps momentum |
|---|---|---|
| "The test lost, so it was useless." | Wins are the only visible value | "It stopped a change that would have cost about EUR X a month, and we learned Y about customers. Here is the next test it suggests." |
| "Just ship it, I know it works." | Confidence plus time pressure | "Let's ship it as a test to 50% of traffic. If you are right, we roll out in three weeks with proof." |
| "The result must be wrong." | A surprise against intuition | "Possibly. Here are the trust checks: split, tracking, guardrails. If they pass, the result stands unless we retest." |
| "It's flat, so let's keep the new design anyway." | Sunk cost in a redesign | "Flat means no measurable benefit at this sample. Keep it only if it is cheaper to run or strategic, and say so explicitly." |
| "Testing slows us down." | Tests seen as an extra step | "The test runs while we build the next thing. A bad launch we have to roll back is slower." |
| "Only button colours get tested." | A portfolio stuck on quick wins | "Agreed. This quarter we are reserving 20% of slots for bigger bets. Which decision would you most like evidence on?" |
The last answer matters most. The best way to neutralise HiPPO pressure is to recruit the HiPPO: invite senior leaders to submit their own ideas to the backlog, and test them like any other. The flywheel authors suggest early tests whose result is likely to be counterintuitive, where people disagree about the outcome. A leader who sees their own idea tested fairly, whatever the result, often becomes the programme's strongest supporter. Our stakeholder communication guide covers objections in more depth.
Section 9 · Stall signals
Spot a stalling programme early: six signals, and the gaps that cause them
Programmes rarely announce that they are stalling. They drift. The test count drops a little each month, the backlog fills with small cosmetic ideas, the sponsor stops asking for the digest. By the time anyone notices, the champion has moved on and restarting feels like starting over.
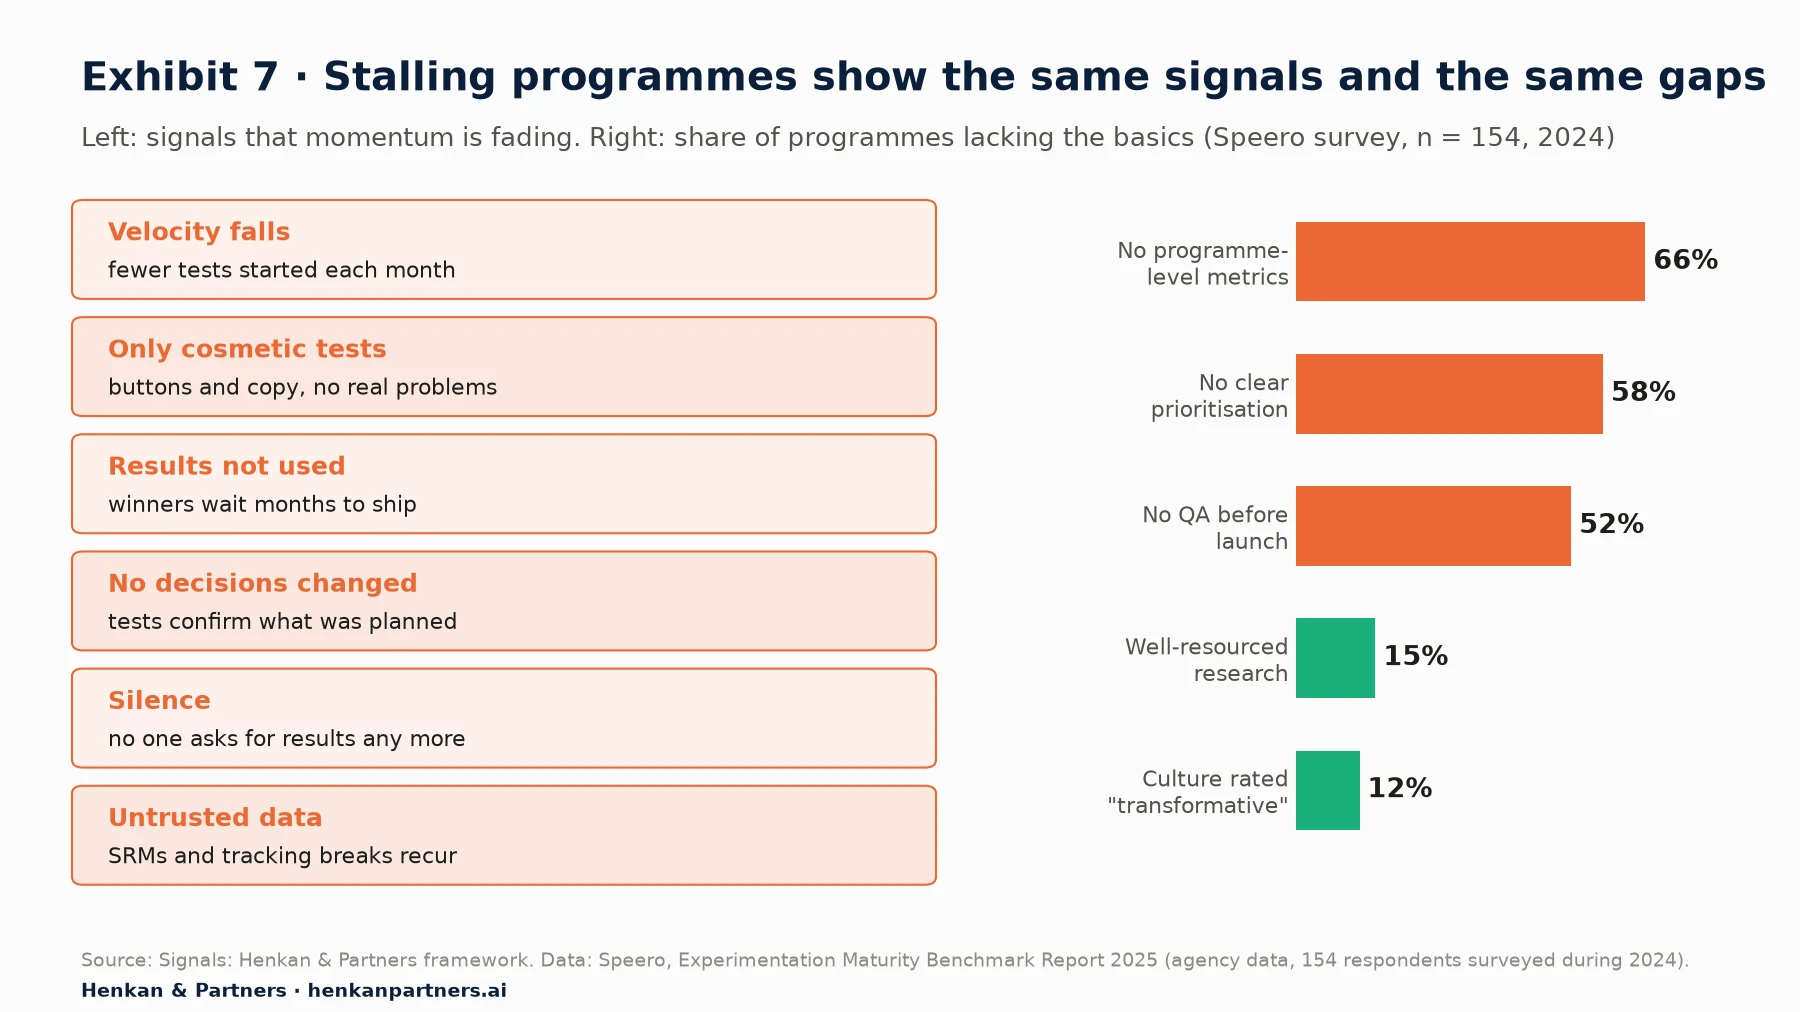
What this shows. The signals on the left are symptoms; the gaps on the right are common causes. Two-thirds of programmes in Speero's sample had no programme-level metrics, so they could not see velocity dropping. More than half did not QA tests before launch, which makes untrusted results likely. Few rated their culture as transformative.
| Signal | How to spot it | Likely cause | First fix |
|---|---|---|---|
| Velocity falls | Tests started per month down for two months in a row | Empty backlog, a bottleneck in build or QA | Map cycle time; refill the backlog to five briefed ideas |
| Only cosmetic tests | Most tests change copy, colour or layout on one element | No research input; fear of bigger changes | Reserve slots for iterations and big bets; run a research sprint |
| Results not used | Winners wait more than a month to ship | No owner for implementation; developer capacity | Name an owner and date in every one-pager |
| No decisions changed | Tests confirm plans already made | Testing used as validation, not decision making | Test before the decision is taken; agree decision rules up front |
| Silence | Digest unread; sponsor no longer asks | Results not translated into business language | Rewrite results as one-pagers; restore a monthly leadership slot |
| Untrusted data | SRMs, broken tracking or disputed results recur | No QA or automated checks | Pause new launches for one week; fix checks; rerun the last disputed test |
How to restart a stalled programme in 30 days
- Week 1: diagnose. Count tests started per month for the last six months, map cycle time for the last five tests, and list results that were never implemented.
- Week 1: fix trust. Check SRM and tracking on recent tests. If anything is broken, fix it before launching more.
- Week 2: pick one important question. Ask the sponsor which decision they most want evidence on this quarter, and design a test around it.
- Weeks 2 to 3: restore the rhythm. Reinstate one weekly review of 30 minutes and one monthly results slot with leadership. Fill the backlog with five briefed ideas.
- Week 4: tell the story. Publish a one-pager for every result, including the losses, and a short note on what changed in the programme.
Measuring the health of the programme over time, with velocity, learning rate and decision metrics, is the subject of the sixth article in this path: how to measure an experimentation culture. If the stall comes from unclear ownership, the fifth, on choosing an operating model, will help.
Our view. Most stalled programmes we audit do not lack ideas or tools. They lack a fixed weekly rhythm and someone whose job is to keep it. Restore the rhythm first; everything else is easier once results are flowing again.
Disclosure: Henkan & Partners runs experimentation programmes and fractional experimentation teams for clients, and partners with several testing vendors, including some cited in this article.
Section 10 · What to do next
What to do next: five steps to build experimentation programme momentum
1. Set a cadence you can keep
Commit to a rhythm you can sustain for a year, such as one trustworthy test a week or two a month, and protect it. A fixed weekly review where results are decided is the single most useful ritual.
2. Automate the trust checks
Put SRM detection, guardrail alerts and a QA checklist in place once, so that no test depends on someone remembering them. Then stop polishing the rest.
3. Map and cut your cycle time
Measure the time from approved idea to decision for your last five tests. Remove waiting first: templates, booked QA and a fixed decision slot usually cut weeks without touching the statistics.
4. Decide your portfolio mix
Agree the share of quick wins, iterations and big bets for this quarter, and review it every quarter. Report a learning rate next to the win rate, and open each monthly review with the most useful loss.
5. Write every result as a one-pager, and ask for help if you need it
Use the one-page format in Exhibit 6 for every test and store it in a searchable library. To get started faster, download the Experimentation Culture Kit: a one-page charter, ritual agendas, stakeholder map, objection cards, RACI, health scorecard and maturity self-assessment. If you want an outside view on why your programme has stalled, or a team to restart it with you, talk to us.
FAQ
Frequently asked questions about experimentation programme momentum
Frequently asked questions
What is experimentation programme momentum?
It is the self-reinforcing rhythm in which a team keeps launching, reading and acting on controlled experiments, so each result makes the next test easier to fund, build and use. You can see it in steady test velocity, a healthy backlog and decisions that change because of evidence.
How many A/B tests should we run per month?
There is no universal number; it depends on traffic and team size. As a reference, Optimizely reports that the median company runs 34 experiments a year, fewer than three a month, and the top 10% run about 200 (vendor data). A sustainable cadence of one trustworthy test a week is a good first goal for many e-commerce teams.
How do you increase A/B test velocity?
Cut cycle time rather than test duration. Keep a ready backlog, template briefs and result write-ups, book QA early, run tests in parallel on different pages, use visual or prompt-based editors for simple changes, and hold a weekly decision slot so results do not wait.
Is it better to run many small tests or a few big ones?
Usually a mix. Research on 1,450 Bing experiments found that the top 2% of ideas produced 74.8% of the gains, which favours testing many ideas. But a portfolio of only small cosmetic tests stalls. Reserve a growing share of slots for bigger bets as the programme earns trust.
What should we do when an A/B test loses?
Treat it as a result. Check that it is valid (no sample ratio mismatch, tracking working), estimate the loss it avoided, write down what it taught you about customers, and decide the next test. At Spotify, 42% of experiments end with a decision not to ship.
How do you build momentum in an experimentation programme from scratch?
Start the flywheel with a simple, valuable test that is easy to measure and that people disagree about, put A/A and SRM checks in place, share the result widely, and then lower the cost of the next test with templates. Our companion article on champions, sponsors and rituals covers the first steps.
What are the signs an experimentation programme is stalling?
Falling velocity, tests that only change buttons and copy, winners that are never implemented, tests that never change a decision, a sponsor who stops asking for results, and recurring data problems such as SRMs or broken tracking.
How do you handle a HiPPO who wants to skip testing?
Agree decision rules before tests start, offer to ship the idea as a test to part of the traffic, and invite senior leaders to submit their own ideas to the backlog. A leader who sees their idea tested fairly often becomes the programme's strongest supporter.
What is a learning rate in experimentation?
Spotify defines it as the share of experiments that produce valid, decision-ready results: a win, a regression detected, or a well-powered neutral result. Spotify reports a 64% average learning rate, against a win rate of about 12% in the two units that run around 80% of its experiments, which makes it a fairer measure of a programme than wins alone.
Key terms
- A/B testing flywheel
- A model by Fabijan, Arai, Dmitriev and Vermeer in which running tests, measuring value, growing interest, investing and lowering cost reinforce each other. It matters because it explains why early turns and low cost per test decide whether a programme survives.
- Test velocity
- The number of experiments started or concluded in a period. It matters because, with low win rates, velocity is how a programme finds its rare large winners.
- Cycle time
- The elapsed time from an approved idea to a decision based on its test result. It matters because most of it is waiting, which can be cut without weakening the statistics.
- Win rate
- The share of experiments in which a variant significantly improves the primary metric. It matters as a reality check, but judged alone it discourages honest testing.
- Learning rate
- The share of experiments that produce valid, decision-ready results, including wins, detected regressions and well-powered neutral results. It matters because it rewards good tests rather than lucky ones.
- Sample ratio mismatch (SRM)
- A significant difference between the configured and observed split of users across variants. It matters because a test with an SRM cannot be trusted until the cause is found.
- A/A test
- A test comparing two identical experiences to check that the setup, split and metrics behave as expected. It matters because it catches platform problems before they distort real results.
- Twyman's law
- The principle that any figure that looks interesting or different is usually wrong. It matters because surprising results should trigger checks before celebration.
- Guardrail metric
- A metric that must not get worse, such as revenue, errors or page speed, monitored alongside the primary metric. It matters because it lets teams move fast without hurting customers.
- HiPPO
- The highest paid person's opinion, a term Kohavi and colleagues put in the title of their 2007 KDD paper. It matters because decisions by rank rather than evidence are the main cultural threat to momentum.
- Fat tails
- A distribution in which a few outcomes are very large, such as the top 2% of Bing ideas producing 74.8% of gains. It matters because it favours testing many ideas.
- Test portfolio
- A deliberate split of testing capacity across quick wins, iterations and big bets. It matters because it keeps results flowing while reserving room for ideas that could change the business.
- Result one-pager
- A one-page write-up of an experiment that leads with the decision and includes the change, result, learning and next step. It matters because results that are read are the ones that change decisions.
- Loss avoided
- The estimated revenue or margin a losing variant would have cost had it shipped without a test. It matters because it makes the value of losing tests visible.
Sources
All sources were checked in October 2026. Figures from Optimizely and Kameleoon are vendor data from their own customer bases; Speero's figures are agency data from its 2024 maturity survey (154 respondents). Exhibits 4 and 6, the stall signals in Exhibit 7, the "what slows the wheel" panel in Exhibit 1 and Tables 1 to 5 are Henkan & Partners frameworks; figures labelled illustrative are not benchmarks.
- Fabijan, A., Arai, B., Dmitriev, P. & Vermeer, L. (2021). It takes a flywheel to fly: Kickstarting and keeping the A/B testing momentum. Booking.com Product / Microsoft Experimentation Platform.
- Fabijan, A. et al., Microsoft Research (2020). Diagnosing Sample Ratio Mismatch in A/B Testing.
- Kohavi, R., Deng, A. & Vermeer, L. (2022). A/B Testing Intuition Busters. KDD 2022.
- Azevedo, E. M., Deng, A., Montiel Olea, J. L., Rao, J. & Weyl, E. G. (2020). A/B Testing with Fat Tails. Journal of Political Economy 128(12) (working-paper version linked).
- Kohavi, R. & Thomke, S., Harvard Business Review (2017). The Surprising Power of Online Experiments.
- Thomke, S., Harvard Business Review (2020). Building a Culture of Experimentation.
- Lopez Kaufman, R., Pitchforth, J. & Vermeer, L. (2017). Democratizing online controlled experiments at Booking.com. arXiv.
- Kohavi, R., Henne, R. M. & Sommerfield, D. (2007). Practical Guide to Controlled Experiments on the Web: Listen to Your Customers not to the HiPPO. KDD 2007.
- Optimizely (2026). Top 10 takeaways from running 127,000 experiments (vendor data).
- Bellato, M., Schultzberg, M. & Ankargren, S., Spotify Engineering (2025). Beyond Winning: Spotify's Experiments with Learning Framework.
- Rydberg, J., Confidence by Spotify (2026). The Real ROI of Experimentation.
- Bezos, J., Amazon (2016). 2015 Letter to Shareholders.
- Speero (2025). Experimentation Maturity Benchmark Report 2025 (agency data).
- De Todaro, F., Kameleoon (2025). What we learned from 1,000 prompt-based experiments (vendor data).
- Henkan & Partners. Frameworks and illustrative examples: Exhibits 1 (side panel), 4, 6 and 7 (signals); Tables 1 to 5; loss-avoided formula.