Focus
How Booking.com, Amazon, Microsoft, Google, Netflix and Airbnb Experiment at Scale (and What You Can Copy)
Alexandre Suon · 2026-10-01
Booking.com runs some 25,000 tests a year, LinkedIn serves up to 41,000 A/B tests at once and Bing runs more than 10,000 experiments a year. This focus explains how big tech does experimentation at scale, company by company, with the year of every figure, and separates the habits any e-commerce team can copy from the traffic and engineering it cannot.
Executive summary
- The leaders run experiments in the thousands, the typical company in the dozens. Booking.com runs about 25,000 tests a year (2020), Google ran 16,871 live-traffic experiments on Search in 2023 and Bing runs more than 10,000 a year (2020). The median Optimizely customer runs 34 (vendor data).
- Even they are wrong most of the time. Published success rates range from about 8% at Airbnb Search to about 33% at Microsoft, and around 10% at Booking.com, Google Ads and Netflix. Testing at scale exists because intuition fails at scale.
- Every one of them built a platform, and most rebuilt it. Microsoft's ExP (2006), Google's overlapping layers (2007), LinkedIn's XLNT, now T-REX, Airbnb's ERF (2014), Uber's XP and Spotify's ABBA then Confidence. Uber rebuilt because too many experiments had "fatal problems".
- Five traits matter more than traffic. Anyone can propose or launch a test within guardrails; a trusted platform; written metric definitions; a searchable memory of every test; and leaders who accept being proved wrong.
- Their traffic and machinery cannot be copied. Detecting a 1% change at a 5% conversion rate needs about 12 million users per test. A shop with 300,000 visitors a month should test bolder changes, buy its tool, and run fewer, better tests.
- Their habits can be copied tomorrow. Pre-launch checklists, a second reviewer, trained champions, a results library and leaders who test their own ideas cost little and work at any scale.
Section 1 · The scale
The leaders run thousands of experiments a year, while most companies run a few dozen
Experimentation at scale is the practice of testing most product, marketing and engineering changes with online controlled experiments (A/B tests) as a routine part of how a company works, rather than as an occasional project. It usually means hundreds or thousands of experiments a year, a shared platform, common metric definitions and many teams able to run tests.
When people say "big tech tests everything", they are mostly right. In their 2017 Harvard Business Review article, Ron Kohavi and Stefan Thomke wrote that Microsoft and several other leading companies, "including Amazon, Booking.com, Facebook, and Google", each "conduct more than 10,000 online controlled experiments annually." The 2020 textbook by Kohavi, Diane Tang and Ya Xu, Trustworthy Online Controlled Experiments, says that companies such as Airbnb, Amazon, Booking.com, eBay, Facebook, Google, LinkedIn, Lyft, Microsoft, Netflix, Twitter, Uber, Yahoo and Yandex "run thousands to tens of thousands of experiments every year."
Scale figures change quickly and companies count differently. Some report experiments per year, others experiments running at the same moment, and LinkedIn counts every A/B test its platform serves. So every figure below carries its year, and the two kinds of count are kept apart.
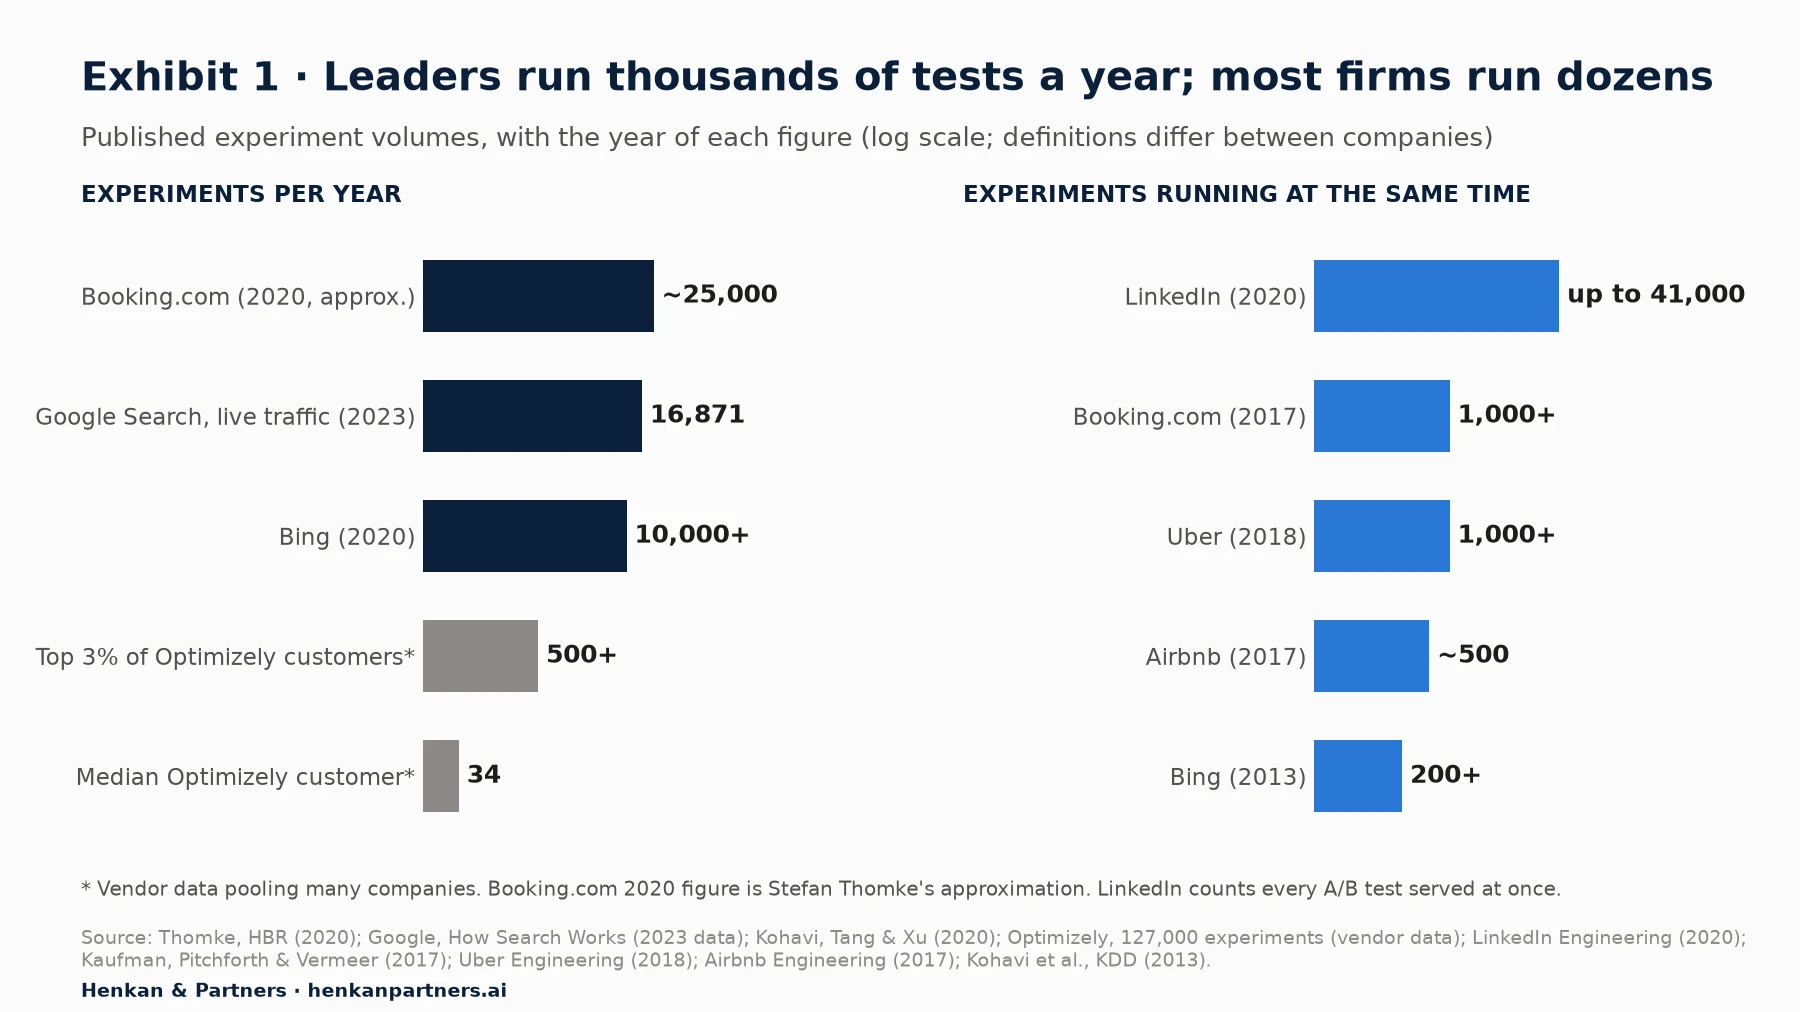
What this shows. The gap between the leaders and a typical company is two to three orders of magnitude. It is not a target: these companies have hundreds of millions of users and dedicated platform teams. What matters is how they got there and which of their habits travel.
| Company | In-house platform | Published scale (year) | Who runs tests |
|---|---|---|---|
| Microsoft / Bing | Experimentation Platform (ExP), formed 2006 | Bing: 10,000+ a year (2020); 200+ concurrent (2013) | Product teams, supported by a central ExP team and data scientists |
| Booking.com | In-house experimentation tool and central repository | ~25,000 a year (2020); 1,000+ concurrent (2017) | "Anybody", without management permission (2019) |
| Overlapping experiment infrastructure (layers), live from 2007 | 16,871 live-traffic experiments on Search (2023) | Engineers, after an experiment council checklist | |
| LiX / XLNT, now T-REX | Up to 41,000 A/B tests at once (2020) | Product teams; metric definitions reviewed centrally (2014) | |
| Airbnb | Experimentation Reporting Framework (ERF), 2014 | ~500 concurrent (2017) | Product and data teams |
| Uber | XP, rebuilt in 2022 | 1,000+ concurrent (2018) | More than 2,000 developers moved to the new platform (2022) |
| Netflix | ABlaze front end, Ignite analysis (2016) | "Hundreds of product variants each year" (2022) | Every product change goes through an A/B test (2016) |
| Spotify | ABBA (2013), new platform (2020), Confidence (2023) | "Thousands of experiments per year" (by 2020, reported 2023) | Close to 300 teams (2022) |
If you are building the case for a programme rather than benchmarking one, our article on experimentation ROI covers the business case, and How to Build a Culture of Experimentation covers the general principles. This article is the first in the learning path Build a culture of experimentation: it shows what "good" looks like at the top, so that the next articles can show how to get there from where you are.
Section 2 · Microsoft and Bing
Microsoft showed that a small change can be worth $100 million, and that nobody can tell which one in advance
Microsoft is the best documented case, because the people who built its programme published a great deal. A 2009 paper by Kohavi and colleagues records that "in March 2006, the Experimentation Platform team (ExP) was formed as a small incubation project." Its early numbers were tiny: 2 experiments in fiscal year 2007, 8 in fiscal year 2008 and 44 in fiscal year 2009. By 2020, according to the Kohavi, Tang and Xu textbook, Bing alone ran "over 10,000 experiments a year".
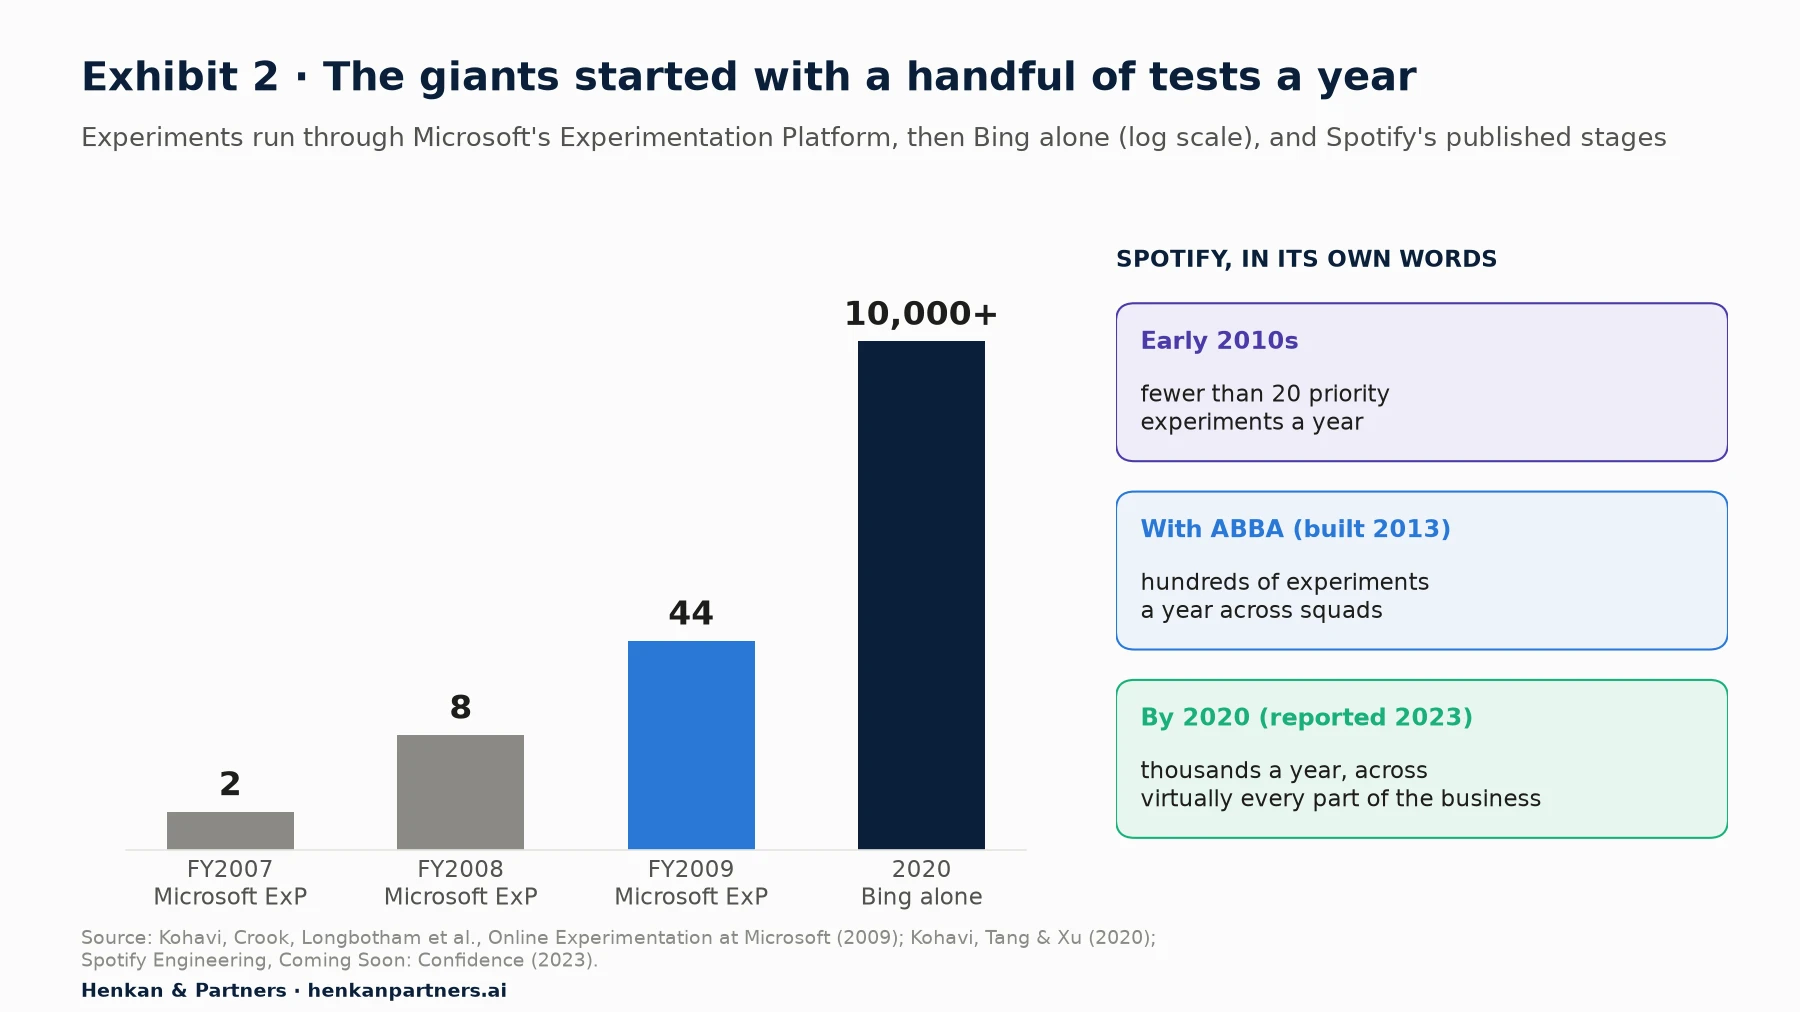
What this shows. Nobody starts at 10,000. Microsoft's platform ran two experiments in its first full year, and Spotify describes running "fewer than 20 priority experiments per year" in the early 2010s. The growth came from making tests cheaper and more trusted, one product at a time, not from a mandate on day one.
By 2013, Bing ran "over 200 experiments running concurrently", and users eligible for experimentation were "each rotated into over 15 concurrent experiments", according to a KDD paper by Kohavi and colleagues. At that time Bing distributed traffic from "about 100 million monthly users". Kohavi and Thomke reported in 2017 that "at Bing about 80% of proposed changes are first run as controlled experiments", and that the many small improvements "collectively increased revenue per search by 10% to 25% each year."
The headline test that waited six months
The most famous story comes from the same HBR article. An employee proposed changing the way Bing displayed ad headlines. The idea was judged low priority and "languished for more than six months". When an engineer finally ran a simple experiment, the change "increased revenue by an astonishing 12%", worth "more than $100 million in the United States alone" on an annual basis. The textbook adds the sobering part: "simple features resulting in such a big improvement happen only once every few years."
The opposite lesson matters just as much. Integrating Bing with social media "cost Microsoft more than $25 million to develop", the HBR authors write, and produced negligible gains. And in a test of an MSN Real Estate widget reported in the 2009 paper, "only three out of 21 people guessed the winner". The textbook turns this into a principle: an organisation that wants to run experiments must accept that it "is poor at assessing the value of ideas."
Organisationally, the 2019 summary of the first Practical Online Controlled Experiments Summit describes Microsoft as running a centre-of-excellence model: central data scientists transfer expertise to champions in product teams, and the company keeps a "monthly Introduction to Experimentation class and Experiment Analysis lab open to everyone." Our sibling article on choosing an operating model covers that choice in detail.
Section 3 · Booking.com
Booking.com shows what happens when anyone can launch, and anyone can stop, a test
Booking.com is the reference for democratised experimentation. In a 2017 paper, three of its data scientists, Raphael Lopez Kaufman, Jegar Pitchforth and Lukas Vermeer, wrote that "on a daily basis, all members of our departments run and analyse more than a thousand concurrent experiments", and that the company had been running online experiments "for more than ten years." Tests run "across all our products, from mobile apps and tools used by hoteliers to customer service phone lines and internal systems."
Harvard professor Stefan Thomke, who studied the company for his book Experimentation Works, wrote in HBR in 2020 that Booking.com runs "some 25,000 tests a year". In a 2019 HBR podcast he described the rule that defines its culture: "Anybody can launch an experiment without permission from management, but anybody in the company can also kill an experiment." He also reported how often teams are wrong when they predict customer behaviour: "about nine out of ten times".
Democratisation works because of the safeguards
Open access does not mean no rules. The 2017 paper lists the safeguards that make it safe to let anyone test:
- Pre-registration. Experiment owners "need to specify up front which customer behavior they want to impact", which stops them picking a winning metric after the fact.
- Real-time monitoring. The platform attributes the impact of every experiment on the business in real time, which in Booking.com's system "means less than a minute", so a harmful test is spotted and stopped fast.
- Automated statistical checks. Checks detect problems such as selective attrition, where visitors drop out of one variant more than the other, and a warning is displayed on the report itself.
- A central repository. A "searchable repository of all the previous successes and failures, dating back to the very first experiment", grouped by team, product area and visitor segment.
- Human support. The 2019 summit paper describes Booking.com's "Experimentation Ambassadors", experienced staff who give first-line support, and a peer-review programme that awards "badges to encourage the adoption of good practices."
Our view. Booking.com is often quoted for its volume. The more useful lesson is the order of events: safeguards, a shared tool and a searchable memory came first, and the freedom to launch followed. Copy the freedom without the safeguards and you get many tests nobody trusts. Our Experimentation Manifesto sets out the values behind democratisation.
Section 4 · Google and Amazon
Google and Amazon made testing routine by building infrastructure and review habits, not by adding approvals
Google: overlapping layers and an experiment council
Google's 2010 KDD paper on its experiment infrastructure opens with a sentence that sums up the culture: "At Google, experimentation is practically a mantra; we evaluate almost every change that potentially affects what our users experience." The authors, Diane Tang, Ashish Agarwal, Deirdre O'Brien and Mike Meyer, describe how Google split its system parameters into layers, so that one user can be in several experiments at once, one per layer, without the experiments interfering. After the overlapping infrastructure went live in March 2007, Google saw "nearly an order of magnitude more experiments". The exact counts were not published.
The same paper describes the human side. Before running an experiment, engineers complete a lightweight checklist, reviewed by an "experiment council" of experts, covering what the experiment is for, how traffic is split, how big it must be and how it will be analysed.
Google's most recent public figures come from its How Search Works site. In 2023 it ran "16,871 live traffic experiments", "124,942 side-by-side experiments" and "719,326 search quality tests", which led to "4,781 launches". Only the first number counts A/B tests on real users.
The 41 shades of blue, and what the story really says
The most repeated Google anecdote comes from a 2009 blog post by designer Doug Bowman, written as he left the company: "a team at Google couldn't decide between two blues, so they're testing 41 shades between each blue to see which one performs better." He also recalled a debate "over whether a border should be 3, 4 or 5 pixels wide", in which he "was asked to prove my case." A revenue figure for the colour test circulates widely online; we could not trace it to a primary source we could open, so we leave it out.
Bowman told the story as a criticism, and it is a fair warning. Testing tiny visual tweaks only makes sense with Google-level traffic, and even there it can crowd out design judgement. For most e-commerce sites it is the wrong lesson to copy.
Amazon: two-way doors and Weblab Bar Raisers
Amazon publishes few numbers about its experimentation platform, Weblab, so we do not quote any volume figure. What it has published is the philosophy. In the 2015 shareholder letter, Jeff Bezos wrote that "failure and invention are inseparable twins. To invent you have to experiment, and if you know in advance that it's going to work, it's not an experiment." He separated irreversible decisions, "one-way doors", from reversible ones, which "can and should be made quickly by high judgment individuals or small groups". Most website changes are reversible, which is why they suit testing.
The 2019 summit paper describes one Amazon practice worth copying. In 2013, its personalisation team piloted "Weblab Bar Raisers": experienced experimenters "with an ability to teach and influence" who spend "about 2–4 hours per week" reviewing and supporting other teams' experiments. It is a small, cheap way to spread quality without a central gate.
Section 5 · Platforms
From LinkedIn to Spotify, every platform followed the same path: build, standardise, then rebuild for trust
The other well-documented companies tell the same story with different names. Each built its own platform when commercial tools could not cope with its scale, then rebuilt it when volume or trust problems appeared.
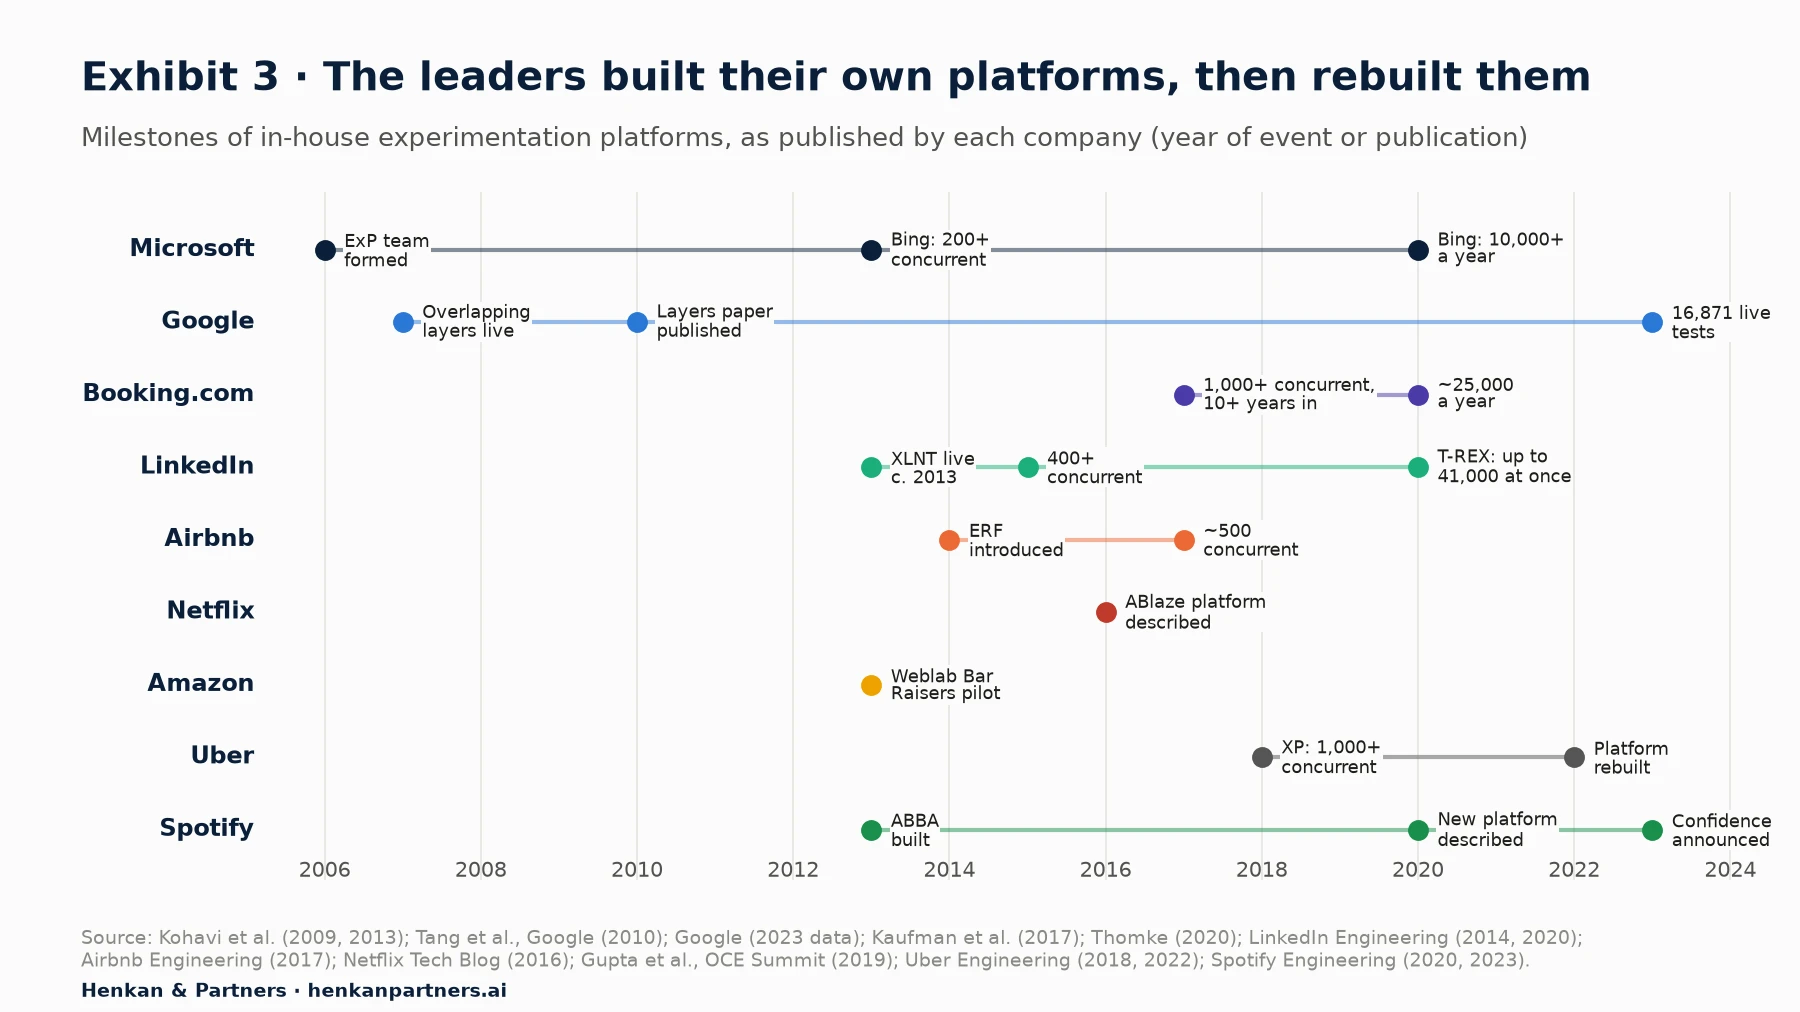
What this shows. Platform building at this level is a decade-long, multi-team investment, and it is never finished. The rebuilds are the telling part: LinkedIn, Uber and Spotify all replaced a first platform that no longer fitted their volume or could not be trusted. A mid-size retailer should take the lesson, not the project: buy a commercial tool and spend the saved effort on process.
LinkedIn: from 50 tests a day to 41,000 at once
LinkedIn's engineering blog described its XLNT platform in August 2014. At launch, about a year earlier, it "only supported about 50 tests per day"; a year later it ran "more than 200 experiments in parallel daily", and more than 2,800 experiments had run on it. Each team owned the logic of its metrics, "while the experimentation team reviews the metrics definitions", and reports were generated automatically every day. A 2015 KDD paper by Ya Xu and colleagues, titled From Infrastructure to Culture, reported "over 400 concurrent experiments running per day". By 2020, the platform, now called T-REX (Targeting, Ramping and Experimentation) and referred to as LiX or XLNT in earlier posts, was serving "up to 41,000 A/B tests simultaneously on a user population of over 700 million members."
Netflix: every product change, decided by members
Netflix's 2016 description of its platform states that "every product change Netflix considers goes through a rigorous A/B testing process before becoming the default user experience", so that changes "are not driven by the most opinionated and vocal Netflix employees, but instead by actual data." Netflix does not publish annual test counts; a 2022 post says only that it builds and tests "hundreds of product variants each year".
Airbnb: a reporting framework for 500 experiments
Airbnb introduced its Experimentation Reporting Framework (ERF) in 2014. By 2017, an engineering post reported "about 500 concurrent experiments", up from "a few dozen" in 2014, with about 2,500 distinct metrics computed every day. Airbnb is also the low end of published success rates: about 8% of Search experiments improved the target metric, according to the compilation by Kohavi, Deng and Vermeer (2022).
Uber: rebuilding because the results could not be trusted
In 2018 Uber reported "over 1,000 experiments running on our platform at any given time". Four years later it published a candid post explaining why it rebuilt the platform. With the old system, "a large percentage of the experiments had fatal problems and often needed to be rerun", and "obtaining high-quality results required an expert-level understanding of experimentation and statistics." More than 2,000 developers moved to the new platform and over 50,000 stale experiments were retired. It is the clearest public example of a company choosing trust over volume.
Spotify: from 20 priority tests a year to Confidence
Spotify built its first platform, ABBA, in 2013 and described a new platform in 2020, after the old system's logging had grown to "almost 25% of our total event volume." In 2023 it announced Confidence, a commercial version of its internal platform, and described a journey from "fewer than 20 priority experiments per year" to "hundreds of experiments per year across multiple squads" with ABBA, and to "thousands of experiments per year across virtually every aspect of our business" by 2020. A 2025 post by its data scientists reports close to 300 teams experimenting regularly in 2022, and "more than 58 teams ran 520 experiments on Spotify's mobile home screen alone" in the previous year.
Section 6 · Win rates
Their win rates are low, which is exactly why they test so much
High volume is not a sign that big tech has better ideas. It is a response to the fact that most ideas, even good-looking ones, do not work. Kohavi, Deng and Vermeer compiled published success rates in a 2022 KDD paper, and Spotify added its own figure in 2025.
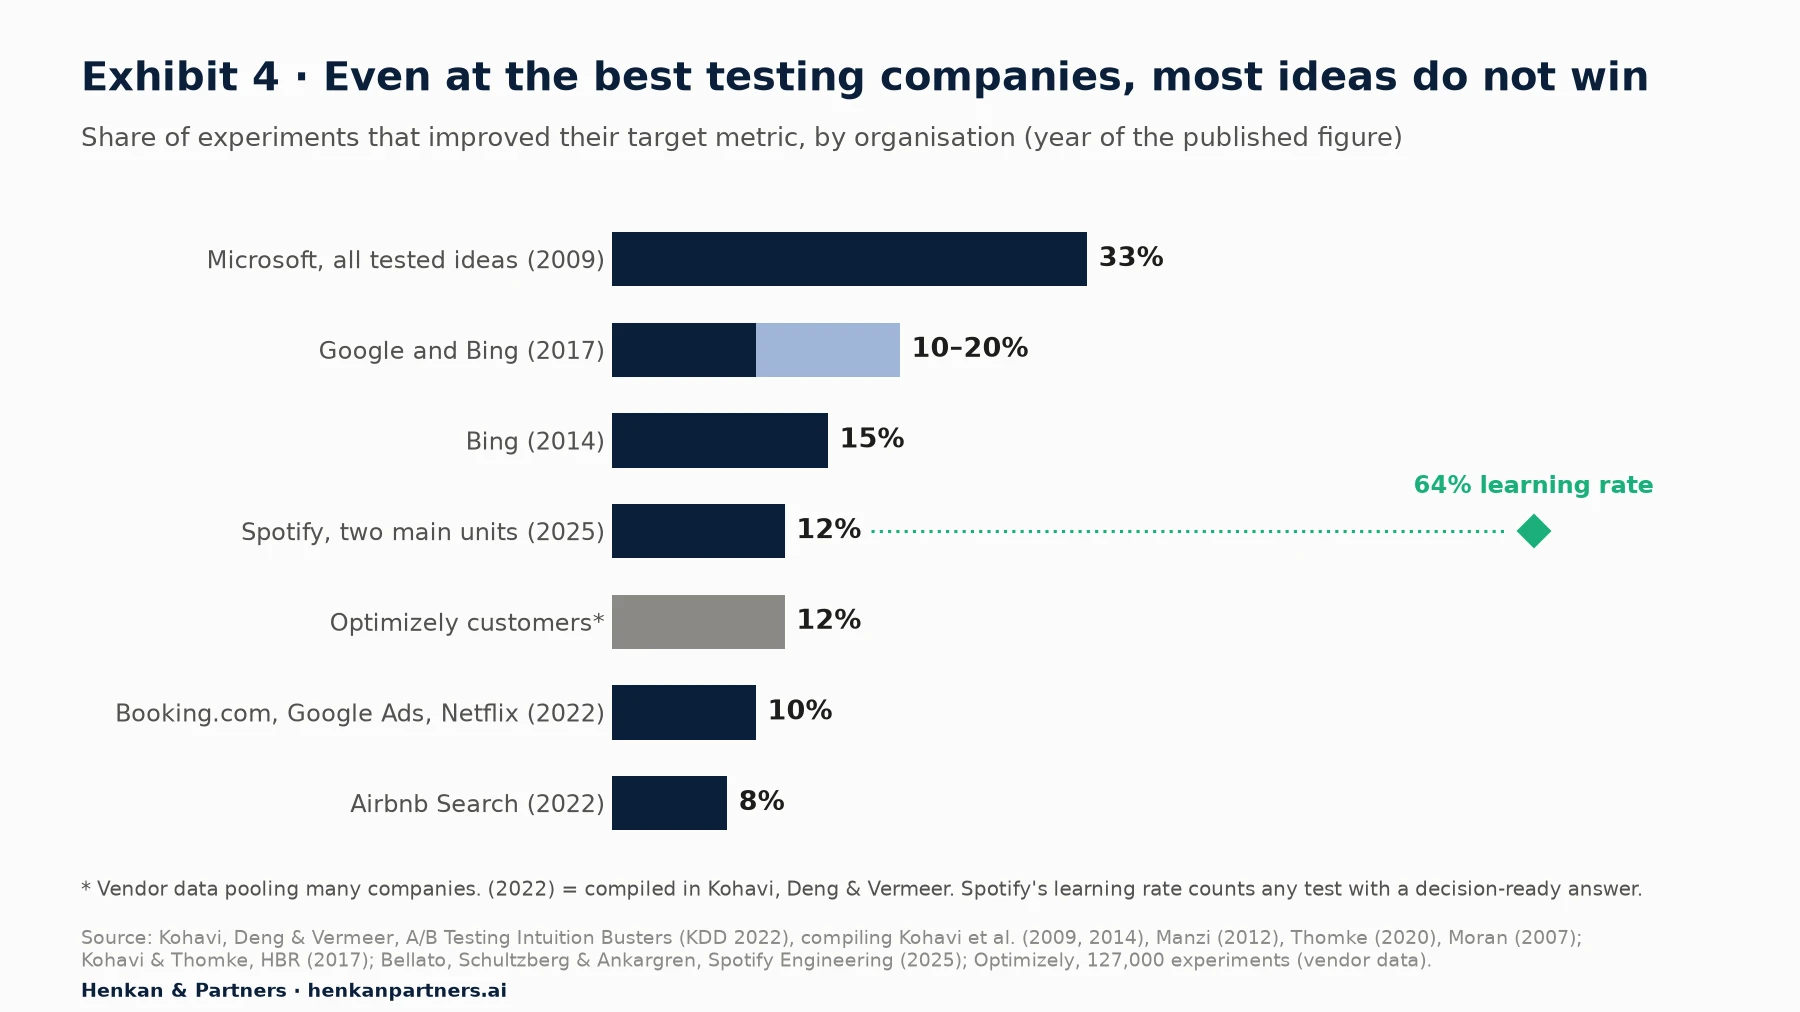
What this shows. If 85% to 90% of ideas fail at companies with the best data, the best designers and the most context, they will fail at least as often elsewhere. The answer the leaders found is not to have better ideas but to test more of them, cheaply and safely. Spotify shows the other half. In the two units that run about 80% of its experiments, about 12% of tests win but about 64% give a decision-ready answer, its learning rate: most value comes from finding out what not to ship.
Success rates are not league tables. They depend on how mature a product is, how ambitious the tests are and how a win is defined. Kohavi and Thomke put Google and Bing at "only about 10% to 20%" in 2017, while Microsoft as a whole was at "one-third" effective, "one-third" neutral and "one-third" negative. Optimizely's analysis of 127,000 experiments on its platform found the same pattern in a broad customer base: "only 12% of experiments produce a statistically significant improvement" on the primary metric (vendor data).
For leaders. If your team's win rate is far above these figures, do not celebrate yet. It usually means tests are too safe, or results are being read too generously. Our sibling article on building momentum explains how to celebrate losses that saved money, and A/B testing mistakes lists the errors that fake a winner.
Section 7 · Common traits
Five traits explain their results better than their traffic does
Read side by side, the published accounts point to the same five traits. None of them depends on having hundreds of millions of users. The textbook by Kohavi, Tang and Xu frames the starting conditions as three tenets: the organisation "wants to make data-driven decisions and has formalized an OEC", it "is willing to invest in the infrastructure and tests", and it "recognizes that it is poor at assessing the value of ideas."
| Trait | What it looks like | Published example |
|---|---|---|
| 1. Democratised launch, with guardrails | Many people can propose and run tests; rules and automated checks, not managers, stop bad ones | Booking.com: "anybody can launch an experiment" and "anybody" can kill one (2019) |
| 2. A trusted platform | One shared tool that assigns users, computes metrics and flags broken tests automatically | Uber rebuilt its platform because results needed reruns (2022); Booking.com warns of selective attrition on reports (2017) |
| 3. Written metric definitions | An overall evaluation criterion (OEC), guardrail metrics and one owner of each definition | LinkedIn: teams own metrics, the experimentation team reviews definitions (2014) |
| 4. Institutional memory | A searchable record of every test, with hypothesis, result and decision | Booking.com: a repository "dating back to the very first experiment" (2017) |
| 5. Leaders who accept being wrong | Senior ideas are tested like any other; failures are reported, not hidden | Bezos: "if you know in advance that it's going to work, it's not an experiment" (2016) |
Two habits run through all five. First, education is built into the workflow. Google uses checklists and an experiment council, Amazon uses Bar Raisers, Booking.com uses ambassadors and peer review, Microsoft runs a monthly class, and Twitter ran "experiment shepherds" with "one hour of classroom training per week for two months", according to the 2019 summit paper. Second, failures are treated as savings. The same paper describes the mature stage at which "negative experiment results are celebrated as saving customers and your business from harm."
Our sibling articles take each trait further: finding champions and setting rituals, talking to each stakeholder, measuring the programme and building a learning library and hiring and training the team.
Section 8 · What you cannot copy
Their traffic, statistical power and engineering cannot be copied, so do not try
The first thing that does not travel is traffic. The number of users a test needs grows with the inverse square of the effect you want to detect: halve the effect and you need four times the users. Kohavi, Henne and Sommerfield gave a rule of thumb in their 2007 KDD paper, for 95% confidence and 90% power: n = (4rσ/Δ)², where r is the number of variants, σ the standard deviation of the metric and Δ the smallest difference you want to detect. At a 5% conversion rate, they note that detecting a 5% relative change needs "less than 500,000 users", and a 20% change about 30,400.
Total users needed ≈ (4 × r × σ / Δ)²   (95% confidence, 90% power)
r = 2 variants; σ² = p × (1 − p) = 0.05 × 0.95 = 0.0475
Detect a 5% relative change: Δ = 0.05 × 0.05 = 0.0025 → n ≈ 64 × 0.0475 / 0.0025² ≈ 486,400
Detect a 1% relative change: Δ = 0.0005 → n ≈ 12.2 million
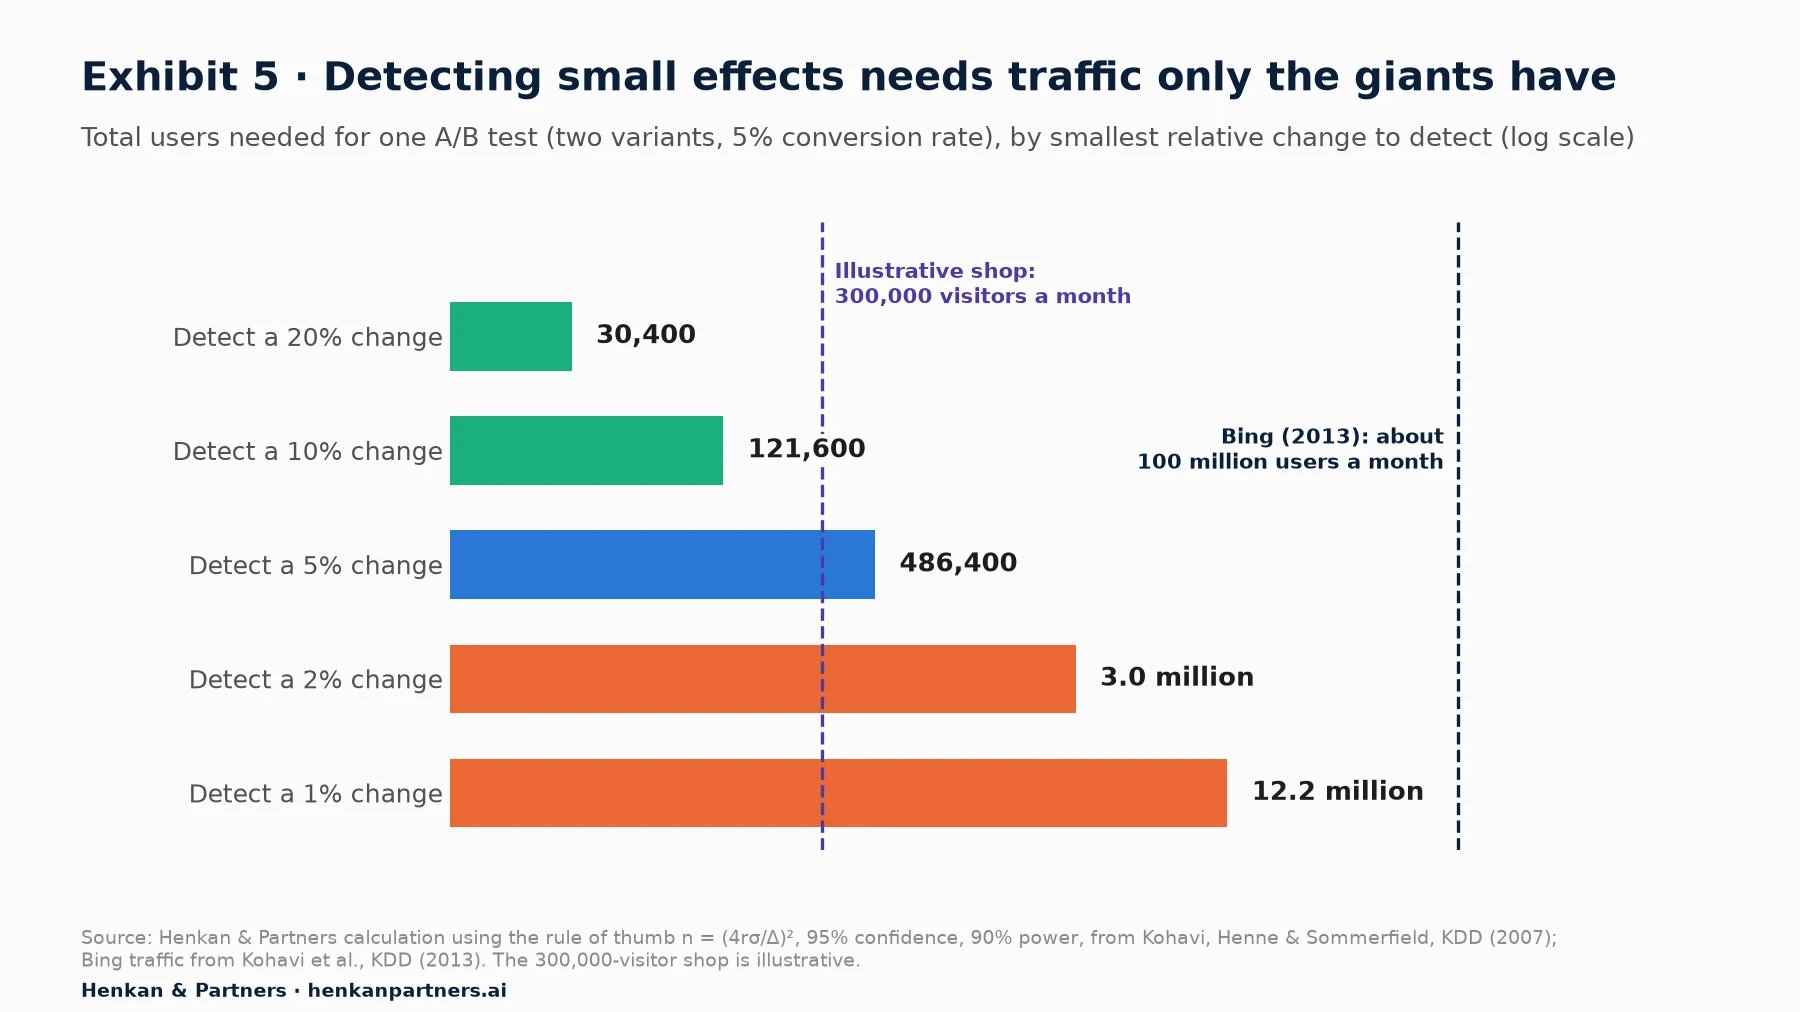
What this shows. With about 100 million monthly users in 2013, Bing could detect very small effects and run hundreds of tests at once. An illustrative shop with 300,000 visitors a month can detect a 10% change in a couple of weeks, but a 1% change would take more than three years of all its traffic. That single fact explains why the giants can test shades of blue and you cannot.
Three other things do not travel:
- Concurrency. Running hundreds of tests at once needs enough users per test and tools to detect interactions between tests. With modest traffic, a few tests in sequence or on separate pages are safer.
- The platform team. The companies in Exhibit 3 built dedicated platforms with their own engineering teams, and several rebuilt them. Building your own is rarely worth it below that scale; our optimisation tool selection scorecard helps you choose a commercial one.
- Specialist depth. Methods such as sequential tests, synthetic controls and bandits, all supported by Uber's platform in 2018, need dedicated statisticians. Most retailers need one person who understands sample size, guardrails and peeking well, which our guide to A/B test sample size and duration covers.
AI lowers the cost of building tests, not the traffic you need
AI coding assistants and agents can now draft hypotheses, write variant code and summarise results, which removes part of the engineering bottleneck that used to separate big tech from everyone else. Our article on AI agents in experimentation maps what they do at each step. But AI does not create users. If anything, cheaper variants make it more tempting to run many small, underpowered tests. In our experience the right use of AI for a mid-size team is to build bolder, better-researched tests faster, not more tiny ones.
Section 9 · What you can copy
Most of their habits can be copied tomorrow, at any scale
The good news is that the traits in Section 7 are habits, not infrastructure. Exhibit 6 sorts the big-tech playbook into what to copy as is, what to adapt and what to leave alone.
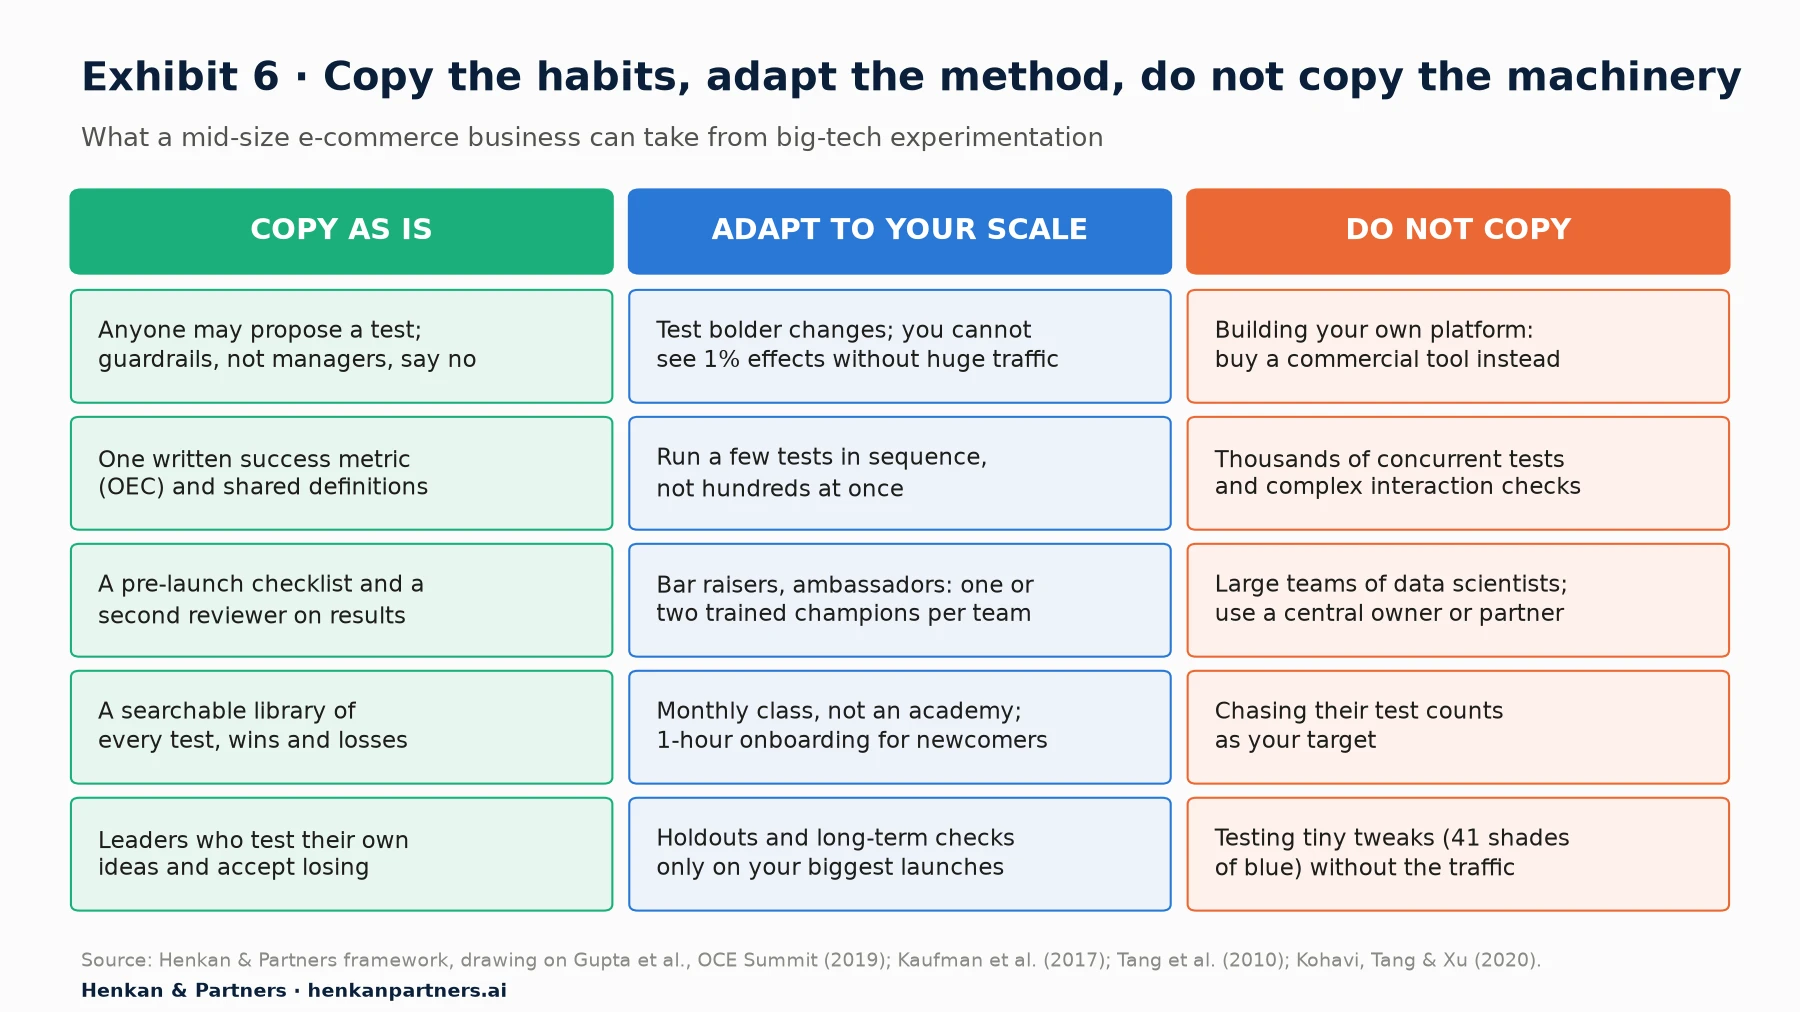
What this shows. The left column costs almost nothing and protects trust, the asset every leader in this article guards most. The middle column keeps the intent of big-tech practices at a fraction of the cost. The right column lists the things that look impressive in a conference talk but would consume a mid-size team's budget without improving decisions.
Worked example: what "at scale" means for a mid-size retailer
Illustrative example. Take an online retailer with 300,000 visitors a month and a 5% conversion rate. Using the formula above, a test designed to detect a 10% relative change needs about 121,600 users, so a test on a page that sees most of the traffic can finish in about two weeks. Running tests in sequence on the main funnel, plus a few on separate pages such as search or the account area, the team could realistically complete two to four trustworthy tests a month, or roughly 25 to 50 a year.
That is around the median of 34 a year in Optimizely's customer data (vendor data), and far from Booking.com. It is also enough to change how the business decides, if the team copies the left column of Exhibit 6: a written success metric with guardrail metrics, a checklist and a second reviewer for every test, a results library, and a monthly review in which a senior leader puts one of their own ideas to the test. In our experience that combination does more for a mid-size programme than doubling its test count.
| Big-tech practice | Mid-size version | Effort |
|---|---|---|
| Experiment council (Google) | A one-page test plan and checklist, reviewed by one trained colleague before launch | Low |
| Bar Raisers (Amazon), Ambassadors (Booking.com) | One trained champion per team who reviews plans 1–2 hours a week | Low |
| Monthly class (Microsoft) | A one-hour onboarding for anyone who wants to propose a test | Low |
| Central repository (Booking.com) | A shared library: hypothesis, screenshots, result, decision, tags | Low to medium |
| Real-time alerts (Booking.com) | Your tool's sample ratio mismatch and guardrail alerts, checked daily | Low |
| Metric review (LinkedIn) | One owner for the definition of each key metric in your analytics | Medium |
| In-house platform (all) | A commercial A/B testing tool, configured well | Medium |
Disclosure: Henkan & Partners sells experimentation consulting and fractional experimentation teams, and partners with A/B testing vendors. This article names no vendor as a recommendation.
Section 10 · What to do next
What to do next: borrow the habits this quarter and let volume follow
1. Benchmark honestly
Count the tests you completed in the last twelve months, the share with a written plan and the share that changed a decision. Compare with the median of 34 a year in Optimizely's data rather than with Booking.com, and set a realistic target from your own traffic using the sample-size formula.
2. Write down your success and guardrail metrics
Agree one overall evaluation criterion, such as revenue per visitor, and two to four guardrails. Name an owner for each definition, as LinkedIn does. Every test is then judged the same way.
3. Add a checklist and a second reviewer
Adopt a one-page test plan and pre-launch checklist, and train one champion per team to review plans, Bar Raiser style. Our sibling article on champions, sponsors and rituals shows how to find them.
4. Start the library now
Record every test, including losers and flat results, in a searchable format. It is the cheapest big-tech habit to copy and the one that compounds most over time.
5. Ask a leader to test their own idea
Nothing changes a culture faster than a senior person whose idea loses a test and says so. To speed up the setup, download the Experimentation Culture Kit, with a one-page charter, ritual agendas, a stakeholder map, objection cards, a RACI, a health scorecard and a maturity self-assessment. If you want help adapting big-tech practices to your traffic and team, Talk to us.
FAQ
Frequently asked questions about experimentation at scale
Frequently asked questions
What is experimentation at scale?
Experimentation at scale means testing most product, marketing and engineering changes with online controlled experiments as a routine part of how a company works. It usually involves hundreds or thousands of experiments a year, a shared platform, common metric definitions and many teams able to run tests, as at Microsoft, Booking.com, Google, LinkedIn, Netflix, Airbnb, Uber and Spotify.
How many A/B tests does Booking.com run per year?
Stefan Thomke wrote in Harvard Business Review in 2020 that Booking.com runs "some 25,000 tests a year". In 2017 its own data scientists reported more than 1,000 concurrent experiments on a daily basis. Both figures are snapshots and will have changed since.
How many experiments does Google run?
Google's How Search Works site reports that in 2023 it ran 16,871 live-traffic experiments on Search, plus 124,942 side-by-side experiments and 719,326 search quality tests with raters, which led to 4,781 launches. Google does not publish a company-wide total.
What percentage of A/B tests succeed at big tech companies?
Published success rates range from about 8% at Airbnb Search to about 33% at Microsoft, with about 10% at Booking.com, Google Ads and Netflix and 10% to 20% at Google and Bing. Spotify reported in 2025 a win rate of about 12% and a learning rate of about 64% in the two units that run about 80% of its experiments.
Was the Google 41 shades of blue test real?
Yes, according to Doug Bowman, who wrote in 2009 as he left Google that a team "couldn't decide between two blues, so they're testing 41 shades between each blue". A revenue figure attached to the story circulates online, but we could not verify it from a primary source.
What experimentation platforms do big tech companies use?
Most built their own: Microsoft's Experimentation Platform (ExP), Google's overlapping experiment infrastructure, LinkedIn's T-REX (called LiX or XLNT in earlier posts), Airbnb's Experimentation Reporting Framework (ERF), Uber's XP, Netflix's platform with the ABlaze front end, and Spotify's platform, now sold commercially as Confidence.
Can a small or mid-size company experiment like big tech?
It can copy the habits but not the volume. A shop with 300,000 visitors a month can run perhaps 25 to 50 trustworthy tests a year if it tests changes big enough to detect. Written metrics, checklists, a second reviewer, a results library and leaders who test their own ideas all work at that scale.
Should we build our own A/B testing platform?
Almost certainly not, unless you have the traffic and engineering of the companies in this article. Each of them invested for years in its platform, and several rebuilt their first one. A well-configured commercial tool plus a strong process gives most companies more value.
Key terms
- Online controlled experiment (A/B test)
- A test in which users are randomly split between a control and one or more variants, so differences in outcomes can be attributed to the change. It is the unit of work behind every figure in this article.
- Experimentation at scale
- Testing most changes as a routine, with hundreds or thousands of experiments a year on a shared platform. It matters because it turns decisions into evidence rather than opinion.
- Concurrent experiments
- Experiments running at the same moment, often with one user in several of them. It measures capacity, not annual volume, so it should not be compared with tests per year.
- Overlapping layers
- Google's design that splits system parameters into layers so a user can be in one experiment per layer at the same time. It multiplies how many experiments a fixed amount of traffic can support.
- Overall evaluation criterion (OEC)
- The main metric, or small set of metrics, used to judge every experiment. A written OEC stops teams picking whichever metric makes their test look good.
- Guardrail metric
- A metric that must not get worse during a test, such as revenue per visitor or page load time. Guardrails let more people test safely without extra approvals.
- Win rate (success rate)
- The share of experiments that improve their target metric. It is low everywhere, which is why it should not be the only measure of a programme.
- Learning rate
- Spotify's measure of the share of experiments that give a decision-ready answer, including "do not ship". It rewards honest, useful tests rather than only winners.
- Statistical power
- The probability that a test detects an effect of a given size if it exists. Low power is the main reason small sites cannot copy big-tech test volumes.
- Minimum detectable effect
- The smallest change a test is designed to detect. Halving it roughly quadruples the traffic needed, so it drives how many tests you can run.
- Pre-registration
- Recording the hypothesis and primary metric before a test starts, as Booking.com requires. It prevents moving the goalposts after seeing the data.
- Experiment council / Bar Raisers / Ambassadors
- Google, Amazon and Booking.com names for experienced people who review or support other teams' experiments. They spread quality without creating a central bottleneck.
- Centre of excellence
- A central team that owns tools, methods and training while product teams run their own tests. It is Microsoft's model and a common step between centralised and federated testing.
- Institutional memory (results library)
- A searchable record of every past test with its hypothesis, result and decision. It stops teams repeating old tests and keeps learning when people leave.
Sources
Methodology. Sources were opened and checked in October 2026. Scale figures are given with the year they were published or refer to, because they change quickly and companies count differently (per year, concurrent, or tests served). Optimizely figures are vendor data from its customer base. Spotify's Confidence is a commercial product, so Spotify's 2023 post is also vendor content. Exhibits 1, 2, 3 and 4 show published data; Exhibit 5 is a Henkan & Partners calculation from a published formula, with an illustrative shop; Exhibit 6 and the tables of traits and scaled-down practices are Henkan & Partners frameworks. We could not verify a revenue figure for Google's 41 shades of blue test, and Amazon does not publish experiment volumes, so neither is quoted.
- Harvard Business Review (2017). Kohavi and Thomke, The Surprising Power of Online Experiments (reprint).
- Harvard Business Review (2020). Thomke, Building a Culture of Experimentation.
- Harvard Business Review (2019). At Booking.com, Innovation Means Constant Failure (podcast with Stefan Thomke).
- Cambridge University Press (2020). Kohavi, Tang and Xu, Trustworthy Online Controlled Experiments, chapter 1 excerpt.
- KDD (2022). Kohavi, Deng and Vermeer, A/B Testing Intuition Busters.
- Microsoft (2009). Kohavi, Crook, Longbotham et al., Online Experimentation at Microsoft.
- KDD (2013). Kohavi et al., Online Controlled Experiments at Large Scale.
- KDD (2007). Kohavi, Henne and Sommerfield, Practical Guide to Controlled Experiments on the Web.
- arXiv (2017). Kaufman, Pitchforth and Vermeer, Democratizing Online Controlled Experiments at Booking.com.
- Google (2010). Tang, Agarwal, O'Brien and Meyer, Overlapping Experiment Infrastructure: More, Better, Faster Experimentation.
- Google (2023 data). How Search Works: Rigorous testing.
- Stopdesign (2009). Doug Bowman, Goodbye, Google.
- Amazon (2016). 2015 Letter to Shareholders.
- SIGKDD Explorations (2019). Gupta, Kohavi, Tang, Xu et al., Top Challenges from the First Practical Online Controlled Experiments Summit.
- LinkedIn Engineering (2014). XLNT Platform: Driving A/B Testing at LinkedIn.
- KDD (2015). Xu, Chen, Fernandez, Sinno and Bhasin, From Infrastructure to Culture: A/B Testing Challenges in Large Scale Social Networks.
- LinkedIn Engineering (2020). Our evolution towards T-REX: The prehistory of experimentation infrastructure at LinkedIn.
- Netflix Tech Blog (2016). It's All A/Bout Testing: The Netflix Experimentation Platform.
- Netflix Tech Blog (2022). Tingley et al., Netflix: A Culture of Learning.
- Airbnb Engineering (2017). Parks, Scaling Airbnb's Experimentation Platform.
- Uber Engineering (2018). Zhou, Liu, Feng et al., Under the Hood of Uber's Experimentation Platform.
- Uber Engineering (2022). Supercharging A/B Testing at Uber.
- Spotify Engineering (2020). Spotify's New Experimentation Platform (Part 1).
- Spotify Engineering (2023). Coming Soon: Confidence, an Experimentation Platform from Spotify.
- Spotify Engineering (2025). Bellato, Schultzberg and Ankargren, Beyond Winning: Spotify's Experiments with Learning Framework.
- Optimizely (undated, vendor data). Top 10 takeaways from running 127,000 experiments.