Focus
How to Talk About Experimentation to Every Stakeholder: Executives, Analysts, Designers, Developers and More
Alexandre Suon · 2026-10-01
The same A/B test means different things to a CEO, a developer and a brand director. This deep dive on experimentation stakeholder communication shows how to talk about testing to ten audiences: what each cares about, what each fears, the phrases that land and the ones to avoid, and how to answer the eight objections every experimentation lead hears.
Executive summary
- Experimentation programmes rarely fail on statistics; they fail when the people around them stop listening. A test result only creates value when someone acts on it, and each stakeholder decides whether to act through their own lens: money for finance, risk for legal, craft for design, stability for engineering.
- Lead with the one fact that disarms every audience: most ideas lose when tested. At Microsoft about one-third of tested ideas improved their metric, one-third were neutral and one-third were negative. Published win rates elsewhere range from 8% (Airbnb Search) to 15% (Bing), and Optimizely reports 12% across 127,000 experiments (vendor data).
- Opinion still drives many big decisions, which is why the conversation matters. In a 2016 PwC survey of 256 UK executives, 34% relied mostly on experience and intuition for their last big decision and 33% on data and analytics. Testing does not remove judgement; it gives judgement something better to work with.
- Change the framing, never the result. Executives hear decisions and ranges, finance hears margin with a holdout, product hears answers to its questions, developers hear clean code and no speed regression, legal hears a fast and predictable review path. The number, the confidence interval and the caveats are identical for everyone.
- Eight objections come back in every company, and each has a short answer with evidence. Not enough traffic, brand risk, the boss has decided, too slow, the test lost, SEO, button colours and AI each have a reply that works better with proof than with enthusiasm. Google, for example, publishes explicit rules for testing without SEO harm.
- Write it down once. A one-page stakeholder language guide, a map of who hears what and how often, and a shared result template stop the programme from depending on one persuasive person. Pair them with the free Experimentation Culture Kit templates.
Section 1 · Definition
Stakeholder communication decides whether a test result turns into a decision
Experimentation stakeholder communication is the practice of explaining tests, results and the experimentation programme to each group that funds, builds, approves or is affected by them, in the terms that group is accountable for, without changing the result itself. It covers what you say before a test (why it is worth running), during it (what could go wrong and who is watching), and after it (what was decided and why).
A test is a means to a decision. If the head of trading ignores a result that arrived as an unexplained p-value, the test has cost money and changed nothing. In our experience, programmes rarely stall because the statistics were wrong. They stall because the people around them stopped trusting, funding or acting on the results.
Ron Kohavi and colleagues at Microsoft popularised the term HiPPO, the Highest Paid Person's Opinion, in a 2007 paper on controlled experiments, as a reminder that success depends on what users perceive, not on what strong managers believe. They credit the idea to Avinash Kaushik's earlier “HiPO”. Useful idea, bad insult: the aim here is to give every stakeholder, including the highest paid, a reason to want the test.
This deep dive is part of the learning path Build a culture of experimentation. It focuses on the conversations. For the overview of culture and leadership, read how to build a culture of experimentation. For the business case in numbers, read experimentation ROI. For a new lead's first stakeholder interviews and audit, read your first 90 days in a new CRO role. For who should own the programme, read how to choose an experimentation operating model.
Opinion still drives many big decisions, so a good test needs a good conversation
It is tempting to assume that companies decide on data. Exhibit 1 shows how UK executives said they made their last big decision in PwC's 2016 Big Decisions survey.
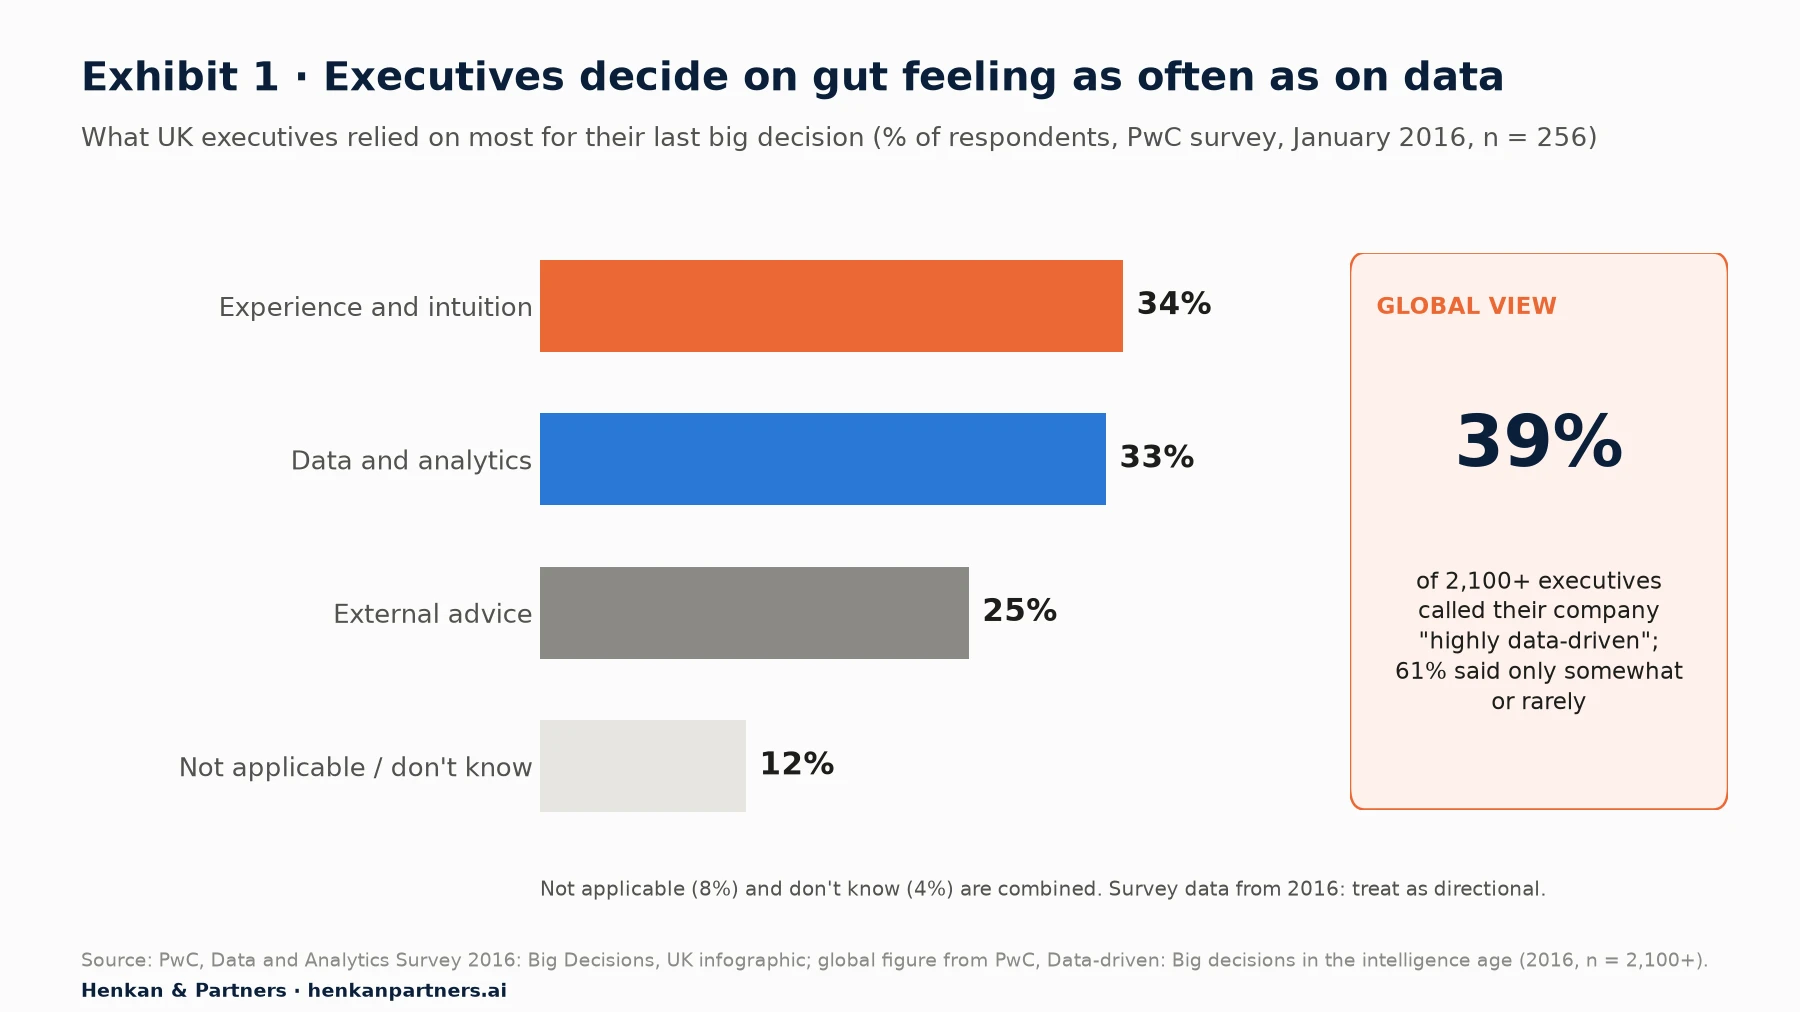
What this shows. Intuition (34%) and data (33%) were level, and globally only 39% of executives called their organisation highly data-driven. The survey is from 2016 and self-reported, so treat it as directional. Intuition is not the enemy; it is the default, and a programme has to earn its place next to it.
The consequence for communication is that every test asks someone to accept they might be wrong. Stefan Thomke's study of experimentation cultures in Harvard Business Review (2020) notes that leaders must be able to confront that possibility every day. Each team also answers to a different scorecard (margin, risk, perception, uptime), and trust is fragile: one overstated uplift that never reaches the P&L can cost a year of credibility with finance. Communication is part of the guardrails, not a layer on top of them.
Section 2 · Stakeholder map
Map stakeholders by influence and interest, then match the depth and channel to each
Before you write a single message, decide who needs to hear what, and how often. The classic tool is Mendelow's power-interest matrix (usually dated 1991), which sorts stakeholders into four groups, in the labels most often used: manage closely (high power, high interest), keep satisfied (high power, lower interest), keep informed (lower power, high interest) and monitor (lower power, lower interest). Exhibit 2 adapts it to an e-commerce experimentation programme.
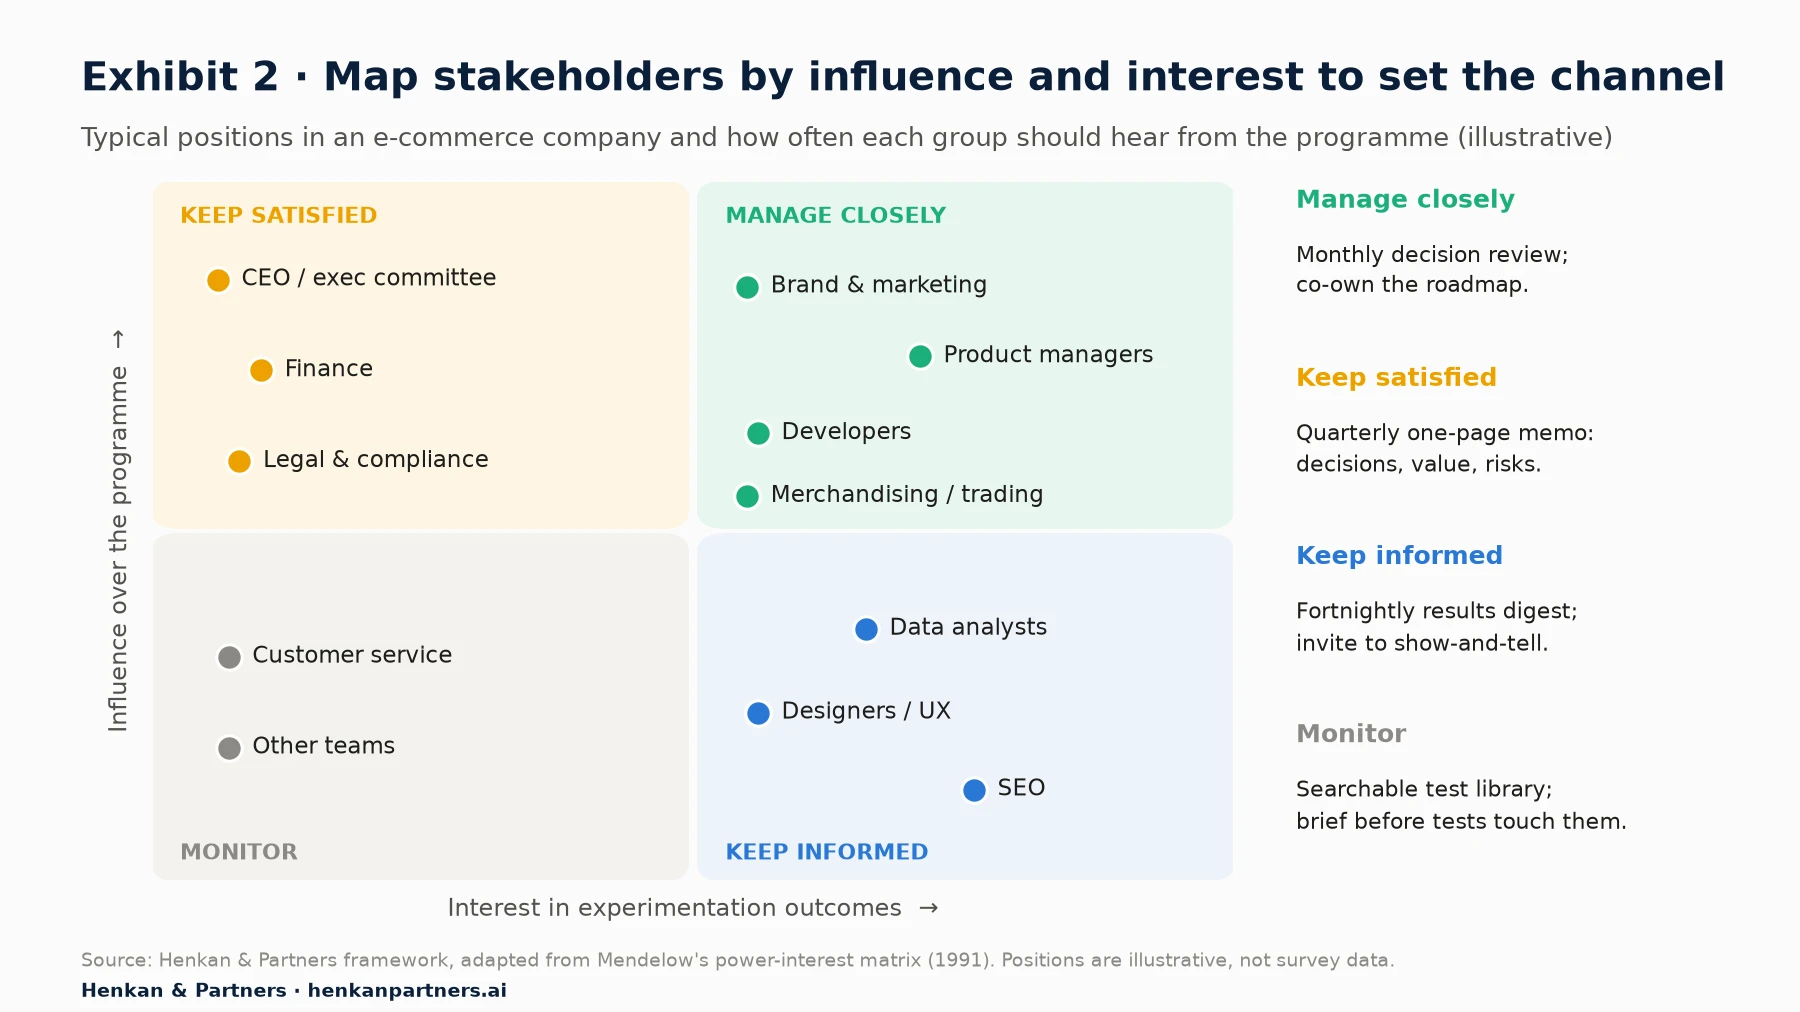
What this shows. Positions vary by company: in a luxury house, brand can veto any variant. What matters is the channel: the top-right quadrant co-owns the roadmap, the top-left gets a short quarterly memo about decisions and risk, the bottom-right gets every result, and the bottom-left gets warned before a test touches their work.
The map in your first 90 days in a new CRO role sorts stakeholders by support, to decide whom to win over first; this one sorts them by interest, to decide what to send and how often.
Our view. Depth changes by audience; truth does not. Never tell finance a smaller number than you tell product, or brand a different story from the one you tell trading. Stakeholders talk to each other. A programme that is caught telling two versions of the same result loses everyone at once.
Section 3 · The universal message
Lead with the one fact that disarms every audience: most ideas lose when tested
Before you tailor anything, there is one message that works for every group, because it takes the ego out of the conversation: even the best teams in the world are usually wrong about which ideas will work. Exhibit 3 shows the evidence.
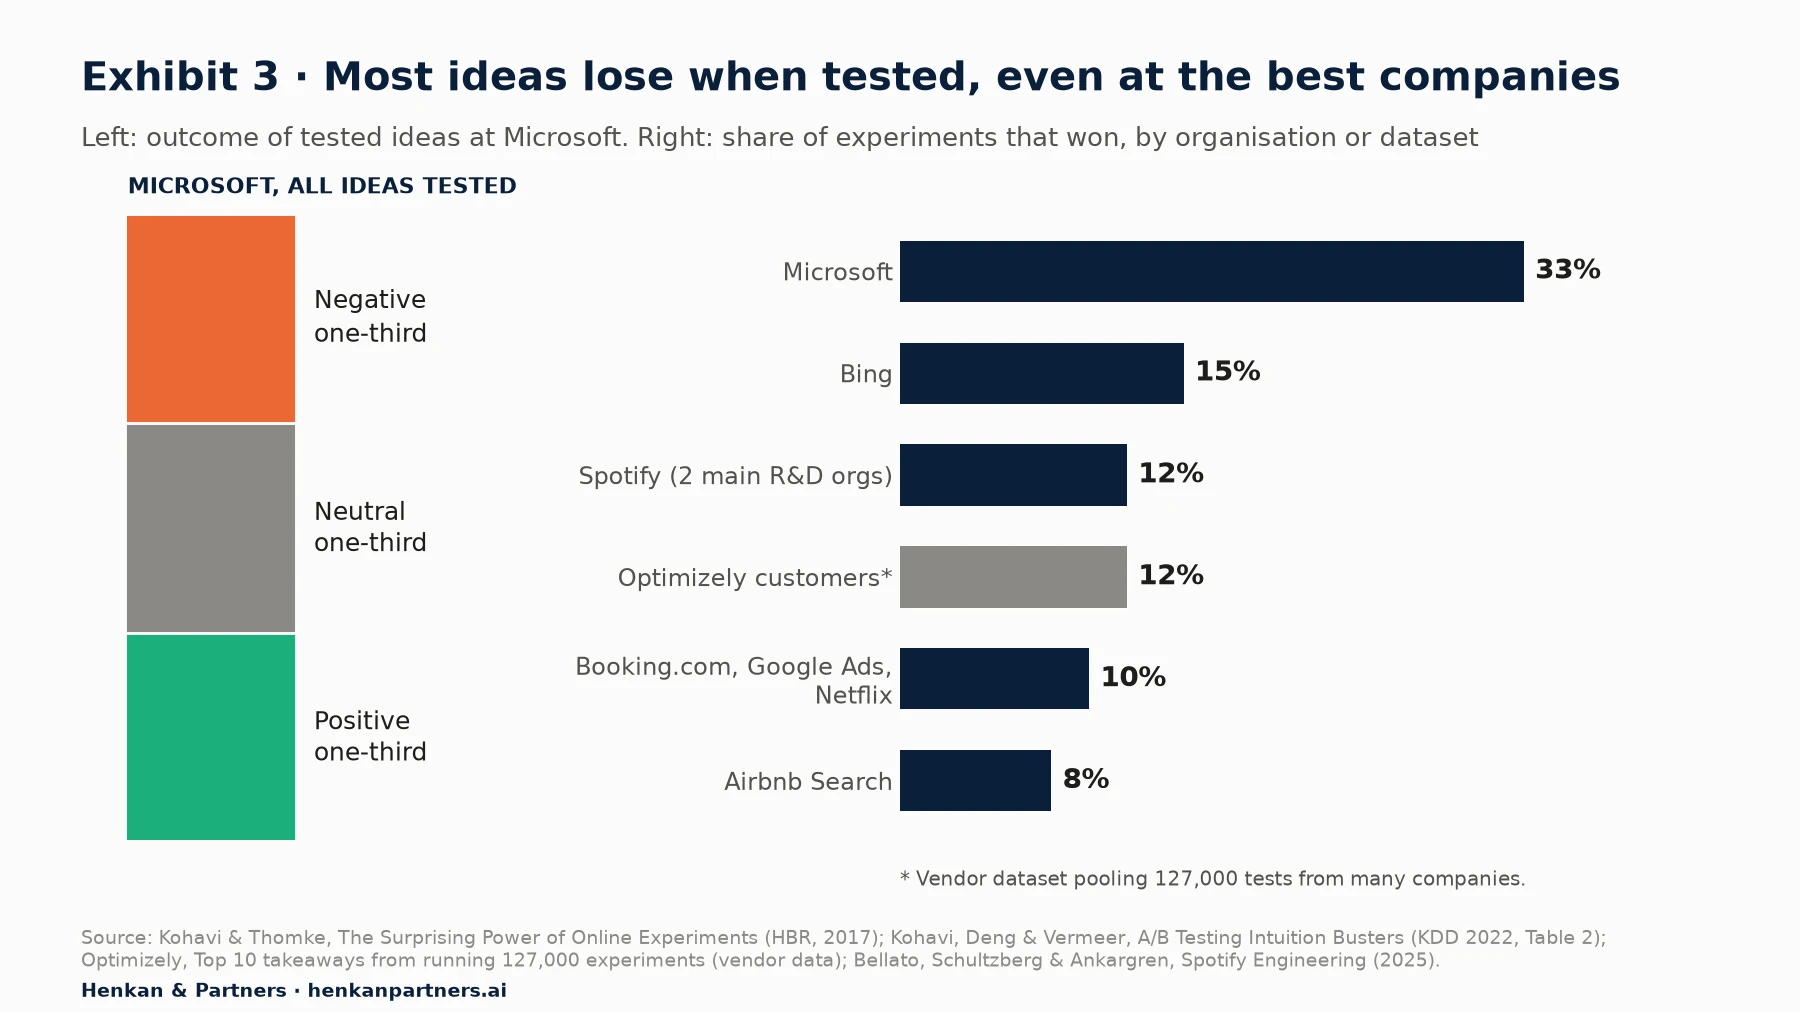
What this shows. Win rates at experienced companies sit between 8% and 33%. The left-hand bar matters as much as the right: at Microsoft, one-third of ideas had negative results, which means that shipping them without a test would have hurt the business. Definitions differ, so compare orders of magnitude, not decimals.
Use this fact in every room. With executives, it reframes testing as risk control: “A third of good-looking ideas make things worse; testing finds out which third before customers do.” With designers and product managers, it removes the sting of a loss.
Three rules then apply to every message, whoever the audience:
- Decision first, data second. Open with what was decided or what needs deciding. “We recommend shipping B to all users” is a better first line than “Variant B reached 96% significance.”
- Give a range, not a point. “Between +0.4% and +3.8% orders, most likely around +2%” is honest and still useful. A single number invites someone to multiply it by annual revenue and hold you to the result.
- Translate into their unit. Euros of margin for finance, contacts per thousand orders for customer service, milliseconds for developers, brand-tracking scores for marketing. The test does not change; the unit does.
Section 4 · Executives and finance
Executives and finance fund decisions and reduced risk, so speak in money, ranges and choices
These are the people who keep the programme alive. They rarely care about individual tests; they want to know whether the programme is making better decisions than the company would make without it, and whether the money it claims is real.
CEO and executive committee
Executives think in strategic bets, quarters and reputation. They respond to choices framed as risk and reward, and to evidence that the programme tests the questions they actually lose sleep over.
- Cares about: growth against plan, big bets landing, speed of decisions, avoiding public mistakes.
- Fears: a team that tinkers with buttons while the strategy needs answers; being made to look wrong in front of peers.
- Say: “Before we commit EUR 2 million to the new checkout, we can test the riskiest part with 10% of traffic in four weeks.” “Here are the three decisions testing changed this quarter, and the one it stopped.”
- Avoid: “We ran 47 tests this quarter.” “The data proves you were wrong.” “Significance was 95%.”
- Show: a one-page quarterly memo: decisions made, value range with confidence, harm avoided, the next big question. Link it to the company's two or three priorities.
Finance
Finance teams have usually seen inflated uplift claims before. Win them by being more conservative than they expect and by offering a way to audit you.
- Cares about: incremental margin, payback period, cost per test, numbers that reconcile.
- Fears: summed uplifts that never show in revenue; double-counting with marketing and pricing.
- Say: “Our estimate is EUR 0.3 to 0.9 million of margin this year; a 5% holdout will tell us the real figure by Q2.” “This loss stopped a change that would have cost about EUR 80,000 a month.”
- Avoid: “This test is worth EUR 4 million a year.” “We added up all our winners.”
- Show: the programme model with ranges and a holdout plan, as set out in experimentation ROI. Invite finance to challenge the assumptions before the year starts, not after.
For leaders. The most useful thing a sponsor can say in public is “I don't know, let's test it” about one of their own ideas.
For marketers. Bring the exec committee one decision you need from them. A readout without an ask is just a report.
Section 5 · Product and design
Product managers and designers engage when tests answer their questions rather than grade their work
Product and design teams are the main source of test ideas and the people most likely to feel judged by a result. The framing that works is partnership: the programme exists to answer their questions faster and to protect their launches, not to mark their homework.
Product managers
Product managers own roadmaps and outcomes. They worry that tests slow releases and that a test team will push its own backlog over theirs. Give them answers to the questions on their roadmap, and they become your biggest source of demand.
- Cares about: shipping the roadmap, hitting their outcome metric, settling internal debates.
- Fears: release delays, conflicting tests on their area, a separate team claiming credit.
- Say: “Which assumption on your roadmap would hurt most if it were wrong? Let's test that one first.” “We can release behind a feature flag and test the rollout, so you don't lose a sprint.”
- Avoid: “You need to get this test approved before you release.” “Your feature lost.”
- Show: a shared roadmap where tests map to their open questions, plus the time-to-decision for their last three tests.
Designers and UX researchers
Designers care about craft and coherence. A good designer fears that testing reduces design to small tweaks judged by a single number. That fear deserves a hearing: a programme should test bold concepts, not only tweaks.
- Cares about: a coherent experience, the quality of the work, understanding why users behave as they do.
- Fears: design by committee, ugly winners, being asked for 12 colour variants.
- Say: “Bring us your boldest concept; we'll test it against the current page and learn something either way.” “The data tells us what happened; your research tells us why. We need both in the readout.”
- Avoid: “The data says your design is worse.” “Just give us three button colours.”
- Show: results with session replays or user quotes beside the numbers, credit in every readout, and evidence that changes designers care about can be worth a great deal (Exhibit 4).
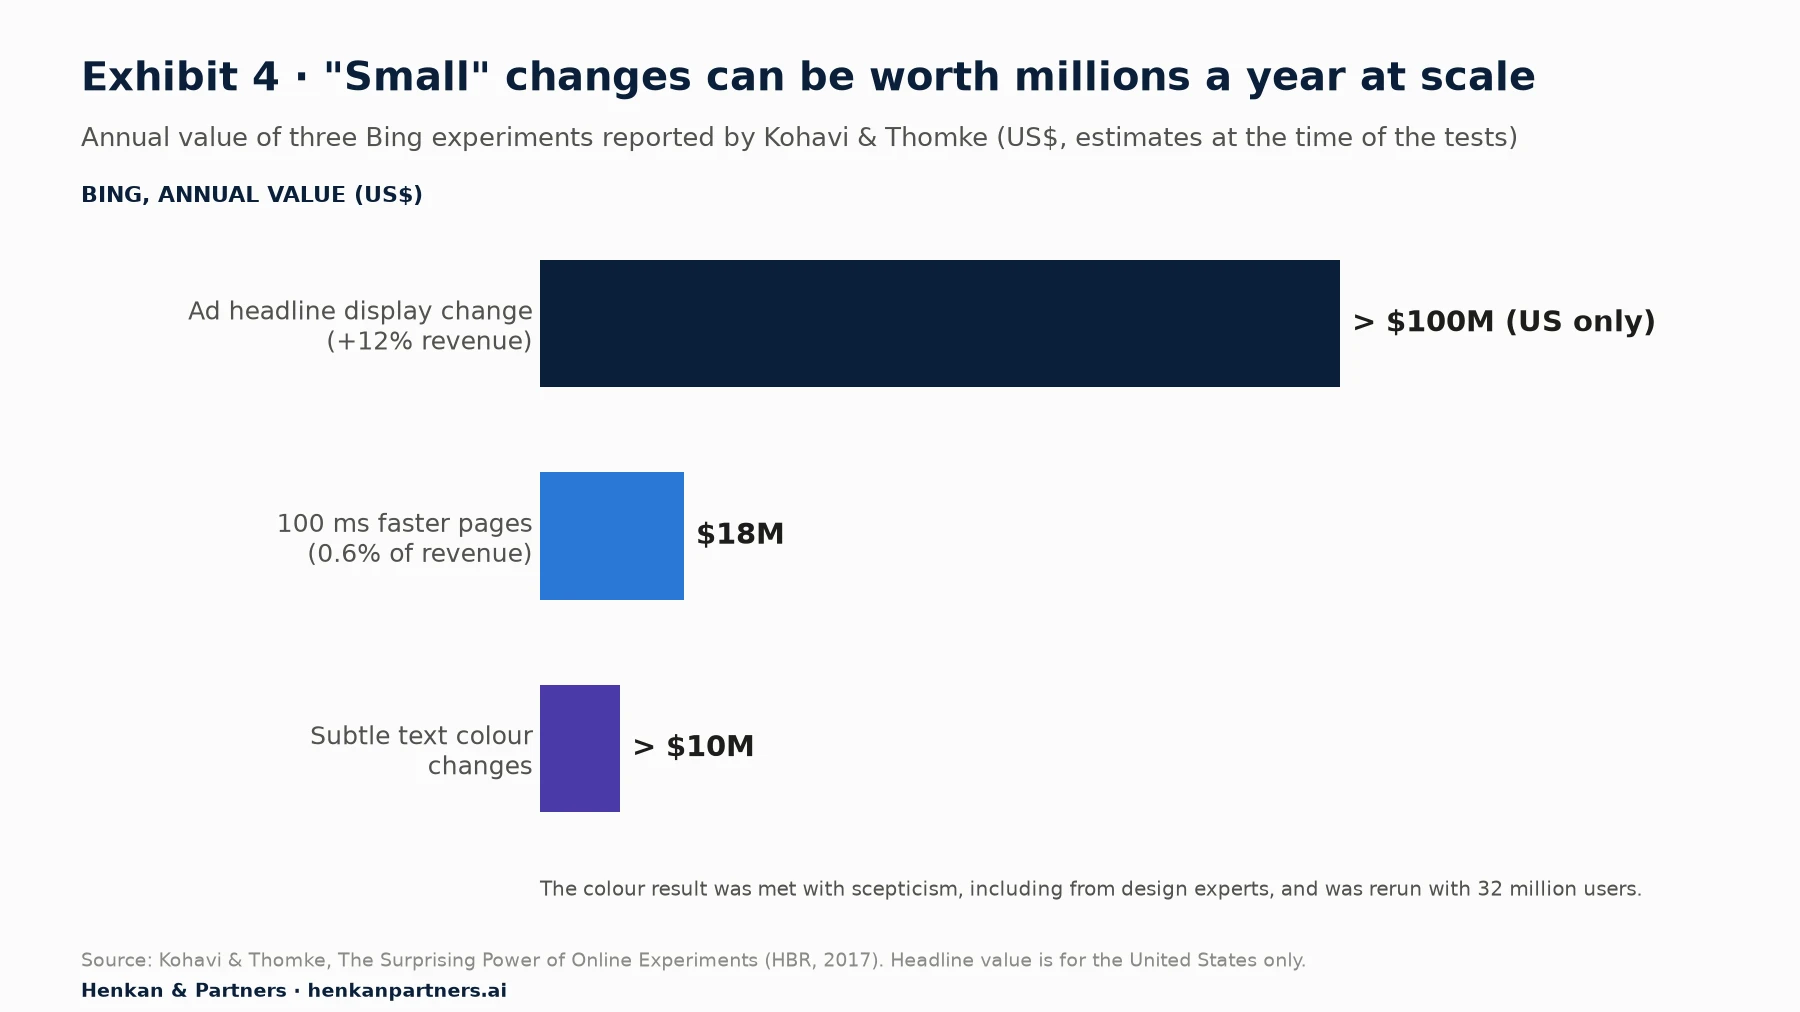
What this shows. At Bing, a change to how ad headlines were displayed raised revenue by 12%, worth more than $100 million a year in the US alone, after the idea had sat in the backlog for more than six months. Subtle colour changes to search results were worth more than $10 million a year; Kohavi and Thomke note that the result was met with scepticism by several disciplines, including design experts, and was rerun with 32 million users. Optimizely also reports that, across its customers' tests, experiments with more variations tend to carry more expected impact than a simple A/B test (vendor data). In our experience, testing rewards bold, well-researched ideas.
Section 6 · Engineering and data
Developers and analysts back a programme that respects code quality and statistical rigour
Developers know what a badly built variant does to a site; analysts know what a badly analysed test does to a decision. Both quietly withdraw support if the programme cuts corners, so let them set some of the rules.
Developers and engineering leads
Engineers worry about flicker, page weight, test code left in production and incidents at 2am. They are right to: Kohavi and Thomke report that Bing measured that every 100 milliseconds of page speed was worth 0.6% of revenue, about $18 million a year at the time. Performance is a business metric, and engineers will respect a programme that treats it as one.
- Cares about: site speed, code quality, stable releases, not being on call for marketing scripts.
- Fears: flicker, layout shift, orphaned test code, tests that conflict with releases.
- Say: “Every test goes through the QA checklist and has a rollback plan; speed is a guardrail metric.” “Once a variant wins, we hard-code it within two sprints and remove the test code.”
- Avoid: “It's just a small script.” “Can you squeeze this in before the weekend?”
- Show: a QA checklist they helped write (A/B test QA checklist), speed and error guardrails, and a clear choice of client-side or server-side by test type (how to choose).
Data analysts and data scientists
Analysts are the programme's quality control. They will forgive a slow programme, but not a sloppy one: peeking at results, stopping when the number looks good, ignoring sample ratio mismatch (SRM, an unexpected imbalance between groups that signals a broken test). Treat them as co-owners of the method, not as a reporting service.
- Cares about: valid methods, pre-registered metrics, reproducible analysis, metric definitions that match the data warehouse.
- Fears: peeking, cherry-picked metrics, results that contradict the warehouse, being blamed for 'no result'.
- Say: “The primary metric, sample size and stopping rule are written down before launch.” “This test failed its SRM check, so we are not reading the result.”
- Avoid: “It's directionally positive.” “Can you find a segment where it won?”
- Show: the test plan, the power calculation (sample size and duration), the SRM check and the chosen statistical model (statistics for marketers).
Section 7 · Commercial and control functions
Commercial, brand, legal and service teams need to see that testing protects what they answer for
These four groups rarely start tests, but each can stop them. The winning move is the same for all four: build their concerns into the process before they have to raise them.
Merchandising and trading
Trading teams live by the weekly sales report and the promotional calendar. A test that runs over a key sale, or splits traffic on the hero product, looks like a threat to their numbers.
- Cares about: weekly sales, sell-through, promotions landing, stock.
- Fears: tests that dilute a campaign, cannibalise a hero product or make the weekly numbers hard to read.
- Say: “We've checked the promo calendar; this test pauses during the sale week.” “Which category question would help next season's range planning? We can test it.”
- Avoid: “The test has to run through Black Friday.” “Ignore the weekly dip, it's the test.”
- Show: a shared calendar of tests and campaigns, and joint tests on their questions (sorting, badges, bundles).
Brand and marketing
Brand teams fear that testing optimises the brand into a discount shop: shouting banners, false urgency, off-tone copy. That fear is legitimate. Thomke's HBR study lists “all experiments are ethical” as one of the attributes of an experimentation culture, and brand is often the best judge of where that line sits.
- Cares about: consistency, tone of voice, long-term brand equity, campaign performance.
- Fears: off-brand variants, short-term tricks, inconsistent experiences across channels.
- Say: “Brand sets the guardrails before we design; nothing goes live that you haven't seen.” “We track a brand guardrail metric, such as returning-customer rate, as well as conversion.”
- Avoid: “Conversion is all that matters.” “It's only 50% of traffic for two weeks.”
- Show: a brand-approved variant library, guardrail metrics (how to choose them), and evidence that tests can improve the experience without cheapening it.
Legal, privacy and compliance
Legal teams need predictability. They do not want to discover a test on price display or a new consent banner after it has gone live. Consent is a real question: in France, the CNIL exempts from consent only trackers used strictly for audience measurement (including optimising a site's performance or ergonomics) under strict conditions. Its guidance does not mention A/B testing by name, so whether your testing tool can run without consent is a question for your legal team, not for the experimentation team. See user consent in e-commerce.
- Cares about: consent, accurate claims, consumer law on pricing and urgency, data processing records.
- Fears: misleading claims, unconsented tracking, discriminatory or unfair pricing tests, surprises.
- Say: “Here is a pre-approved list of test types that need no review, and a 48-hour path for the rest.” “This test only changes layout; no claims, prices or data collection change.”
- Avoid: “Legal doesn't need to see this.” “Everyone else does it.”
- Show: a test-type matrix (no review / quick review / full review), the tool's data processing documentation, and a named contact for urgent questions.
Customer service
Customer service is often the last to know and the first to hear about a test. A customer calls about a delivery promise they saw on the product page; the agent sees a different page and has no idea why. A short heads-up turns them from victims of the programme into one of its best sources of insight.
- Cares about: accurate information, contact volumes, handling time, not being surprised by customers.
- Fears: customers seeing things agents cannot see, rising contact rates, complaints they cannot explain.
- Say: “From Monday, half of visitors will see a delivery date on product pages; here is what it looks like.” “Tell us if contacts about delivery change; you'll see it before our dashboards do.”
- Avoid: “It's only a test, it doesn't affect you.” “Just tell customers it's a glitch.”
- Show: a weekly list of live tests with screenshots, a guardrail on contact rate where relevant, and credit when their feedback shapes a test (turning customer insight into tests).
Section 8 · One-page language guide
A one-page language guide keeps the whole team telling one story in ten dialects
When the programme has more than one person talking to stakeholders, write the language down. Table 1 condenses the section above into a single page you can pin next to your result template.
| Audience | Lead with | Unit to use | Say | Avoid |
|---|---|---|---|---|
| CEO / exec committee | The decision and the risk avoided | EUR range, strategic priority | “Before we commit, let's test the riskiest part.” | Test counts, p-values, “you were wrong” |
| Finance | Incremental margin and how it will be verified | Margin range, payback, holdout | “A holdout will confirm the real figure.” | Summed uplifts, annualised single numbers |
| Product managers | The roadmap question answered | Their outcome metric | “Which assumption would hurt most if wrong?” | “Your feature lost.” |
| Designers / UX | What we learned about users | Behaviour plus the why | “Bring us your boldest concept.” | “The data says your design is worse.” |
| Developers | Stability and clean-up plan | Milliseconds, errors, tickets | “Speed is a guardrail metric.” | “It's just a small script.” |
| Data analysts | Method and validity checks | CI, power, SRM | “Written down before launch.” | “Directionally positive.” |
| Merchandising / trading | Calendar fit and category learning | Sales, sell-through | “This test pauses during the sale.” | “Ignore the weekly dip.” |
| Brand / marketing | Guardrails they set | Brand and retention metrics | “Nothing goes live that you haven't seen.” | “Conversion is all that matters.” |
| Legal / compliance | Predictable review path | Test-type risk level | “Pre-approved list, 48-hour path for the rest.” | “Everyone else does it.” |
| Customer service | What customers will see | Contacts per 1,000 orders | “Here is what it looks like from Monday.” | “It's only a test.” |
Exhibit 5 shows the guide in action on a single illustrative result. Every audience gets the same number, confidence interval and caveats. What changes is the first sentence: the part of the result that matters to them.
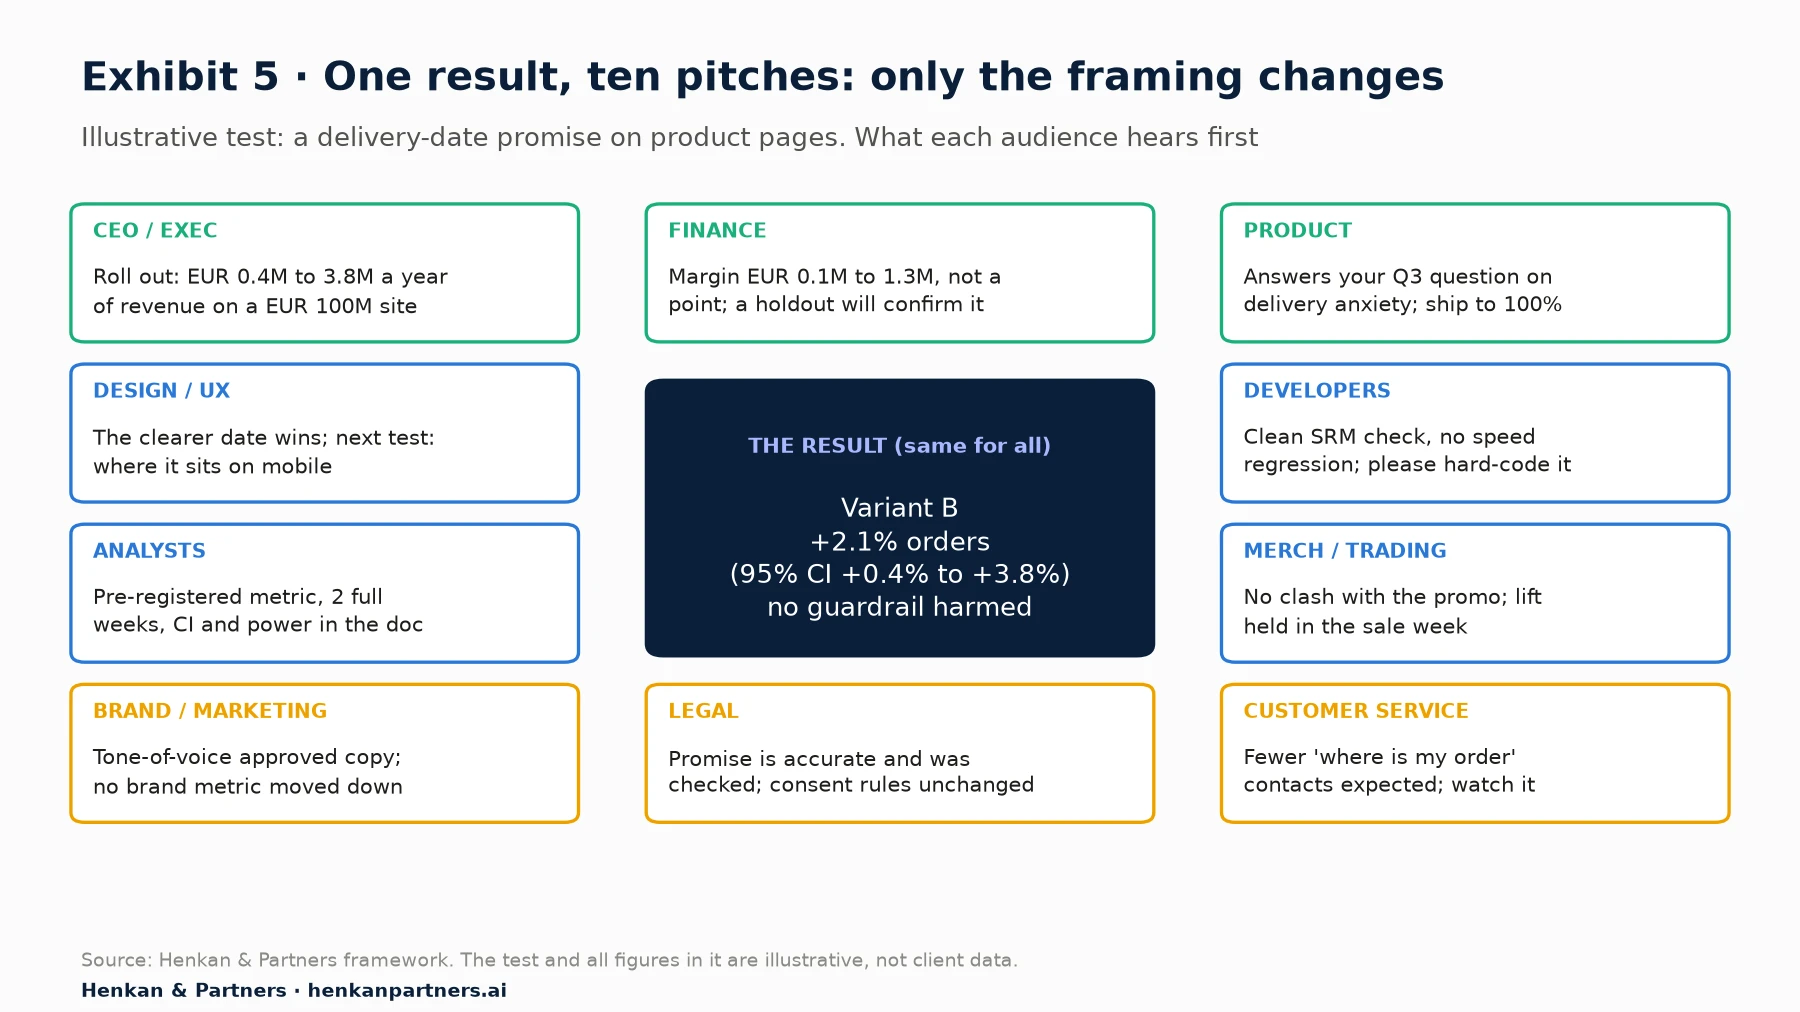
What this shows. The illustrative test adds a delivery-date promise to product pages. The CEO and finance cards use the same confidence interval as the analysts' card, converted into money; neither quotes the 2.1% point estimate as a promise. The customer service card turns the result into an operational heads-up.
Section 9 · Objections
Eight objections come back in every company, and each needs evidence rather than enthusiasm
Each objection tells you which scorecard the speaker is protecting. Exhibit 6 summarises the eight we hear most; the subsections give the longer answer.
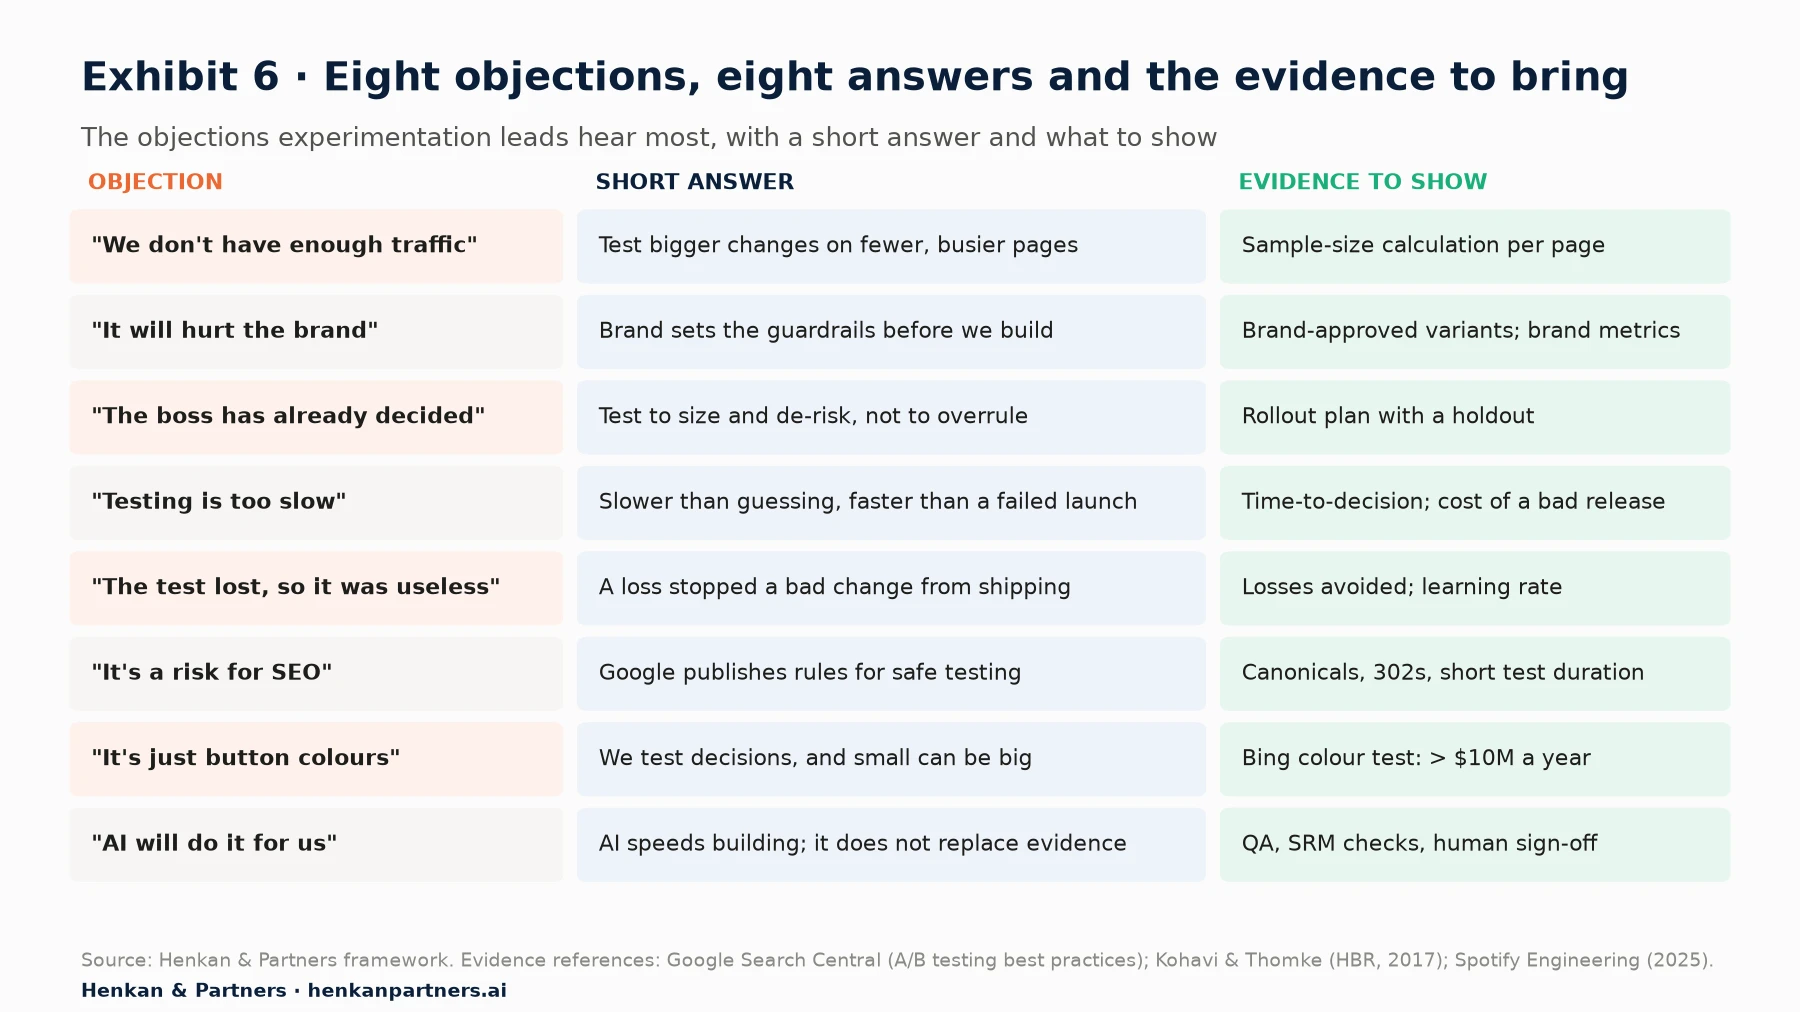
What this shows. None of these objections is foolish. Each contains a real risk: low traffic does produce unreliable tests, careless tests do hurt brands, and long-running tests can create SEO problems. The answer is never “you're wrong”; it is “here is how we handle that risk”.
“We don't have enough traffic”
Sometimes this is true, and saying so builds credibility. Run the numbers per page, not per site: a sample-size calculation shows which pages can detect a realistic effect in four weeks. Then test bigger changes on fewer, busier pages, and use other evidence (research, session replay, surveys) where tests cannot reach. Our guide to sample size and duration covers what to do with low traffic.
Say: “Our product pages can detect a 3% change in four weeks; our FAQ pages cannot, so we'll use research there.” Avoid: “Let's run it anyway and see.”
“It will hurt the brand”
Invite brand to set the guardrails before any design work starts, and give them sign-off on variants. Add a brand-relevant guardrail metric to tests on key pages.
Say: “What would make a variant unacceptable to you? We'll write it into the brief.” Avoid: “It's only for two weeks.”
“The boss has already decided”
Do not position the test as a vote on the decision. Position it as a way to size it, de-risk it and roll it out safely: a staged rollout with a holdout tells the leader how much the decision is worth and catches problems early.
Say: “Let's roll this out as a test, so we can show the board what it delivered.” Avoid: “We need to test whether you're right.”
“Testing is too slow”
Testing is slower than guessing and faster than reversing a failed launch. Measure time-to-decision and shorten it with templates, pre-approved test types and parallel tests. Speed at scale is possible: Thomke reports that Booking.com runs around 25,000 tests a year. Our sibling article on building momentum covers how to raise velocity.
Say: “Four weeks to know, versus six months to find out after launch.” Avoid: “Good science takes time.”
“The test lost, so it was useless”
A losing test that stopped a bad change is a saving. Spotify reports that in the two organisations that run about 80% of its experiments, only about 12% win, but about 64% produce a valid, decision-ready result. Spotify's Confidence team adds that 42% of experiments end with the team deciding not to ship after guardrail metrics detect problems. Report losses avoided alongside wins, and count learnings, not just winners.
Say: “This test stopped a change that would have cut orders; that's the programme doing its job.” Avoid: “It was inconclusive, but directionally positive.”
“It's a risk for SEO”
Google publishes explicit guidance for testing without search harm. Do not cloak (show Googlebot something different from users). Use rel="canonical" on alternate test URLs pointing to the original. Use 302 (temporary) redirects, not 301 (permanent), for redirect tests. Run tests only as long as necessary and remove test code afterwards. Agree these rules with your SEO lead and put them in the QA checklist.
Say: “We follow Google's published A/B testing guidance; here is the checklist.” Avoid: “Google won't notice.”
“It's just button colours”
This objection usually comes from people who have seen a weak programme. First, small can be big: Bing's colour changes were worth more than $10 million a year. Second, show the portfolio: tests on pricing display, navigation, delivery promises, product content and checkout steps. If your backlog really is mostly button colours, the objection is fair and the backlog needs work.
Say: “Here are this quarter's tests by type; most change what customers decide, not what they see.” Avoid: “Every detail matters.”
“AI will do it for us”
AI makes variants and analysis cheaper, which raises the number of tests and therefore the need for good hypotheses, QA and judgement about what to ship. See AI agents in experimentation and why prompt-based experimentation belongs on the C-level agenda.
Say: “AI lets us test more ideas for the same budget; we still decide which ideas and whether the result holds.” Avoid: “AI can't do what we do.”
Section 10 · AI and readouts
AI can draft a readout for each audience, but a human must own every number in it
Large language models are good at rewriting one result for ten audiences: give one your result document and Table 1, and it drafts a CFO memo and a note for customer service in a minute. Testing vendors now ship their own AI agents, Optimizely's Opal among them, and general-purpose models can do the same drafting.
- Invented or rounded numbers. Models can turn a confidence interval of +0.4% to +3.8% into “about 4%”. Every number in a draft must be checked against the source document.
- Overclaiming. Models tend to sound confident. Add an explicit instruction: keep the range, keep the caveats, say “illustrative” where relevant.
- Data exposure and generic voice. Use an approved enterprise tool, not a public one, and edit the draft into your own words.
Our view. Use AI to tailor, not to decide. Generate audience versions only from a finished, reviewed result document, never from raw data, and keep a named person accountable for each message that leaves the team.
Section 11 · What to do next
What to do next
1. Map your stakeholders this week
Place every team on the influence and interest grid in Exhibit 2, with real names. Add one line per person: what they answer for, and what a bad test would cost them. Review it with your sponsor.
2. Write your own one-page language guide
Adapt Table 1 to your company's words: your metrics, your teams, your sensitivities. Share it with everyone who presents results so the programme speaks with one voice.
3. Fix the result template
Rewrite your result template so the first line is the decision, the second is the range, and the third is what it means for the reader. Add a short section for guardrails and caveats. Pair it with the rituals in where to start: champions, sponsors and rituals.
4. Prepare your objection cards
For each of the eight objections in Exhibit 6, write a one-paragraph answer with one piece of evidence from your own company. You can download the Experimentation Culture Kit, which includes a stakeholder map, objection cards, a one-page charter, ritual agendas, a RACI, a health scorecard and a maturity self-assessment.
5. Measure whether the message lands
Track two signals each quarter: the share of results that led to a recorded decision, and how many teams brought test ideas. If either is flat, the conversation needs work. Our article on measuring an experimentation culture covers the full scorecard, and hiring and training an experimentation team covers who should be doing this work. To see how the largest testing companies built the habit, read how Booking.com, Amazon, Microsoft and others experiment at scale. If you want an outside view of how your programme is perceived, talk to us.
Disclosure: Henkan & Partners runs experimentation programmes and fractional experimentation teams for clients, including stakeholder workshops of the kind described here.
FAQ
Frequently asked questions about experimentation stakeholder communication
Frequently asked questions
What is experimentation stakeholder communication?
It is the practice of explaining tests, results and the experimentation programme to each group that funds, builds, approves or is affected by them, in the terms they are accountable for, without changing the result. It covers the case for a test, the risks while it runs and the decision afterwards.
How do you explain A/B testing to executives?
Lead with decisions and risk, not test counts. Explain that most ideas lose when tested (about one-third of tested ideas at Microsoft had negative results), and that testing is how the company finds out before customers do. Give value as a range, and bring one decision you need from them.
How do you get stakeholder buy-in for experimentation?
Map stakeholders by influence and interest, learn what each team answers for, and build their concerns into the process before they raise them: brand guardrails, a legal review path, a QA checklist for engineering, a shared calendar for trading. Then report decisions and losses avoided, not just wins.
How do you present A/B test results to stakeholders?
Put the decision in the first line, the confidence range in the second and what it means for the reader in the third. Keep the same number and caveats for every audience; change only the framing and the unit, such as margin for finance or contacts per thousand orders for customer service.
What do you say when someone says the test lost so it was useless?
Explain that a losing test that stops a bad change is a saving. Spotify reports that about 12% of experiments win in its two main R&D organisations, but about 64% produce a decision-ready result, and 42% end with a decision not to ship after guardrail metrics flag a problem. Report losses avoided alongside wins.
Does A/B testing hurt SEO?
Not if you follow Google's published guidance: do not cloak, use rel=canonical on alternate test URLs, use 302 rather than 301 redirects, and run tests only as long as necessary before removing test code.
Can AI write stakeholder reports for A/B tests?
AI can draft audience-specific versions of a finished result quickly, but it can round or invent numbers and overstate confidence. Generate drafts only from a reviewed result document, check every number, and keep a named person accountable for each message.
Key terms
- Stakeholder
- Anyone who funds, builds, approves or is affected by an experiment. Matters because each stakeholder can speed up or block the programme.
- Power-interest matrix
- A grid, from Mendelow (1991), that sorts stakeholders by power and interest into four groups. Matters because it sets how much detail each group gets and how often.
- HiPPO
- Highest Paid Person's Opinion: a decision based on seniority rather than evidence. Matters because testing exists to give such decisions better evidence, not to embarrass the person.
- Win rate
- The share of experiments in which a variant beats the control on the primary metric. Matters because published win rates of 8% to 33% show that most ideas fail, which reframes testing as risk control.
- Learning rate
- Spotify's measure of experiments that produce a valid, decision-ready result, whether a win, a caught regression or a conclusive neutral. Matters because it values losses avoided, not only wins.
- Confidence interval
- The range of effects compatible with the data at a stated confidence level. Matters because reporting a range rather than a point estimate keeps every audience honest about uncertainty.
- Guardrail metric
- A metric that must not get worse, such as page speed, error rate or contact rate. Matters because it lets brand, engineering and service teams see that tests protect what they answer for.
- Holdout group
- A share of users kept out of all shipped changes for a period. Matters because it lets finance verify the programme's real cumulative impact.
- Sample ratio mismatch (SRM)
- An unexpected imbalance between the number of users in each test group. Matters because it signals a broken test whose result should not be read.
- Time-to-decision
- The time from idea approval to a recorded decision. Matters because it answers the 'testing is too slow' objection with a measurable number.
- Cloaking
- Showing search engine crawlers different content from what users see. Matters because Google treats it as spam, so A/B tests must avoid it.
- 302 redirect
- A temporary HTTP redirect. Matters because Google recommends it over a permanent 301 for redirect tests, to keep the original URL indexed.
- Result readout
- The short document or presentation that reports a test and its decision. Matters because its first line decides whether busy stakeholders act on the result.
Sources
All sources were checked in October 2026. Optimizely figures are vendor data from its customer base. PwC figures are self-reported survey data from 2016 and are shown as directional. Win rates come from companies' own publications and are not defined identically. Exhibits 2, 5 and 6 and Table 1 are Henkan & Partners frameworks; Exhibit 5 uses an illustrative test with fictional figures, not client data.
- Kohavi, R. & Thomke, S. (2017). The Surprising Power of Online Experiments. Harvard Business Review.
- Thomke, S. (2020). Building a Culture of Experimentation. Harvard Business Review.
- Kohavi, R., Henne, R. M. & Sommerfield, D. (2007). Practical Guide to Controlled Experiments on the Web: Listen to Your Customers not to the HiPPO. KDD 2007.
- Kohavi, R., Deng, A. & Vermeer, L. (2022). A/B Testing Intuition Busters. KDD 2022.
- Optimizely (n.d.). Top 10 takeaways from running 127,000 experiments. Vendor data.
- Optimizely (n.d.). Experiment Planning agent (Optimizely Opal). Product documentation.
- Bellato, M., Schultzberg, M. & Ankargren, S. (2025). Beyond Winning: Spotify's Experiments with Learning Framework. Spotify Engineering.
- Rydberg, J. (2026). The Real ROI of Experimentation. Spotify Confidence.
- PwC (2016). Data and Analytics Survey 2016: Big Decisions, UK infographic.
- PwC (2016). Data-driven: Big decisions in the intelligence age.
- Google Search Central (n.d.). A/B testing best practices for Search.
- CNIL (2025). Cookies : solutions pour les outils de mesure d'audience.
- ICAI (n.d.). Extra reading notes on Mendelow Matrix. Summary of Mendelow (1991).