Focus
Finding UX Friction in GA4: Drop-offs, Devices, Landing Pages and Site Search Step by Step
Alexandre Suon · 2026-10-02
UX friction analysis in GA4 means using Google Analytics 4 to find the places where people struggle on your site: the funnel step they abandon, the device or browser that fails, the landing page that does not engage, the search that returns nothing, the form they give up on. This step-by-step guide for UX and product designers shows the exact click paths, how to read each result without fooling yourself, and how to rank what you find by the revenue at stake.
Executive summary
- GA4 locates friction; it does not explain it. Use it to find where and for whom things go wrong, then use replay, surveys and usability tests to learn why. Treat every GA4 finding as a lead, not a verdict.
- Start with a funnel exploration, then split it by device and browser. The step with the largest abandonment tells you where to look. A single browser or operating system far below its peers is usually a defect, which is the cheapest friction to fix.
- Walk paths backwards from bad outcomes. A path exploration with an ending point, such as a help page, a contact page or an error event, shows what people did just before. In our illustrative example, 47% of delivery-help views came straight from the shipping step.
- Site search and forms are where users tell you what is wrong, if you track them properly. GA4's enhanced measurement captures the search term and form starts and submits, but not zero-result searches or field errors. Baymard finds 56% of benchmarked sites have mediocre or worse search UX (research vendor data).
- Check the settings before you trust the numbers. Explorations only reach back as far as your data retention setting (two or 14 months on standard properties, so check which), can be sampled above 10 million events on standard properties, and hide small rows behind thresholds.
- Rank friction by money at stake, discounted by confidence. A simple score, affected sessions × gap × value × confidence, turns a list of complaints into a priority order and routes each item to fix, research or test.
Section 1 · Definitions
GA4 tells you where friction is and who it hits, so treat each finding as a lead to investigate
This is the third article in our path The ABC of GA4 for UX & Product Designers. The first, GA4 for UX and product designers, covers which questions GA4 can and cannot answer about a design. The second, how designers should ask for GA4 tracking, shows how to request the events this article relies on. Here we move to the analyses themselves: what to click, what to look at, and what to do with the result.
UX friction analysis is the practice of using behavioural data to find points in a digital journey where people slow down, repeat themselves, detour or give up, and to size how much each of those points costs. In GA4, it combines funnel and path explorations, device and browser breakdowns, landing page engagement, site search and form events.
Google Analytics is the default tool for this work simply because it is everywhere. W3Techs finds Google Analytics on 47.2% of all websites it monitors, an 82.7% share of sites that use a traffic analysis tool it tracks (data for 1 October 2026). So the data is usually there already. What is missing is a method.
That method has to respect one limit. GA4 records events: a page view, a click on add to cart, a form submit. It can tell you that 61% of mobile users who entered payment details went on to buy, against 80% on desktop. It cannot tell you that the card field rejected spaces, or that the 3-D Secure pop-up opened behind the browser tab. Those answers come from watching and asking people. Our companion article on combining GA4 with qualitative research covers that second half.
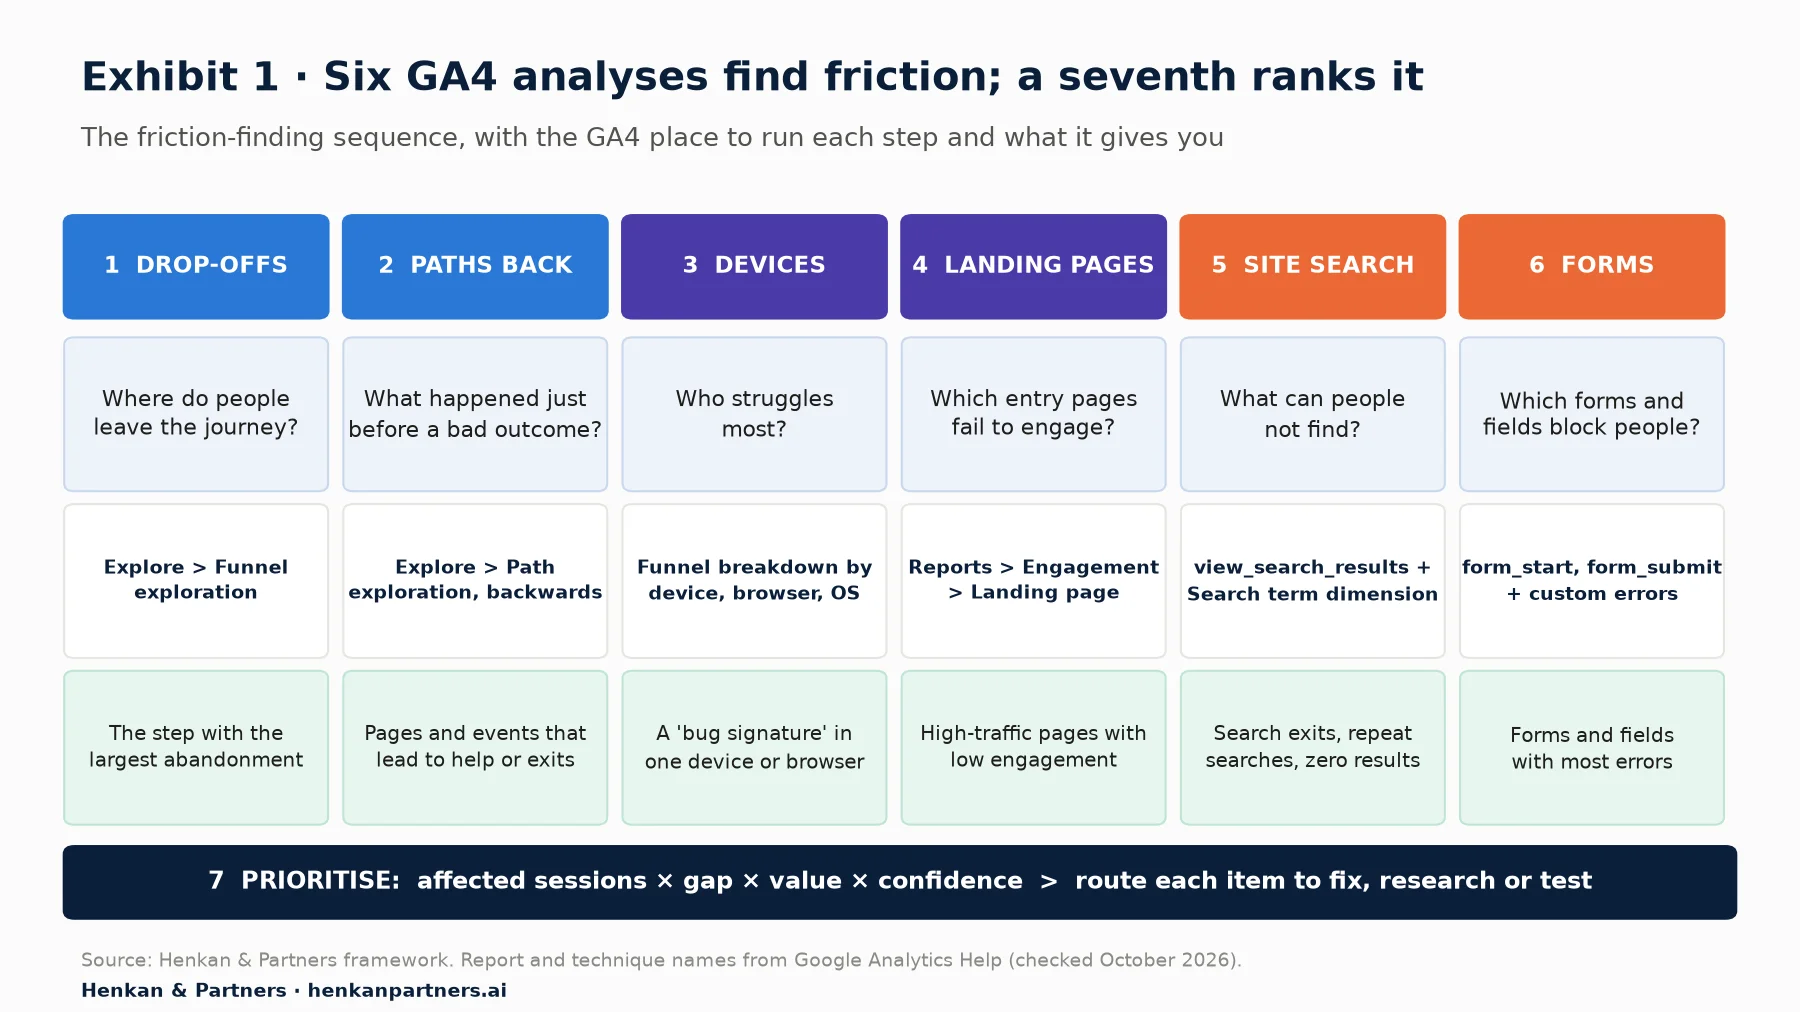
What this shows. Each column is a question you can answer in GA4 in under an hour once tracking is in place. The order matters: the funnel tells you which step to study, paths and breakdowns tell you who and what surrounds it, and search and forms add the user's own words and errors. The bottom bar is where most teams stop too early: a list of problems is not a plan until it is ranked.
For designers. You do not need to be an analyst to run these six analyses. You need access to the property (an exploration you create stays yours until you share it, so you can experiment without breaking anyone's reports), an hour of focus, and a clear question written down before you open GA4.
For leaders. Ask your design team for a monthly friction review built on these six analyses. It costs little and replaces opinion-led redesign debates with a ranked list.
Section 2 · Before you start
Five settings decide whether a friction analysis can be trusted, so check them before you open Explore
Most "GA4 is wrong" moments in design reviews come from settings, not from users. Spend ten minutes on the checks below, or ask your analyst. If you need a full health check, our GA4 audit checklist for e-commerce goes further.
| Setting | Where to check it | Why it matters for friction analysis |
|---|---|---|
| Data retention | Admin > Data settings > Data retention | Explorations and funnel reports only reach back as far as this setting. Standard properties can keep event data for 2 or 14 months (Analytics 360 for longer); on 2 months, explorations cannot look back further. Standard aggregated reports are not affected. |
| Enhanced measurement | Admin > Data streams > your web stream > Enhanced measurement | Switches on page views, scrolls, outbound clicks, site search, form interactions, video engagement and file downloads without code. Check that site search and form interactions are on. |
| Site search parameters | Enhanced measurement > Site search settings | GA4 looks for the URL query parameters q, s, search, query and keyword by default. If your search URL uses another parameter, add it or no searches will be recorded. |
| Key events | Admin > Data display > Events (star icon) | Key events (formerly called conversions) are what GA4 uses for key event rates. Make sure purchase or your lead event is marked. |
| Custom dimensions | Admin > Data display > Custom definitions | Form parameters such as form_id and any custom error parameters only appear in reports once registered. Data shows after 24 to 48 hours and is not backfilled. |
Three platform behaviours explain most of the remaining surprises. First, sampling: explorations are sampled when a query exceeds 10 million events on a standard property (up to 1 billion on Analytics 360), and the data quality icon tells you what percentage of data was used. Second, thresholds: GA4 hides rows when counts are low enough to risk identifying individuals, for example with demographic or search query data. Google says these are system defined and cannot be adjusted. Third, consent: visitors who refuse analytics cookies are missing or modelled, so absolute counts are lower than reality. For the mechanics, see how GA4 works and our guide to user consent in e-commerce.
None of these stop you finding friction. Friction analysis is about relative differences: one step versus another, mobile versus desktop, this landing page versus its peers. Those comparisons survive missing data much better than absolute totals do, as long as you compare like with like over the same date range.
Section 3 · Drop-offs
Start with a funnel exploration, because the step with the largest abandonment tells you where to look
The funnel is the backbone of every friction analysis. Our deep dive on funnel and cohort analysis explains the settings that change a funnel's answer. Here is the short version for designers, with the click path.
- Open a funnel. Go to Explore, start a blank exploration and pick Funnel exploration as the technique (or use the Funnel exploration template).
- Define the steps. Use events your site already sends. For a shop, the GA4 recommended e-commerce events work well: view_item, add_to_cart, begin_checkout, add_shipping_info, add_payment_info, purchase. You can define up to 10 steps.
- Keep it closed. Leave Make open funnel off so everyone must start at step one. A closed funnel answers "of the people who started, where did they leave?", which is the friction question.
- Read abandonment, not only completion. The table shows completion rate, abandonments and abandonment rate for each step. Sort mentally by abandonment rate, then by the number of people abandoning.
- Turn on next action. It shows the Top 5 next actions after each step. If the next action after begin_checkout is often a page view of your delivery or returns page, you have a lead.
- Switch to the trended funnel. A step whose completion rate falls suddenly on one date is almost always a release, a broken tag or a third-party outage, not a change in human behaviour.
Two rules from Google's documentation matter for designers. If a user completes the funnel several times in the date range, only the first sequence is reported. And you can right-click in the funnel table to create segments from the data, which lets you take the people who abandoned a step into a path exploration or a free-form table for a closer look.
How to read what you see
Big drop-offs are not automatically friction. The first step of an e-commerce funnel, from product view to add to cart, always loses most people because most visitors are browsing. What matters is a step that loses more than it should, compared with three references: the same step on another device, the same step last month, or a similar step elsewhere on the site.
Our view. In our experience, the step everyone blames (usually payment) is not always the one that leaks most money. Size every step before you choose, using the impact score in Section 10. If a step is broken for one browser, fix it first; it is cheaper than any redesign.
Section 4 · Paths backwards
Walk paths backwards from help pages, errors and exits to see what pushed people there
A funnel tells you that people left a step. A backward path tells you what they did just before something you care about. GA4's path exploration can start from a starting point and go forward, or from an ending point and go backward, but not both at once. For friction, the ending point is the interesting one.
Click path
- Go to Explore and choose the Path exploration template.
- Click in the ENDING POINT box (a path exploration takes a starting point or an ending point, not both).
- Choose a node type and value. Good friction endings are a help or contact page (node type page path and screen class or page title and screen name), a custom error event such as form_error, or a second view_search_results in the same session.
- Read the columns from right to left. By default GA4 shows the top 5 nodes per step; click + More to show up to 20.
- Switch on unique nodes only so that page refreshes and repeated events do not fill the columns.
- Apply a segment, such as mobile users or users who abandoned a funnel step, before you draw conclusions. Google applies segments to the event stream before the path is calculated.
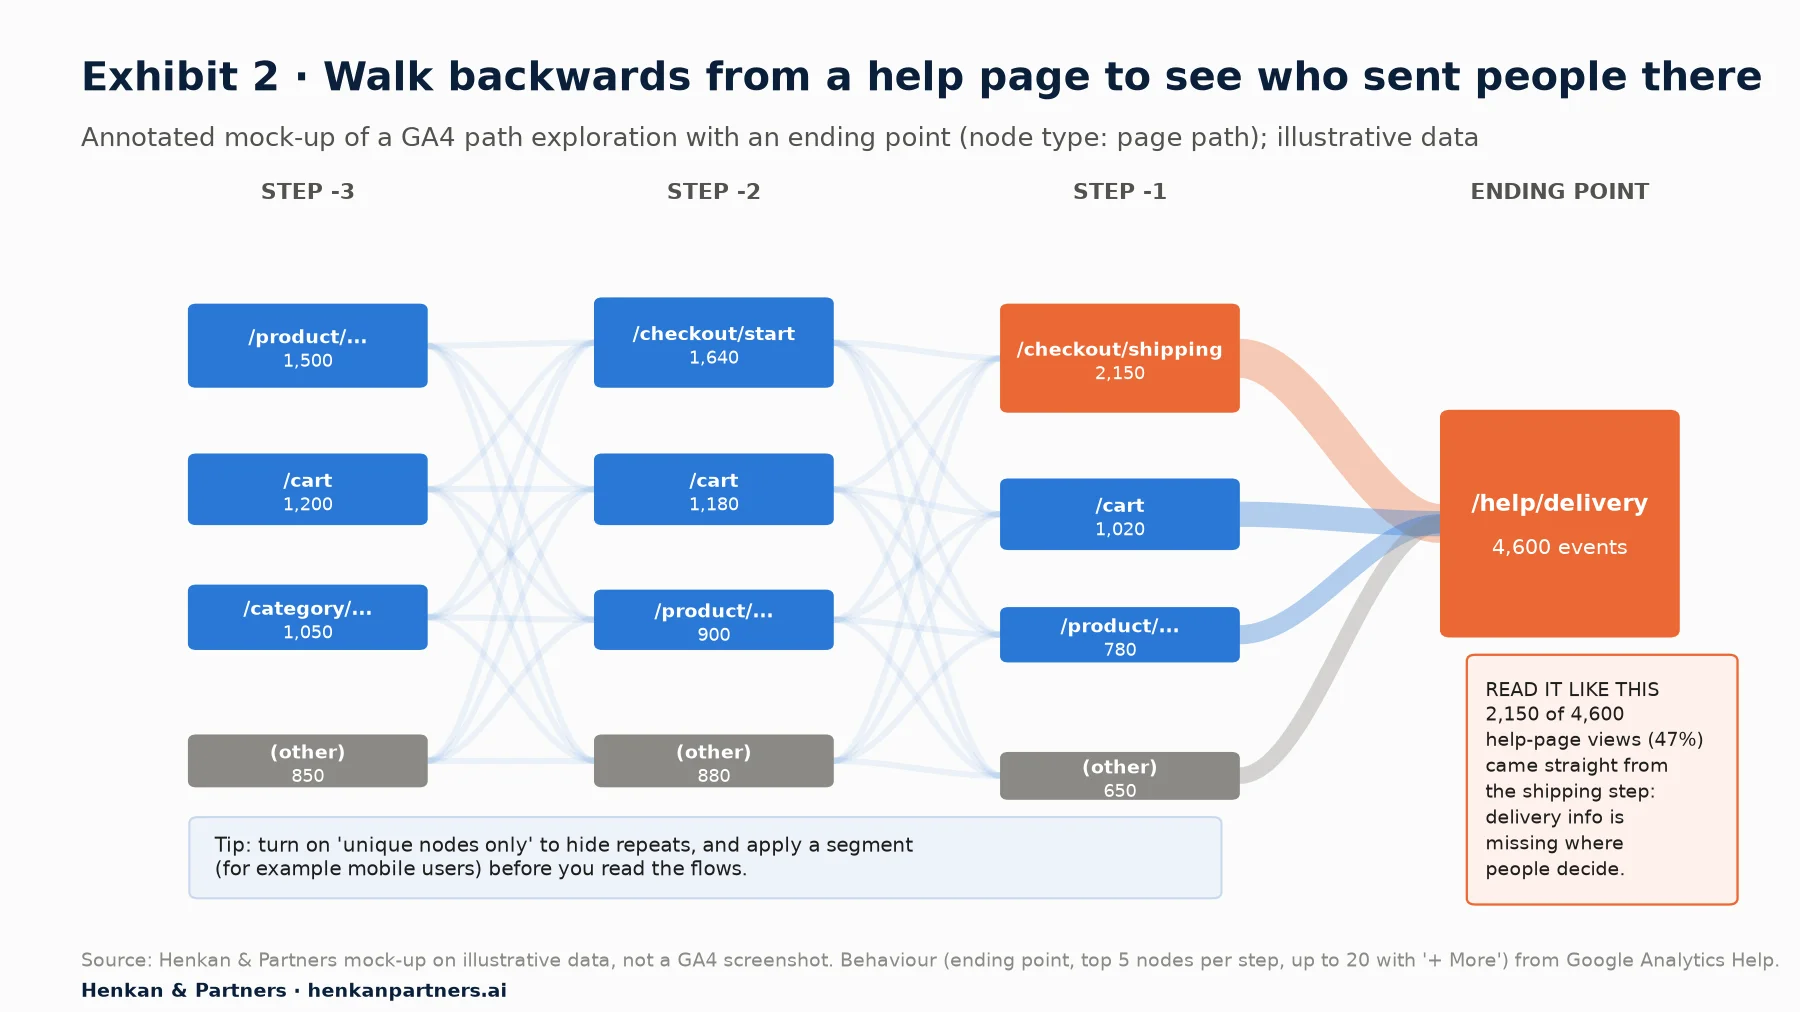
What this shows. In this illustrative month, almost half of all visits to the delivery help page came directly from the shipping step of checkout. People were trying to answer a question the checkout should have answered on the spot: when will it arrive and how much will it cost. The design response is to bring delivery dates and costs into the shipping step, then measure whether help-page detours and shipping-step abandonment both fall.
Three other backward paths are worth saving as templates. Contact or chat pages: what do people do before they ask for help? Error events: which pages and actions precede a payment or validation error? Exits from key templates: for exits, use a free-form exploration instead, with page path and screen class as rows and Exits as a metric. Google defines exits as how many times the last event in a session happened on a page or screen, and entrances as how many times the first one did.
Remember that a new session starts after 30 minutes of inactivity by default, and that when a path spans several sessions GA4 aggregates them. A backward path is a list of common predecessors, not a replay of one person's journey.
Section 5 · Devices and browsers
Break every funnel down by device, browser and screen size, because friction is rarely spread evenly
Once you know which step leaks, ask who it leaks for. In the funnel exploration, drag a dimension into Breakdown. Start broad and go narrow:
- Device category (desktop, mobile, tablet). Keep tablets separate; lumping them with phones hides phone problems.
- Browser and Operating system with version. This is where defects show up: a payment widget that fails on one browser, a date picker that breaks on an older operating system.
- Screen resolution or Device model. Useful when a sticky element or a cookie banner covers a button on small screens.
- Session default channel group. Compare devices within the same channel, otherwise you are comparing traffic mix, not design.
Google notes one behaviour that matters here: with a breakdown, users are attributed to the first instance of the breakdown value that applies to them. If your site recognises people across devices, for example after login, someone who starts on a phone and finishes on a laptop is counted under mobile. Cross-device journeys are real, so expect mobile completion to look a little worse than it is.
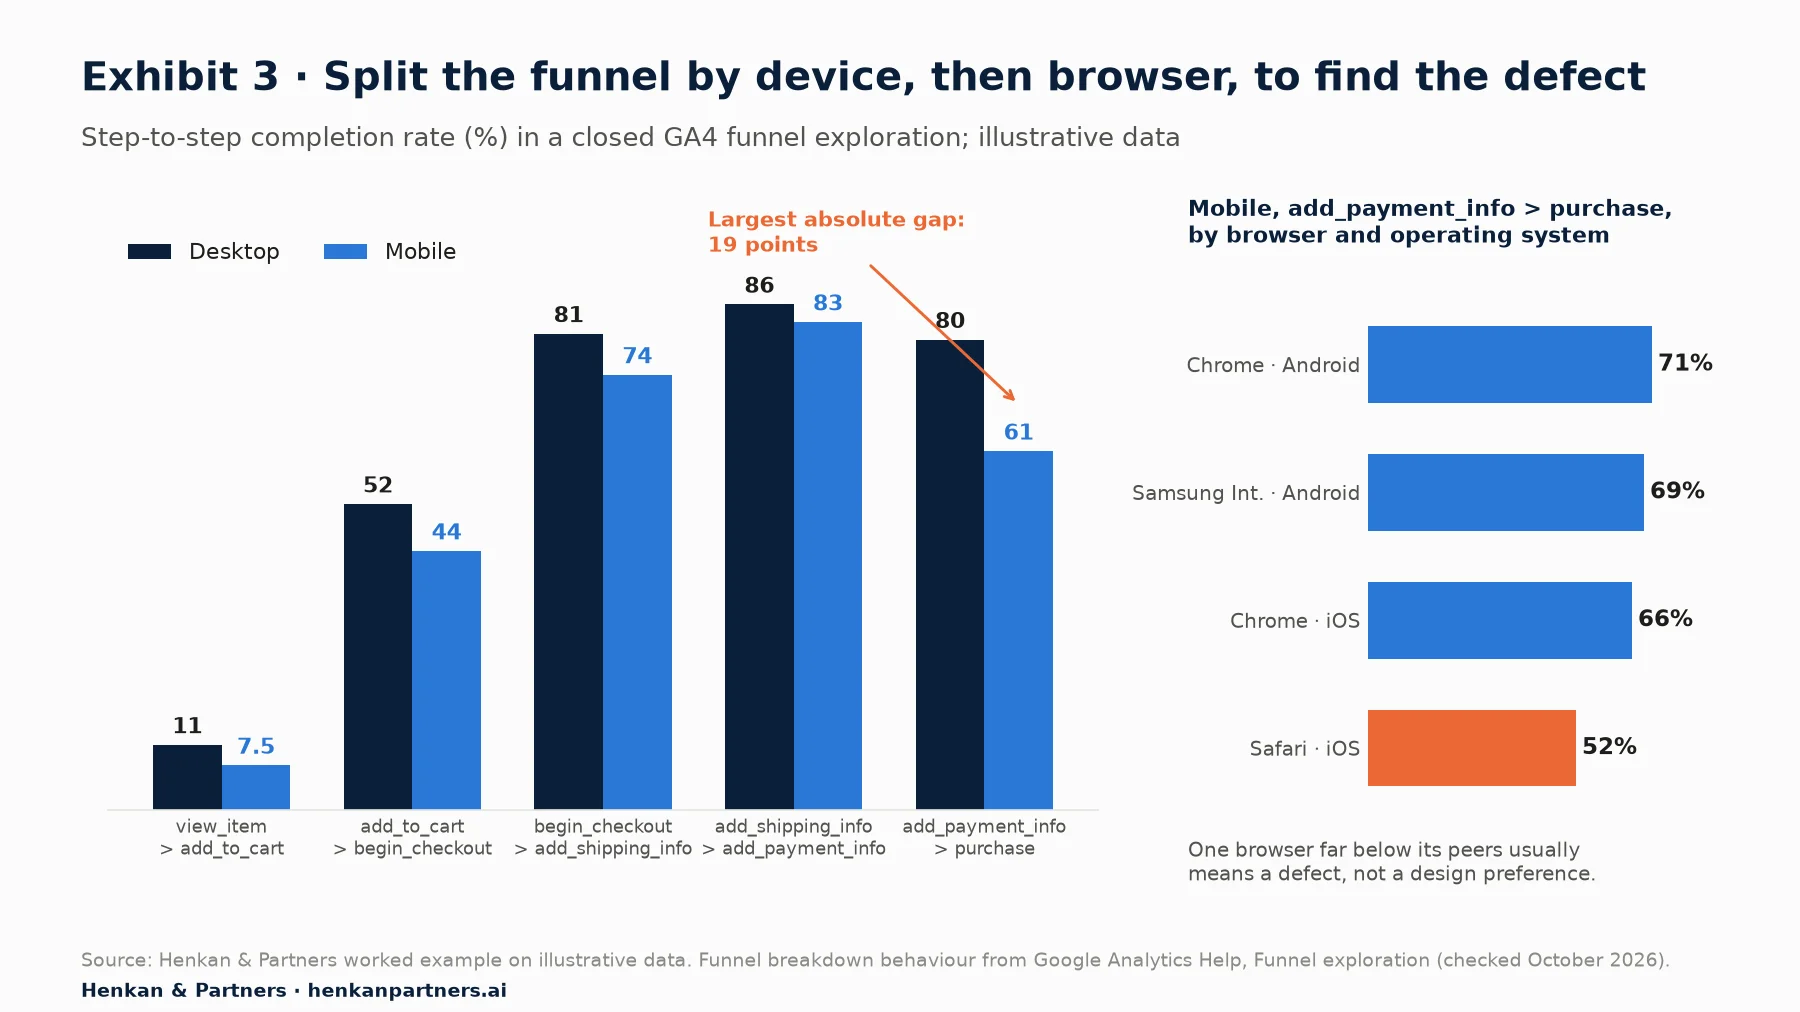
What this shows. Mobile trails desktop at every step in this illustrative shop, which is normal. The final step is different: a 19-point gap where the others are 3 to 8 points. Splitting mobile by browser shows the gap is concentrated in Safari on iOS, at 52% against 66% to 71% for the other mobile browsers. That pattern, one browser far below its peers at one step, is what we call a bug signature. It points to a defect in a payment component, a redirect or a pop-up, not to users who prefer desktop.
Before you call it a bug, rule out the boring explanations: a payment method only offered on one platform, a campaign that sent low-intent iPhone traffic, or small numbers. Then reproduce it on a real device. Our mobile UX audit for e-commerce is step 5 of this learning path and covers how to test on real phones and put a value on the mobile gap.
For designers. Keep a short list of the five device and browser combinations that bring most of your traffic, and check every new design on them before release. GA4 tells you which five they are: free-form exploration, rows device category, browser and operating system with version, metric sessions.
For leaders. A bug signature is the highest-return item in any friction review. Ask for one funnel-by-browser check after every major release.
Section 6 · Landing pages
Judge landing pages on engagement and the next step, not on bounce rate alone
Landing pages are where first impressions fail. GA4 has a ready-made report: Reports > Engagement > Landing page. Its default metrics are sessions, active users, new users, average engagement time per session, key events and total revenue. If you cannot see it, an editor can add it back to the navigation.
Add two metrics with the pencil icon (Customize report, as the interface spells it; changing a report needs the Editor role, otherwise build the same view in Explore): engagement rate and session key event rate. Google defines an engaged session as one that lasts longer than 10 seconds, has a key event, or has two or more page or screen views. Bounce rate in GA4 is simply the share of sessions that were not engaged. The 10-second timer can be changed under Admin > Data streams > your stream > Configure tag settings > Settings > Show all > Adjust session timeout, so check what your property uses before comparing with another site.
Build a comparison that isolates design
The standard report mixes traffic sources, so a page that receives cheap social traffic will always look worse. For a design view, build a free-form exploration:
- Rows: Landing page + query string, then Device category.
- Columns: Session default channel group (or filter to a single channel).
- Values: sessions, engagement rate, session key event rate, total revenue.
- Filter out pages with fewer sessions than you consider meaningful (for example a few hundred a month), so the list is not dominated by noise.
- Sort by sessions, then scan for pages whose engagement rate is clearly below other pages of the same template and channel.
Compare like with like. A product page should be compared with other product pages from the same channel, not with the homepage. The useful output is a short list: high-traffic landing pages whose engagement or key event rate sits well below the median for their template. Those are candidates for a closer look with replay, scroll maps and a one-question survey.
Two cautions. Pages that answer a question quickly, such as a store-hours page, can be "unengaged" and still successful. And a page with a high engagement rate but a low key event rate is not a landing problem; it is a next-step problem, which your funnel will show. For which custom dimensions make landing page analysis sharper, such as page template or content type, see which custom dimensions to collect.
Section 7 · Site search
Site search is the closest thing GA4 has to customers telling you what they cannot find
Every search is a user typing their need in their own words. Baymard's large-scale testing finds that roughly half of users turn to search as their preferred way to find products. When search fails, they leave or search again. GA4 can show both, if you set it up.
What GA4 captures out of the box
With enhanced measurement on, GA4 sends a view_search_results event when a page loads with a search query parameter in its URL (q, s, search, query or keyword by default), with the query stored in the search_term parameter. The term appears in the Search term dimension. The most flexible place to analyse it is Explore.
- Top terms. Free-form exploration, rows Search term, values event count and total users, filtered to event name = view_search_results. This is your users' vocabulary; compare it with your navigation labels. Google's guidance on avoiding personally identifiable information singles out site search terms as a risk, so ask your developers to strip email addresses and phone numbers before they reach GA4.
- Search exits. Free-form exploration with page path and screen class as rows, filtered to your search results path, with Exits as a metric. A results page that is often the last page of a session is a page that did not help.
- Repeat searches. Path exploration with view_search_results as the starting point and event name as the node type. A large share of second and third view_search_results nodes means people are reformulating. Then look at which terms come first.
- Search to purchase. Compare the session key event rate of sessions with a search against those without, within the same device and channel.
What GA4 does not capture is the most important signal: whether the search returned anything useful. Enhanced measurement logs the term, not the number of results. To find zero-result searches, ask developers to add a parameter such as the result count to the search event, as described in how designers should ask for GA4 tracking. Without it, you can only infer failure from exits and repeats.
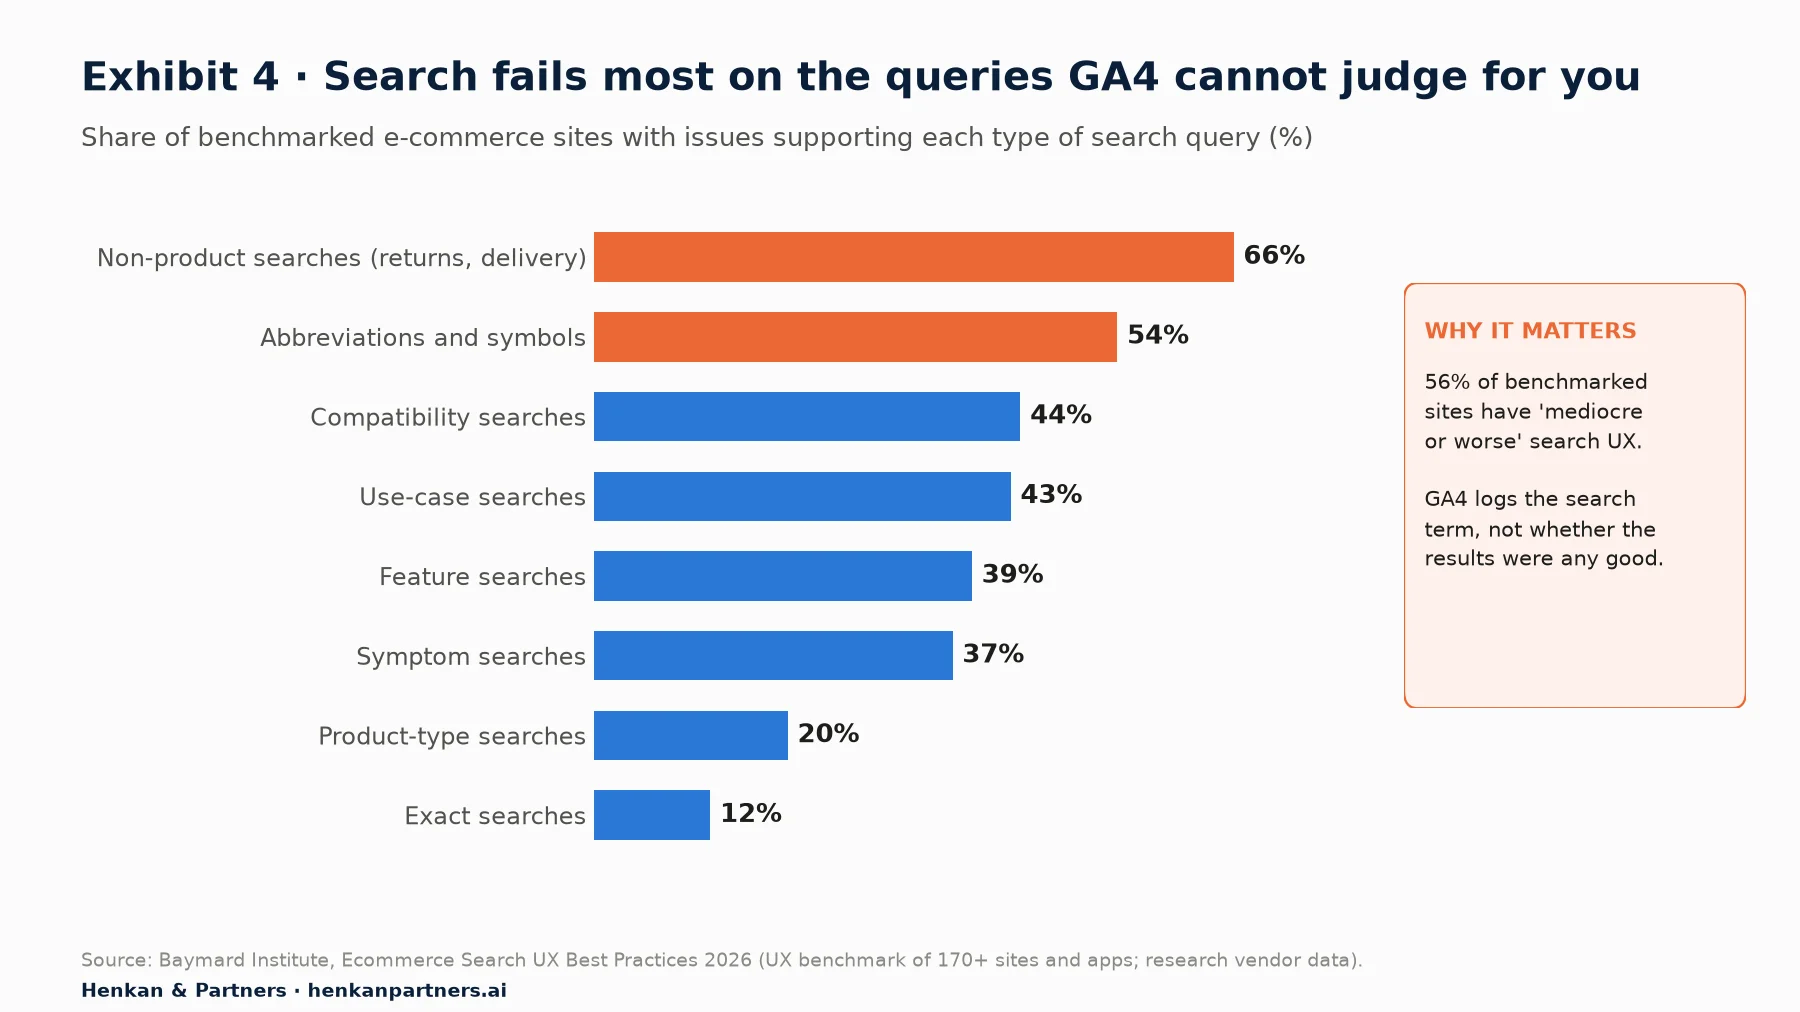
What this shows. Exact product-name searches are handled well by most sites. Failures cluster in searches phrased the way people think: by feature, use case, compatibility, symptom or a non-product question such as returns or delivery. These are exactly the terms you will find in your GA4 search term list. Group your top 200 terms into these types and test a handful of each on your own site; the failure types you see will tell you whether the fix is synonyms, filters or content.
For designers. Export your top search terms every month and tag each as product, feature, use case, compatibility, symptom or non-product. Non-product searches ("returns", "delivery", "size guide") are navigation feedback: the information exists but people cannot find it.
For leaders. Ask for the share of searches with no results as a standing metric. It needs one parameter from engineering and gives you a direct read on catalogue and search quality.
Section 8 · Forms
Measure forms field by field, because form_start and form_submit only tell you that people gave up
Forms are where effort turns into commitment, and where small design choices cost the most. Baymard's checkout benchmark counts an average of 23.48 form elements in a US checkout, against the 12 to 14 its usability testing suggests an optimal flow needs (research vendor data).
What enhanced measurement gives you
The form interactions option of enhanced measurement sends form_start the first time a user interacts with a form in a session and form_submit when it is submitted, with the parameters form_id, form_name and form_destination, plus form_submit_text on submit. Google notes you can only use these parameters in reports once you create custom dimensions for them.
Once form_id is registered, a free-form exploration with rows form ID, columns event name (filtered to form_start and form_submit) and event count as the value gives a crude completion ratio per form. Divide submits by starts.
Be careful with it. In our experience, the automatic form events can fire on forms you do not care about, such as the search box or a newsletter field, can count a submit even when validation then fails, and can miss forms built without a standard form element, which is common in single-page apps and checkouts. Treat the ratio as a smoke alarm, not a measurement. Check it against what you see in a few replays before you report it.
What you need to ask for
Real form analysis needs three custom signals, specified in how designers should ask for GA4 tracking:
- A validation error event (for example form_error) with the form name, the field name and an error type such as invalid_format or required. Never send what the user typed: that can be personal data, and Google's policy is that no data Google could recognise as personally identifiable information (PII) may be sent to Analytics.
- A field-level step for long forms, or the existing checkout events (begin_checkout, add_shipping_info, add_payment_info) as funnel steps for checkout.
- A success event fired by the confirmation, not by the click on submit, so that failed submissions do not count as completions.
With those in place, rank fields by errors per form start, and run a backward path from form_error to see which step and device produces the most. Fields with high error rates are usually format problems (dates, phone numbers, postcodes) that a design change can remove.
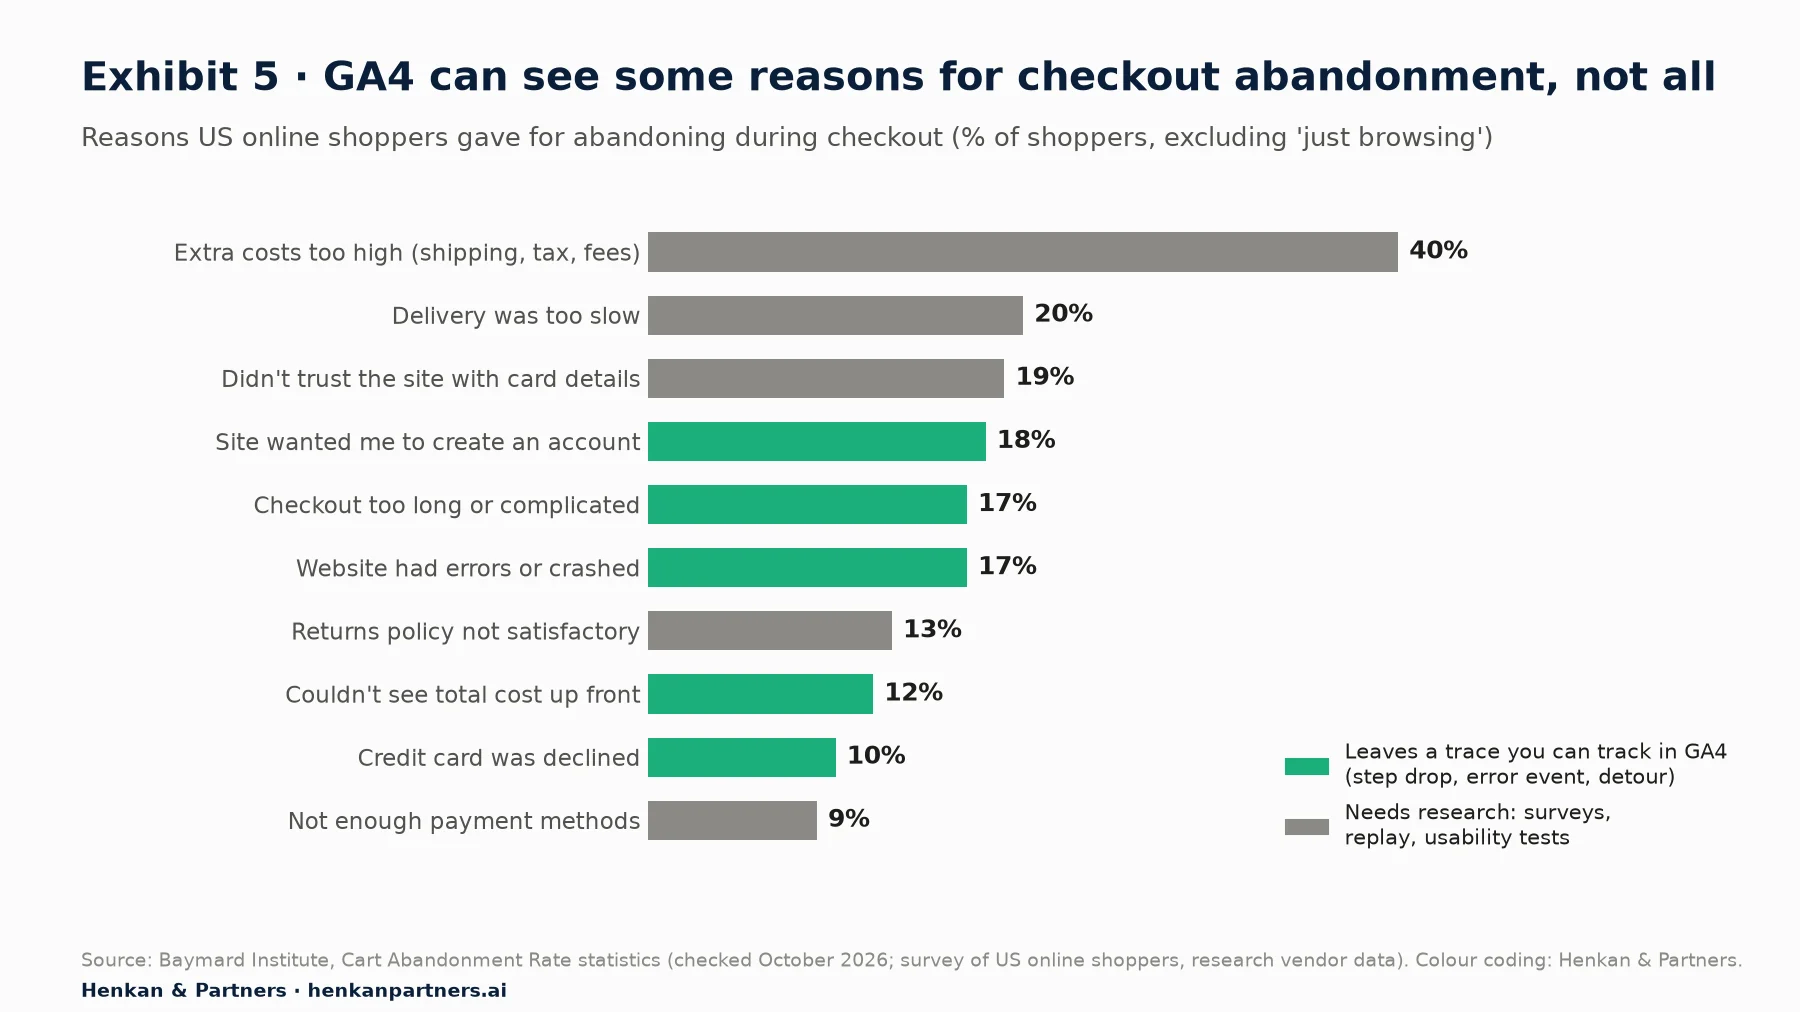
What this shows. Half of the reasons shoppers give leave a trace you can find in GA4 if you track the right events: a drop at the account step, an error event, a detour to a delivery or pricing page, a declined payment. The rest, such as costs being too high or not trusting the site, are opinions that analytics cannot see. Those need a survey or interviews, which is why GA4 is half of a friction analysis, never all of it. Baymard's documented average cart abandonment rate across 50 studies is 70.22%, so most abandonment is normal; your job is to find the part that is design.
Section 9 · Segment comparisons
Compare segments before you redesign, so you fix design friction and not traffic mix
A page that converts badly for new visitors from paid social and well for returning customers does not need the same fix as a page that fails everyone. Before you call something friction, compare at least three splits: new versus returning, channel, and device.
You have two tools. In standard reports, use the comparison icon at the top right of a report to add a comparison (for example mobile only versus desktop only); GA4 lets you save up to 200 comparisons per property. In explorations, build segments: up to 10 per exploration, and up to 4 applied side by side in one technique. The segment overlap technique tells you whether two groups are really different people.
- Same step, different segments. If the gap only exists for one channel, it may be an expectation problem created by the ad, not the page.
- Same segment, before and after. If a step broke on a date, look for a release, a consent banner change or a tag change on that date first.
- Small segments. A segment with a few hundred users will swing by several points from week to week by chance alone. Wait for more data or widen the date range before acting.
Our view. Mix shifts are the most common source of false friction we see. A campaign that doubles mobile social traffic will "break" your mobile funnel overnight without any change to the site. Our funnel and cohort analysis deep dive explains how to put a confidence interval on a segment comparison.
Section 10 · Prioritisation
Rank friction by revenue at stake, then send each item to fix, research or test
After an afternoon in GA4 you will have more problems than capacity. A simple score turns the list into a priority order. It is a Henkan & Partners framework, deliberately rough, and it works because it forces you to write your assumptions down.
Revenue at stake per month = affected sessions per month × gap in conversion × value per conversion
Priority score = revenue at stake × confidence (0.1 to 1.0)

Illustrative: 6,000 Safari iOS sessions reach payment × (about 69% peer average − 52%) × €85 = €86,700 a month; × confidence 0.9 = €78,030
- Affected sessions: how many sessions reach the friction point each month (from the funnel, path or landing page analysis).
- Gap: the difference between the current rate and a realistic reference, such as the same step on other browsers, the template median, or last quarter. Never use an external benchmark here.
- Value per conversion: average order value for purchase steps; a lower value for upstream steps, such as the probability that an add-to-cart becomes an order times average order value.
- Confidence: how sure you are that the gap is caused by design and is fixable. A clear bug signature earns 0.8 to 1.0; a device gap that may be partly human behaviour earns 0.3.
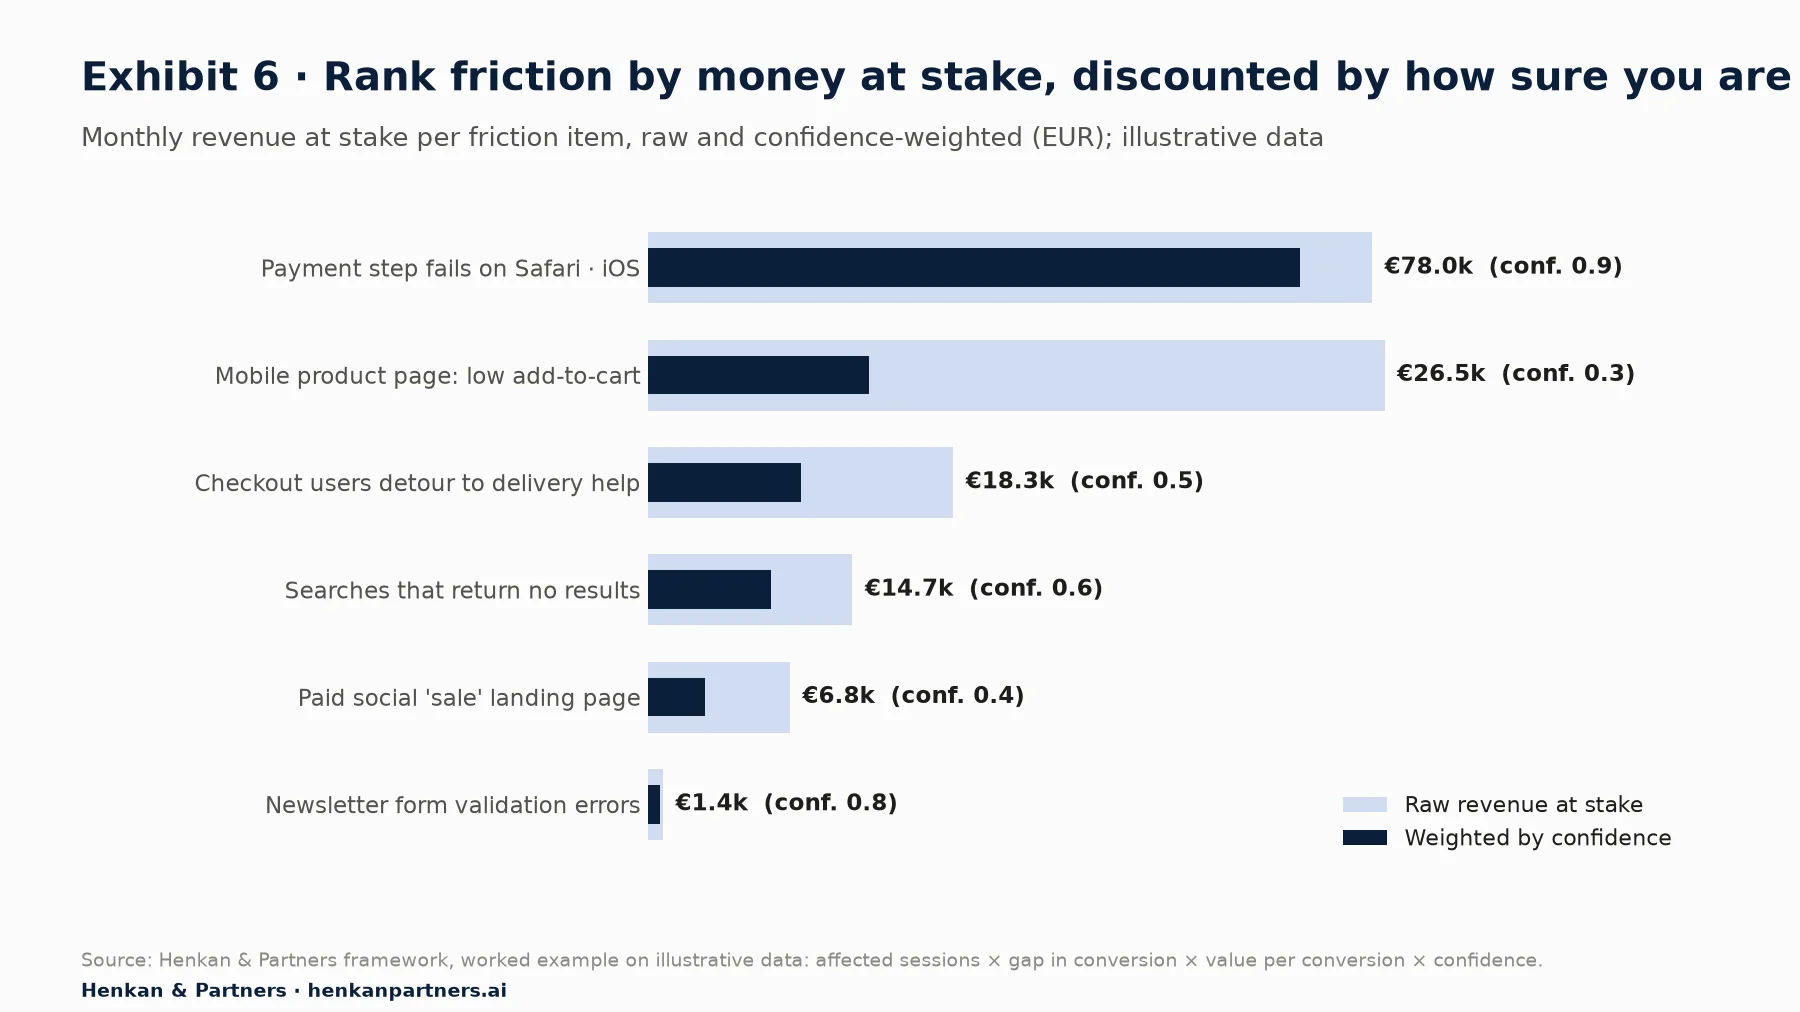
What this shows. The mobile product page has slightly more raw revenue at stake than the Safari payment bug, but a much lower confidence: part of the mobile gap is people browsing on the bus and buying later on a laptop. The Safari bug wins clearly once confidence is applied. The newsletter form is a real problem with high confidence, but it is worth little; fix it when someone is in that code anyway.
| Route | When to choose it | Example from Exhibit 6 |
|---|---|---|
| Fix | A clear defect with a high-confidence cause: one browser, one release, one error event. | Payment step on Safari iOS |
| Research | The gap is real but the cause is unknown. Watch replays, run a survey, test with five users. | Mobile product page add-to-cart |
| Test | You have a credible design hypothesis and enough traffic to measure it. | Delivery information in the shipping step; search synonyms for zero-result terms |
Where AI assistants help, and where they do not
Google publishes an experimental, read-only Google Analytics MCP server that lets AI assistants call the Analytics Data and Admin APIs, with tools such as run_report and run_funnel_report. In practice this means you can ask an assistant to pull a funnel by browser or a list of top search terms in plain language, and to draft the impact score table.
Use it for speed, not for judgement. An assistant inherits every setting problem in Section 2 and will happily compare a sampled exploration with an unsampled report. Ask it to state the date range, filters, steps and breakdown it used, check one number by hand in the GA4 interface, and never let it decide confidence scores on its own. Our article on AI agents in experimentation covers the wider risks.
Section 11 · What to do next
What to do next: run the six analyses once, rank the results, and make the review a habit
1. Check the five settings this week
Set data retention to 14 months, confirm site search and form interactions are on, add your search parameter if it is not in the default list, and register form_id as a custom dimension. Nothing else in this guide works well without these.
2. Build one closed funnel and split it by device and browser
Save it as a shared exploration so the whole team uses the same steps. Look for the step with the largest abandonment, then for a bug signature in one browser or operating system.
3. Run the backward paths, the search report and the form ratio
Save templates for paths ending on your help, contact and error pages, a top-search-terms table, and a form completion ratio. Note what you cannot see, such as zero-result searches and field errors.
4. Request the missing tracking
Write one event spec each for search result counts and form errors, using the method in how designers should ask for GA4 tracking and the shared GA4 tracking plan. To start faster, download the GA4 Tracking Request Kit: it contains a question bank for designers, an event spec template, a naming convention and a QA checklist.
5. Score, route and re-measure every month
Score each item with the impact formula, route it to fix, research or test, and re-run the same explorations a month after each change. For the research and measurement half, continue with combining GA4 with qualitative research and measuring a redesign. If you want a second pair of eyes on your first friction review, Talk to us.
Disclosure: Henkan & Partners sells analytics, UX research and experimentation services, including GA4 audits and friction reviews.
FAQ
Frequently asked questions about UX friction analysis in GA4
Frequently asked questions
What is UX friction analysis in GA4?
It is the use of Google Analytics 4 data to find where people struggle on a website or app: the funnel steps they abandon, the devices and browsers that fail, the landing pages that do not engage, the searches that do not help and the forms they give up on. It tells you where and for whom friction happens; qualitative research tells you why.
How do I find where users drop off in GA4?
Use Explore > Funnel exploration. Define your steps with events such as view_item, add_to_cart, begin_checkout and purchase, keep the funnel closed, and read the abandonment rate for each step. Turn on next action to see what people did instead, and switch to the trended funnel to spot sudden breaks.
How do I see what users did before leaving or contacting support in GA4?
Use Explore > Path exploration and set an ending point, such as your contact page, a help page or an error event. GA4 then shows the steps that led there, with the top 5 nodes per step by default and up to 20 with + More. For exits by page, use a free-form exploration with the Exits metric.
Can GA4 show conversion by browser and screen resolution?
Yes. Add Browser, Operating system with version, Screen resolution or Device model as a breakdown in a funnel exploration, or as rows in a free-form exploration. Note that in funnel breakdowns, users are attributed to the first value of the breakdown that applies to them.
How do I track site search in GA4?
Turn on site search in enhanced measurement. GA4 sends a view_search_results event when it sees one of the query parameters q, s, search, query or keyword in the URL, and stores the query in the search_term parameter, reported as the Search term dimension. Add your own parameter if your site uses a different one. Zero-result searches need custom tracking.
Does GA4 track form abandonment?
Partly. Enhanced measurement sends form_start and form_submit with form_id, form_name and form_destination, which you must register as custom dimensions to report on. The ratio of submits to starts is a rough guide only; for field-level errors and reliable completions you need custom events.
What is a good engagement rate for a landing page in GA4?
There is no universal number. An engaged session lasts longer than 10 seconds, has a key event or has two or more page views, and the 10-second timer can be changed per property, so compare each landing page with others of the same template and channel on your own site rather than with an external benchmark.
Why do my GA4 exploration numbers differ from standard reports?
Explorations can be sampled above 10 million events on standard properties, are limited by your data retention setting (two or 14 months on standard properties, so check which), and can hide rows behind data thresholds. Standard reports are not affected by retention. Shorten the date range, check the data quality icon, or use the BigQuery export for exact counts.
How do I prioritise UX issues found in GA4?
Score each issue by revenue at stake, affected sessions per month × gap in conversion against a realistic reference × value per conversion, then multiply by a confidence factor between 0.1 and 1.0. Route clear defects to fix, unclear causes to research, and credible design hypotheses to an A/B test.
Key terms
- UX friction
- Any point where users slow down, repeat themselves, detour or give up. It matters because small frictions on high-traffic steps add up to large revenue losses.
- Funnel exploration
- A GA4 Explore technique that shows how many users complete a defined sequence of steps and where they abandon. It is the starting point of any friction analysis.
- Closed funnel
- A funnel that only counts users who enter at the first step. It answers the friction question "of those who started, where did they leave?" without mixing in late entrants.
- Abandonment rate
- The share of users who reach a funnel step but do not complete the next one. It shows where to look, but must be compared with a reference before it means friction.
- Path exploration
- A GA4 Explore technique that draws the sequence of pages or events forward from a starting point or backward from an ending point. Backward paths reveal what leads to help pages, errors and exits.
- Breakdown dimension
- A dimension, such as device category or browser, used to split a funnel. It turns an average into a comparison, which is how defects are found.
- Bug signature
- Henkan & Partners term for one device, browser or operating system performing far below its peers at one step. It usually points to a defect, the cheapest kind of friction to fix.
- Engaged session
- A GA4 session that lasts longer than 10 seconds, has a key event or has two or more page or screen views. Engagement rate and bounce rate are both built on it.
- Key event
- An event marked as important in GA4 (previously called a conversion), such as a purchase or a lead. Key event rates are the outcome metrics friction analysis protects.
- Enhanced measurement
- A GA4 web stream option that collects page views, scrolls, outbound clicks, site search, form interactions, video engagement and file downloads without code. It is quick to enable but has blind spots for UX.
- view_search_results
- The enhanced measurement event sent when a user sees a search results page, with the query in search_term. It is the raw material of site search analysis.
- Exits
- A GA4 Explore metric counting how many times the last event in a session happened on a page or screen. High exits on a search or checkout page signal that it failed to help.
- Sampling
- Using a subset of data to answer a query. GA4 samples explorations above 10 million events on standard properties, which can distort small segments.
- Data thresholds
- System-defined rules that hide rows when counts are low enough to risk identifying users. They explain disappearing rows in small segments.
- Impact score
- Henkan & Partners prioritisation formula: affected sessions × gap × value per conversion × confidence. It turns a list of friction points into a ranked backlog.
Sources
All sources checked in October 2026. GA4 interface paths, limits and definitions come from current Google Analytics Help and developer documentation; GA4 changes often, so check the linked pages if a menu has moved. Baymard figures are research vendor data from usability benchmarks and shopper surveys. W3Techs data is a technology survey of websites. Exhibits 1 and 6 are Henkan & Partners frameworks; Exhibits 2 and 3 are Henkan & Partners mock-ups on illustrative data, not GA4 screenshots.
- Google Analytics Help (2026). [[GA4] Funnel exploration](https://support.google.com/analytics/answer/9327974).
- Google Analytics Help (2026). [[GA4] Path exploration](https://support.google.com/analytics/answer/9317498).
- Google Analytics Help (2026). [[GA4] Explorations overview](https://support.google.com/analytics/answer/7579450).
- Google Analytics Help (2026). [[GA4] Enhanced event measurement](https://support.google.com/analytics/answer/9216061).
- Google Analytics Help (2026). [[GA4] Landing page report](https://support.google.com/analytics/answer/12931766).
- Google Analytics Help (2026). [[GA4] Engagement rate and bounce rate](https://support.google.com/analytics/answer/12195621).
- Google Analytics Help (2026). [[GA4] About Analytics sessions](https://support.google.com/analytics/answer/9191807).
- Google Analytics Help (2026). [[GA4] Entrances and exits](https://support.google.com/analytics/answer/11080047).
- Google Analytics Help (2026). [[GA4] Data retention](https://support.google.com/analytics/answer/7667196).
- Google Analytics Help (2026). [[GA4] About data sampling](https://support.google.com/analytics/answer/13331292).
- Google Analytics Help (2026). [[GA4] Data thresholds](https://support.google.com/analytics/answer/9383630).
- Google Analytics Help (2026). [[GA4] Comparisons](https://support.google.com/analytics/answer/9269518).
- Google Analytics Help (2026). Best practices to avoid sending Personally Identifiable Information (PII).
- Google Analytics Help (2026). [[GA4] Key events](https://support.google.com/analytics/answer/13128484).
- Google Analytics Help (2026). Conversions vs. key events in Google Analytics.
- Google Analytics Help (2026). [[GA4] Custom dimensions and metrics](https://support.google.com/analytics/answer/10075209) and Configuration limits.
- Google Analytics Help (2026). [[GA4] Dimensions and metrics](https://support.google.com/analytics/answer/9143382).
- Google for Developers (2026). Google Analytics Data API schema.
- Google Analytics on GitHub (2026). Google Analytics MCP Server (Experimental).
- GOV.UK Data Community (2026). Funnel explorations in GA4.
- Baymard Institute (2026). Ecommerce Search UX Best Practices 2026: query types.
- Baymard Institute (2026). Cart Abandonment Rate statistics.
- W3Techs (2026). Usage statistics of traffic analysis tools for websites.