Focus
GA4 for UX and Product Designers: What the Numbers Can (and Can't) Tell You About Your Design
Alexandre Suon · 2026-10-02
GA4 for UX designers is not about becoming an analyst. It is about knowing which design questions Google Analytics 4 can answer (where people drop out, which screens struggle, what people search for), which ones it cannot (why), and how to read its engagement numbers without being fooled. This first step of The ABC of GA4 for UX & Product Designers gives you the click-paths, the blind spots and the traps.
Executive summary
- GA4 tells you where and how many; research tells you why. Use GA4 to find and size a design problem, then use session replay, usability tests or surveys to understand it. Neither replaces the other.
- Five design questions are answerable in GA4 out of the box. Where people drop out of a journey, which devices and screen sizes struggle, which pages get little attention, what people search for, and which entry pages fail new visitors. Each has a precise place in the interface.
- Enhanced measurement is a starting kit, not a UX tracking plan. It records seven kinds of interaction automatically, but scroll fires only at 90% depth, clicks are recorded only when they leave your domain, and form events say nothing about field errors.
- An engaged session only means the visit was not a quick exit. GA4 counts a session as engaged after 10 seconds, a key event or two page views. A low rate can mean success on a quick-answer page, and a high rate can hide struggle on a listing page.
- Segment by device before you judge a design. StatCounter puts mobile at 59% of worldwide page views in September 2026, and the six most common mobile screen sizes cover only 41.6% of mobile traffic, so blended averages hide the screens that fail.
- Site search terms are the most honest signal GA4 gives designers. Baymard's 2026 benchmark of 170+ e-commerce sites and apps finds 56% have "mediocre or worse" search UX (research vendor data); your own search terms show which of those failures your users hit.
Section 1 · The division of labour
GA4 tells you where and how many; research tells you why
GA4 for UX designers means using Google Analytics 4, Google's event-based web and app analytics tool, to locate and size design problems (where users drop out, which screens and devices struggle, what they search for) before using qualitative research to explain them.
Designers already know how to find out why people struggle: watch them. Usability tests, interviews and session replays show confusion in a way no dashboard can. What these methods do badly is tell you how often a problem happens, to whom and on which screens. That is the job of GA4.
Nielsen Norman Group draws the line clearly: qualitative methods are better for answering why something happens or how to fix it, while quantitative methods are better for "how many and how much" questions. GA4 is a quantitative, behavioural instrument. It records what browsers did, not what people meant.
This split decides how you should use GA4. Do not open it hoping to find a design answer. Open it with a question about location and size: Where in the checkout do mobile users leave? How many people search for 'returns'? Which landing pages lose new visitors in the first ten seconds? Then take the answer to research. Exhibit 1 maps five common design questions to the place in GA4 that answers them, the part GA4 cannot see and the research method that fills the gap.
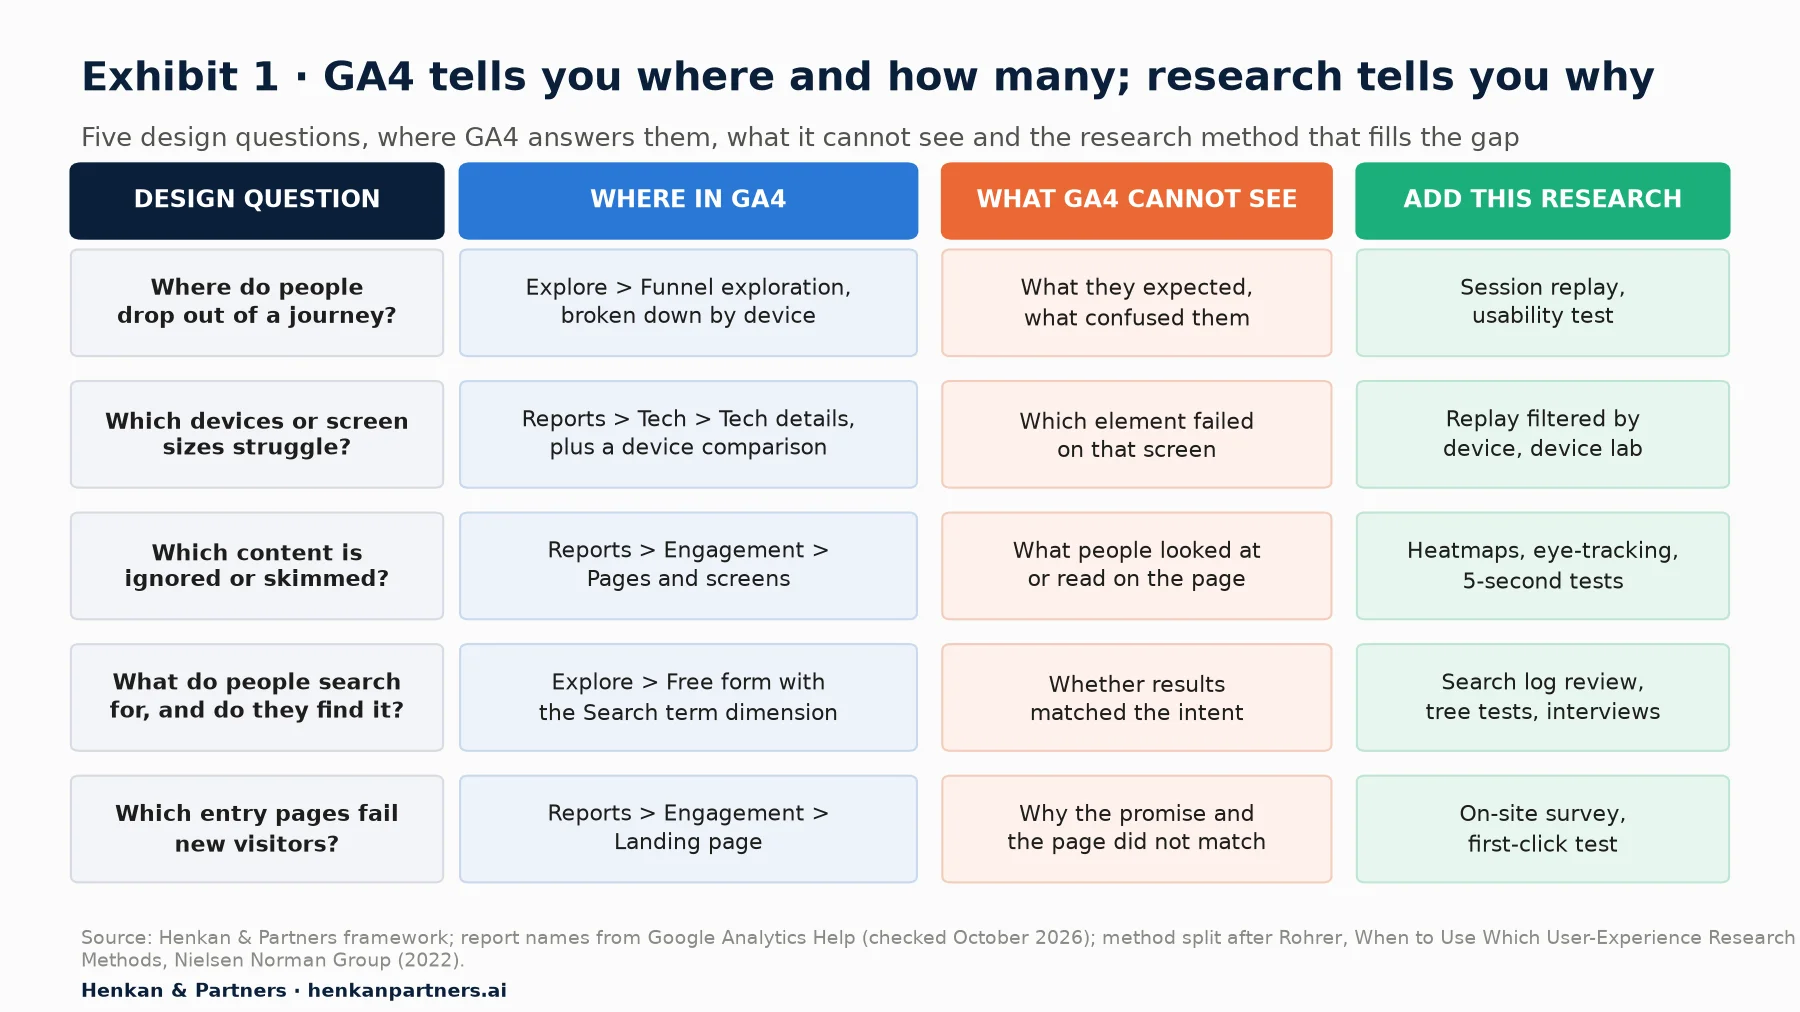
What this shows. Every row has a GA4 half and a research half. GA4 narrows the search to a step, a device, a page or a query. Research then explains what happened there. If you skip the GA4 half you test problems that may be rare; if you skip the research half you redesign based on a guess about why the number moved.
There is also a practical reason to learn GA4 first: it is the tool you will find already installed. W3Techs detects Google Analytics on 47.2% of all websites (data of 1 October 2026), against 4.1% for Microsoft Clarity and 1.7% for Hotjar, the two best-known heatmap and replay tools in its list (Exhibit 2). In many organisations GA4 is the only behavioural data a designer can open on day one.
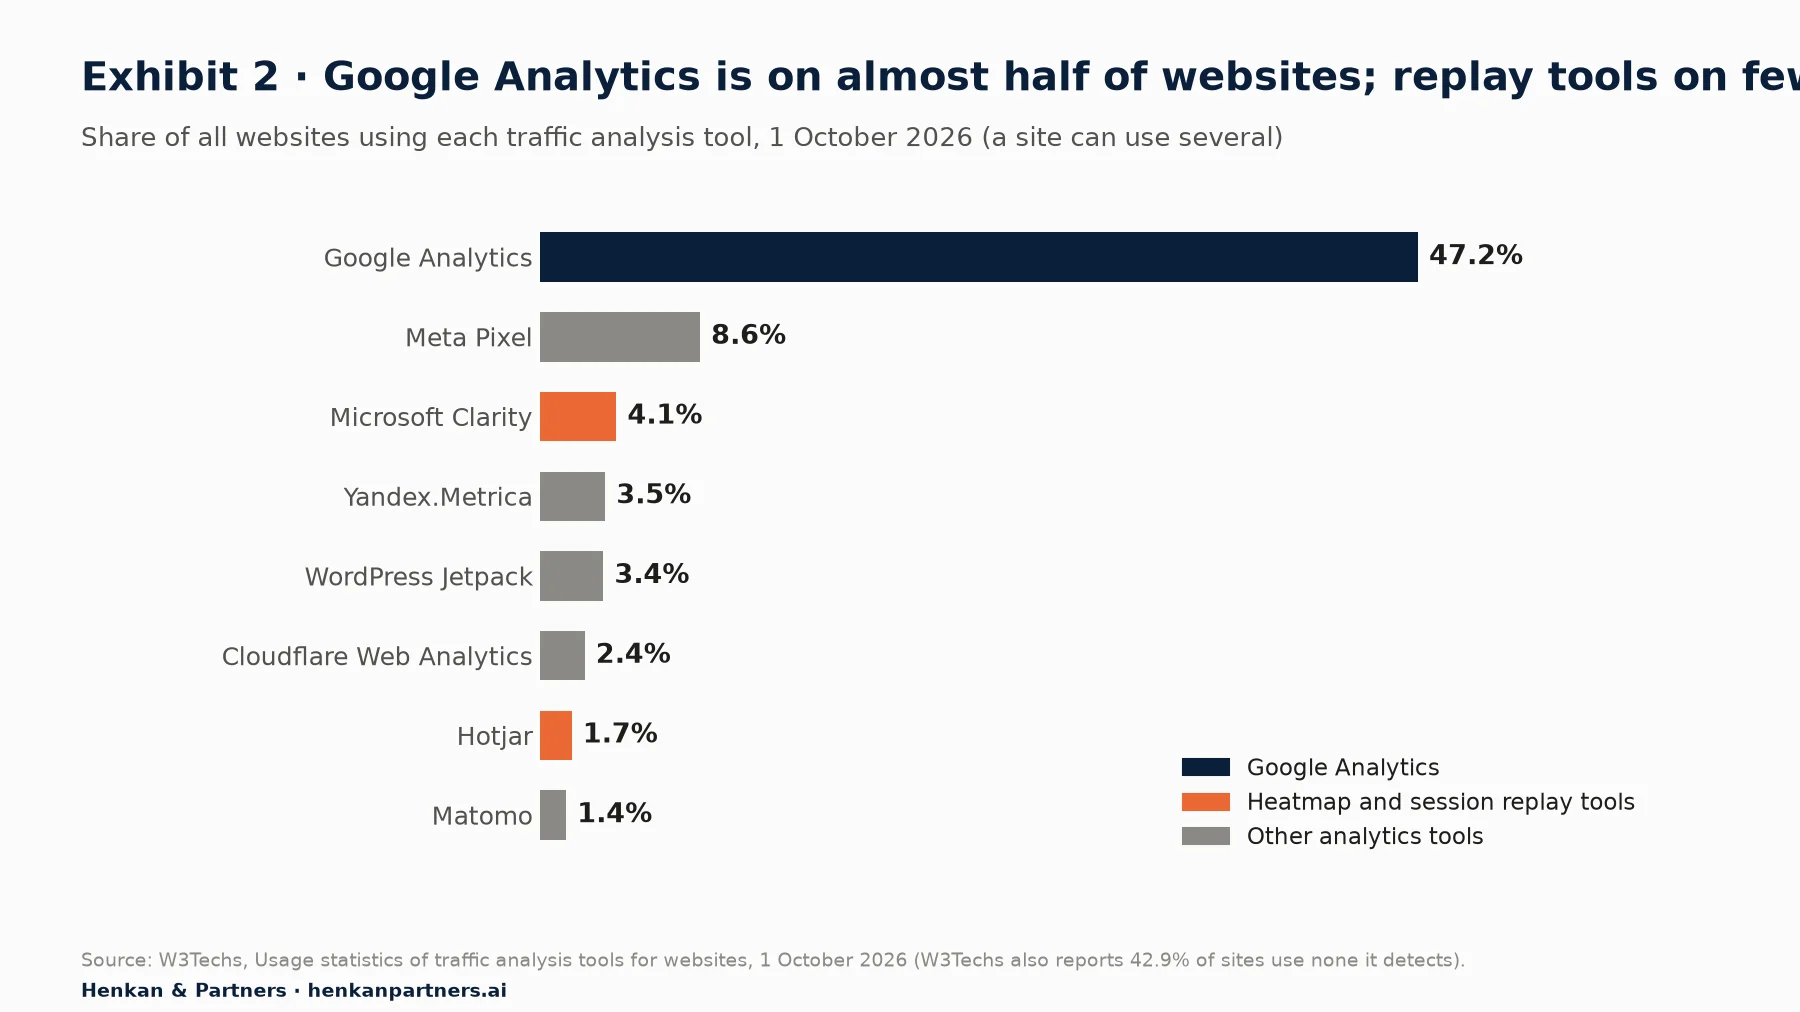
What this shows. Google Analytics is more than ten times as common as the most widespread replay tool in W3Techs' data. For a designer this means two things. GA4 is almost always available as a starting point. And the qualitative tools that explain behaviour are often missing, so you may need to make the case for them, using GA4 numbers to show the size of the problem you want to understand.
For the general case for combining analytics and research in design work, including HEART metrics, heatmaps and accessibility, read web analytics for product designers. This article stays with GA4 itself.
Section 2 · What GA4 can answer
Five design questions have a precise answer in GA4, if you know where to click
GA4 has two working areas. Reports are pre-built tables and charts, fast and unsampled, with a fixed set of dimensions. Explore is a workspace where you build your own analyses: funnels, paths, segment comparisons. The default report menu can be customised by your admins, so if a report is not where this article says, use the search bar at the top of GA4 and type its name.
| Design question | Where to click in GA4 | What to look at |
|---|---|---|
| Where do people drop out of a journey? | Explore > Funnel exploration. Add one step per screen or event; set Breakdown to Device category | The step with the largest drop, and whether it is much larger on one device |
| Which devices or screen sizes struggle? | Reports > Tech > Tech details. Switch the dimension to Device category, Browser or Screen resolution | Engagement rate and key events per device; a device whose rate is far below the others |
| Which pages get little attention? | Reports > Engagement > Pages and screens | Views, Average engagement time and Views per active user, compared between pages of the same type |
| What do people search for? | Explore > Free form. Rows: Search term; Values: Event count; filter Event name = view_search_results | The top terms, terms for things you sell but people cannot find, and help-type queries |
| Which entry pages fail new visitors? | Reports > Engagement > Landing page, with a comparison for New vs returning users | Landing pages with many sessions but a short average engagement time per session or few key events |
Use comparisons before you build anything
The fastest way to make a standard report useful for design is a comparison. In any report, click the comparison icon at the top right, choose Create new, pick a dimension such as Device category and a value such as mobile, then apply. GA4 shows each comparison in its own colour, side by side. Add desktop as a second comparison and you can see at a glance whether a page works on one device and fails on the other. Comparisons switch off when you move to another report, except All users, so re-apply them as you go.
Worked example: reading the Pages and screens report
Illustrative. A designer suspects that the size guide on a fashion site is ignored. In Reports > Engagement > Pages and screens she searches for the size guide path and compares it with product pages. She finds the size guide gets few views per active user compared with product pages, and that mobile users who reach it spend much less focused time on it than desktop users. GA4 has located a problem (mobile size guide, low attention) and sized it (views, users). It has not explained it. Her next step is to watch ten mobile replays of sessions that reached the size guide, which is a research task, not an analytics one.
For designers. Write your question down before you open GA4, in the form where, how many, for whom. If it starts with why, GA4 will only help you choose where to look.
For design leaders. Ask your team to attach one GA4 number to every problem statement in a design brief: the step, the device and the volume. It ends debates about whether a problem is real before any research budget is spent.
Section 3 · What GA4 cannot answer
GA4 cannot see intent, attention or emotion, so some design questions need other tools
GA4 receives events: a page was viewed, a button was clicked, a search was run. It does not receive what was on the screen, where the pointer moved, what the person expected or how they felt. Here is what that rules out, and where to go instead.
| Question GA4 cannot answer | Why not | Use instead |
|---|---|---|
| Why did people leave this step? | Events record actions, not reasons | Usability tests, exit surveys, on-site surveys |
| What did people look at or ignore on the page? | No pointer, hover or gaze data | Heatmaps, eye-tracking studies |
| Where did they hesitate or rage-click? | Only tracked clicks are recorded, and none by default inside your site | Session replay with frustration signals |
| What did one particular person do? | Reports aggregate; User explorer shows event lists, not screens | Session replay, interviews |
| Was the experience satisfying or trustworthy? | Attitudes are not behaviour | Surveys, interviews, review mining |
| Did my redesign cause the change? | Before/after comparisons mix many causes | A controlled experiment (A/B test) |
Two more limits are easy to miss. First, GA4 only sees the people who allowed it to. Where consent is required, visitors who decline analytics cookies are either missing or only partly modelled, so absolute numbers understate traffic; our consent guide explains the mechanics. Second, GA4 is not real-time for most purposes. Google states that data processing can take 24 to 48 hours and that report numbers may change during that time. Do not judge a release on its first morning.
Our view. The most expensive mistake we see is not misreading GA4; it is asking it a why question and accepting the first plausible story. When a number surprises you, treat it as the start of a research question, not the end of one.
Section 4 · Enhanced measurement
Enhanced measurement records seven interactions automatically, but not the ones designers care about most
When GA4 is installed, a feature called enhanced measurement is usually switched on. It records a set of interactions without any extra code. You can check what is enabled in Admin > Data streams, select your web stream, then look under Enhanced measurement; the settings icon shows each option. You need the Editor role to change them.
Exhibit 3 lists what each automatic event does, according to Google's documentation, and the blind spot it leaves for a designer.
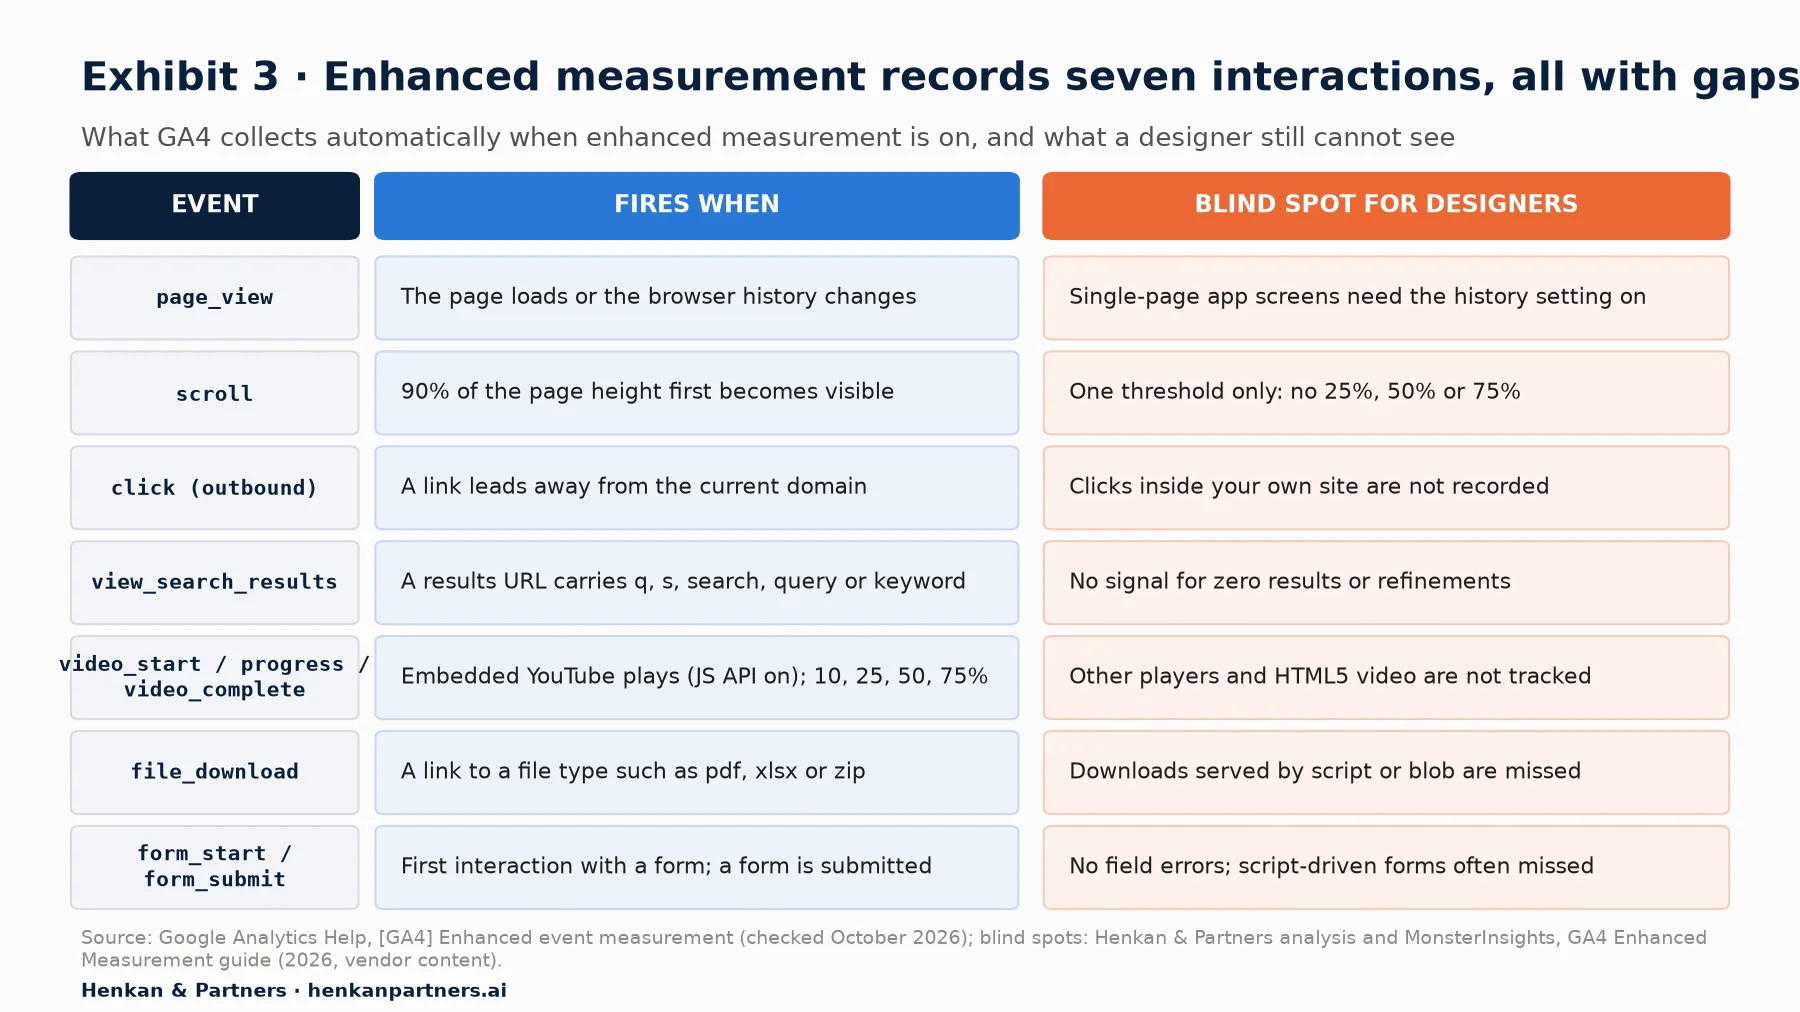
What this shows. Each event is useful, and each is narrower than its name suggests. "Scroll" means one threshold at the bottom of the page. "Click" means a link leaving your domain. "Form interactions" means a first touch and a submit, with nothing in between. For most design questions about components, enhanced measurement is the place you start, not the place you finish.
Form interactions are the weakest automatic signal
Forms are where designers most want data and where enhanced measurement helps least. Google defines form_start as the first time a user interacts with a form in a session and form_submit as the moment a form is submitted. Four practical problems follow:
- No field-level detail. You cannot see which field caused an error, which validation message appeared or which field people abandoned on.
- Script-driven forms can be missed. Forms that send data with JavaScript without a standard browser submit are not recorded as submissions; MonsterInsights' guide (vendor content) notes AJAX forms are "missed entirely".
- A submit is not a success. In our experience form_submit can fire on attempts that the server then rejects, so it overstates completion. Ask for a dedicated success event instead.
- Parameters need registering. Google notes that form parameters such as form_id can only be used in reports if you create custom dimensions for them.
The fix is not more enhanced measurement; it is a short tracking request for the interactions that matter to your design: validation errors, filter use, accordions, tabs, modals, empty states and zero-result searches. That is the subject of step 2 of this path, how designers should ask for GA4 tracking.
Single-page apps can make screens invisible
Many modern sites change screens without loading a new page. GA4 records a page_view when the page loads or when the browser history state changes, and the second part depends on an advanced page view setting for browser-history events. If your product is a single-page app and that setting is off, or the app does not update the history, whole screens can be missing from Pages and screens. If a step of your flow never appears in GA4, ask a developer to check this before concluding that nobody reaches it.
Section 5 · Scroll depth
The scroll event shows who reached the bottom of a page, not who read it
Designers often treat "scroll depth" as a measure of content engagement. In GA4's default setup it is not. Google's documentation is precise: the scroll event fires the first time a user reaches the bottom of each page, defined as the moment 90% of the vertical depth becomes visible. There is no 25%, 50% or 75% event unless someone builds it.
This matters because attention is concentrated at the top of pages. In Nielsen Norman Group's 2018 eye-tracking study (120 participants, more than 130,000 fixations on 1920×1080 screens), people spent about 57% of their page-viewing time above the fold and 74% in the first two screenfuls.
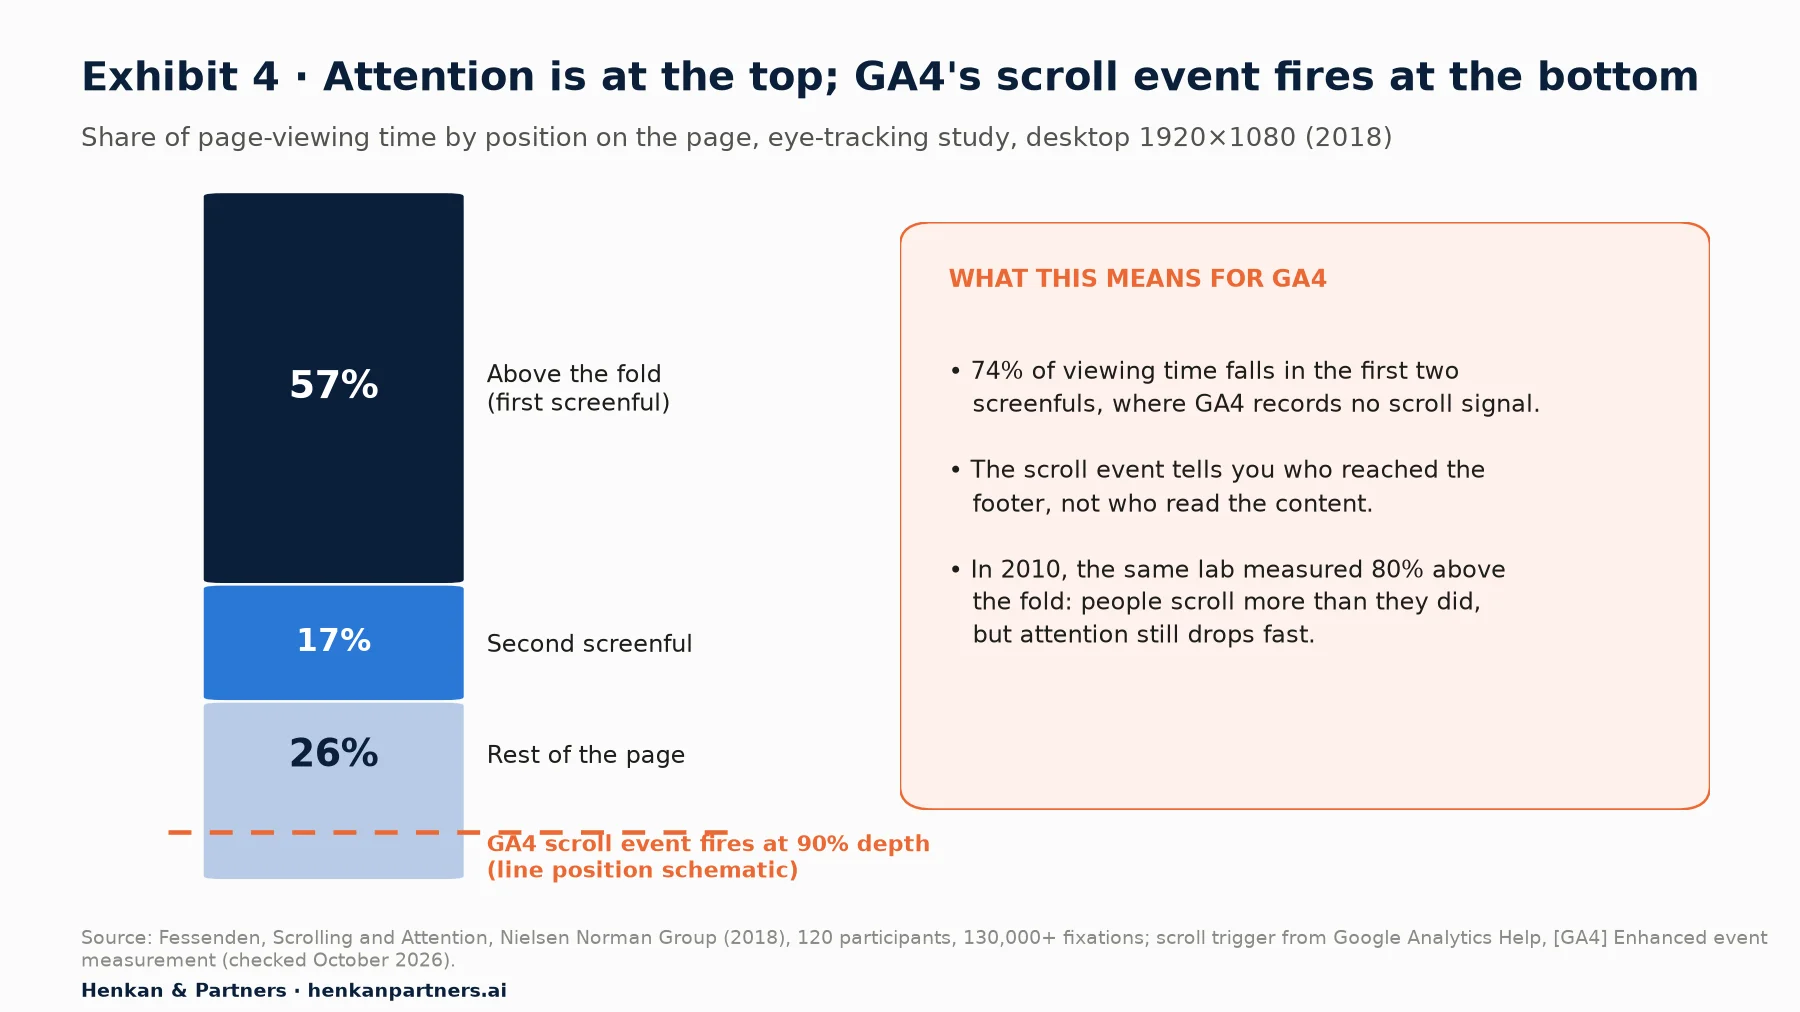
What this shows. Most attention is spent where GA4 records no scroll signal at all. The default scroll event tells you something about the last tenth of a page, which is where footers, related links and legal text usually live. If your design question is about a block in the middle of a long product page, the default data cannot answer it.
Three ways to read scroll data honestly:
- Compare like with like. A long editorial page and a short product page will never have comparable scroll rates. Compare versions of the same template.
- Use it as a reach signal for the end of a page. If a call to action sits at the bottom of a landing page, the scroll event tells you roughly how many sessions could have seen it.
- Ask for element visibility instead of depth. If you need to know whether people saw a specific block, a visibility event on that block (for example, size_guide_visible) is far more useful than extra scroll thresholds. Request it through the tracking process in step 2.
Section 6 · Engagement metrics
Engagement rate tells you a visit was not a quick exit, not that the experience was good
GA4 replaced Universal Analytics' bounce rate with a different idea. According to Google, an engaged session is a session that lasts longer than 10 seconds, has a key event, or has two or more page or screen views. Engagement rate is the percentage of sessions that were engaged. Bounce rate in GA4 is simply the percentage of sessions that were not engaged, the inverse of engagement rate.
Engagement rate = engaged sessions ÷ sessions
Bounce rate = 100% − engagement rate
Engaged session = (focused time > 10 s) OR (≥ 1 key event) OR (≥ 2 page or screen views)
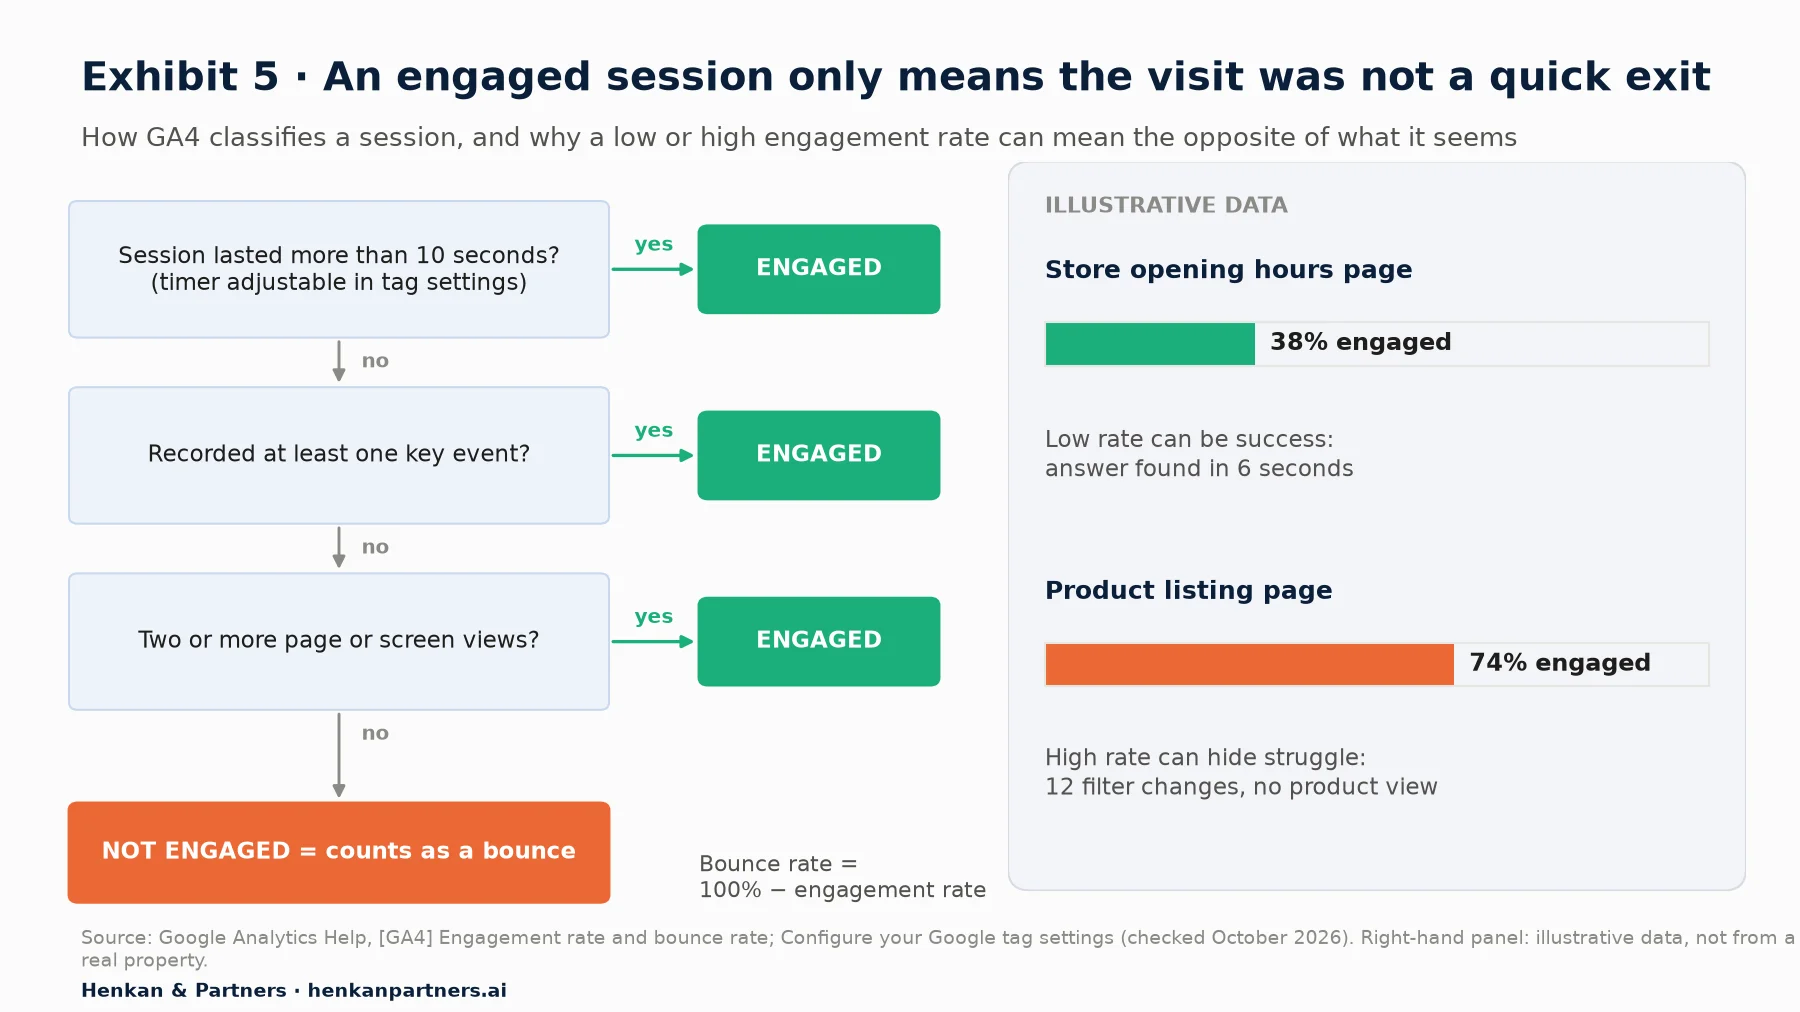
What this shows. The rule is generous: almost any visit that is not a quick exit counts as engaged. That makes engagement rate a good alarm for pages that lose people immediately, and a poor measure of experience quality. A page that answers a question in six seconds can look like a failure; a page where people fight the filters for two minutes can look like a success.
Five traps when you read engagement numbers
- The 10-second rule can be changed. Admins can adjust the engaged-session timer in Admin > Data streams > your web stream > Configure tag settings > Adjust session timeout. Before comparing with another site or with last year, ask whether the setting was changed.
- Key events make sessions engaged by definition. If your team marks a very common event as a key event, engagement rate rises without any change in the experience. Key events were called conversions until Google renamed them in 2024 (as reported by CMSWire in April 2024); Google now uses "conversion" for key events used to measure and optimise ad campaigns.
- Engagement time is focused time, not time on page. Google measures user engagement as the time a web page is in focus. A tab left open in the background does not count. GA4 engagement times are therefore not comparable with old Universal Analytics time-on-page figures.
- Averages hide two populations. An average engagement time of 40 seconds can be half the visitors leaving in 5 seconds and half staying 75. Break it down by device or by new versus returning users before drawing conclusions.
- Page type decides what good looks like. Store locators, order tracking and contact pages should be fast. Category pages and configurators should hold attention. Judge each template against its own job, ideally against its own history.
For designers. Pair engagement rate with a task signal: a key event, a click on the next step, or a search followed by a product view. Engagement alone never proves a design works.
For design leaders. Do not set engagement rate as a design team target. It is too easy to move without improving anything, for example by adding a second page view to a flow.
For the full mechanics of how GA4 builds sessions and counts users, see how GA4 works.
Section 7 · Devices and screens
Segment every number by device before you judge a design
A blended number is an average of different experiences. A checkout that works well on desktop and badly on mobile can show an acceptable overall completion rate while losing most mobile buyers. The first habit to build in GA4 is to break every design number down by Device category (desktop, mobile, tablet).
The stakes are high. StatCounter reports that mobile devices generated 59.0% of worldwide page views in September 2026, desktop 39.3% and tablets 1.8%. Your own mix will differ, so check it in Reports > Tech > Tech details.
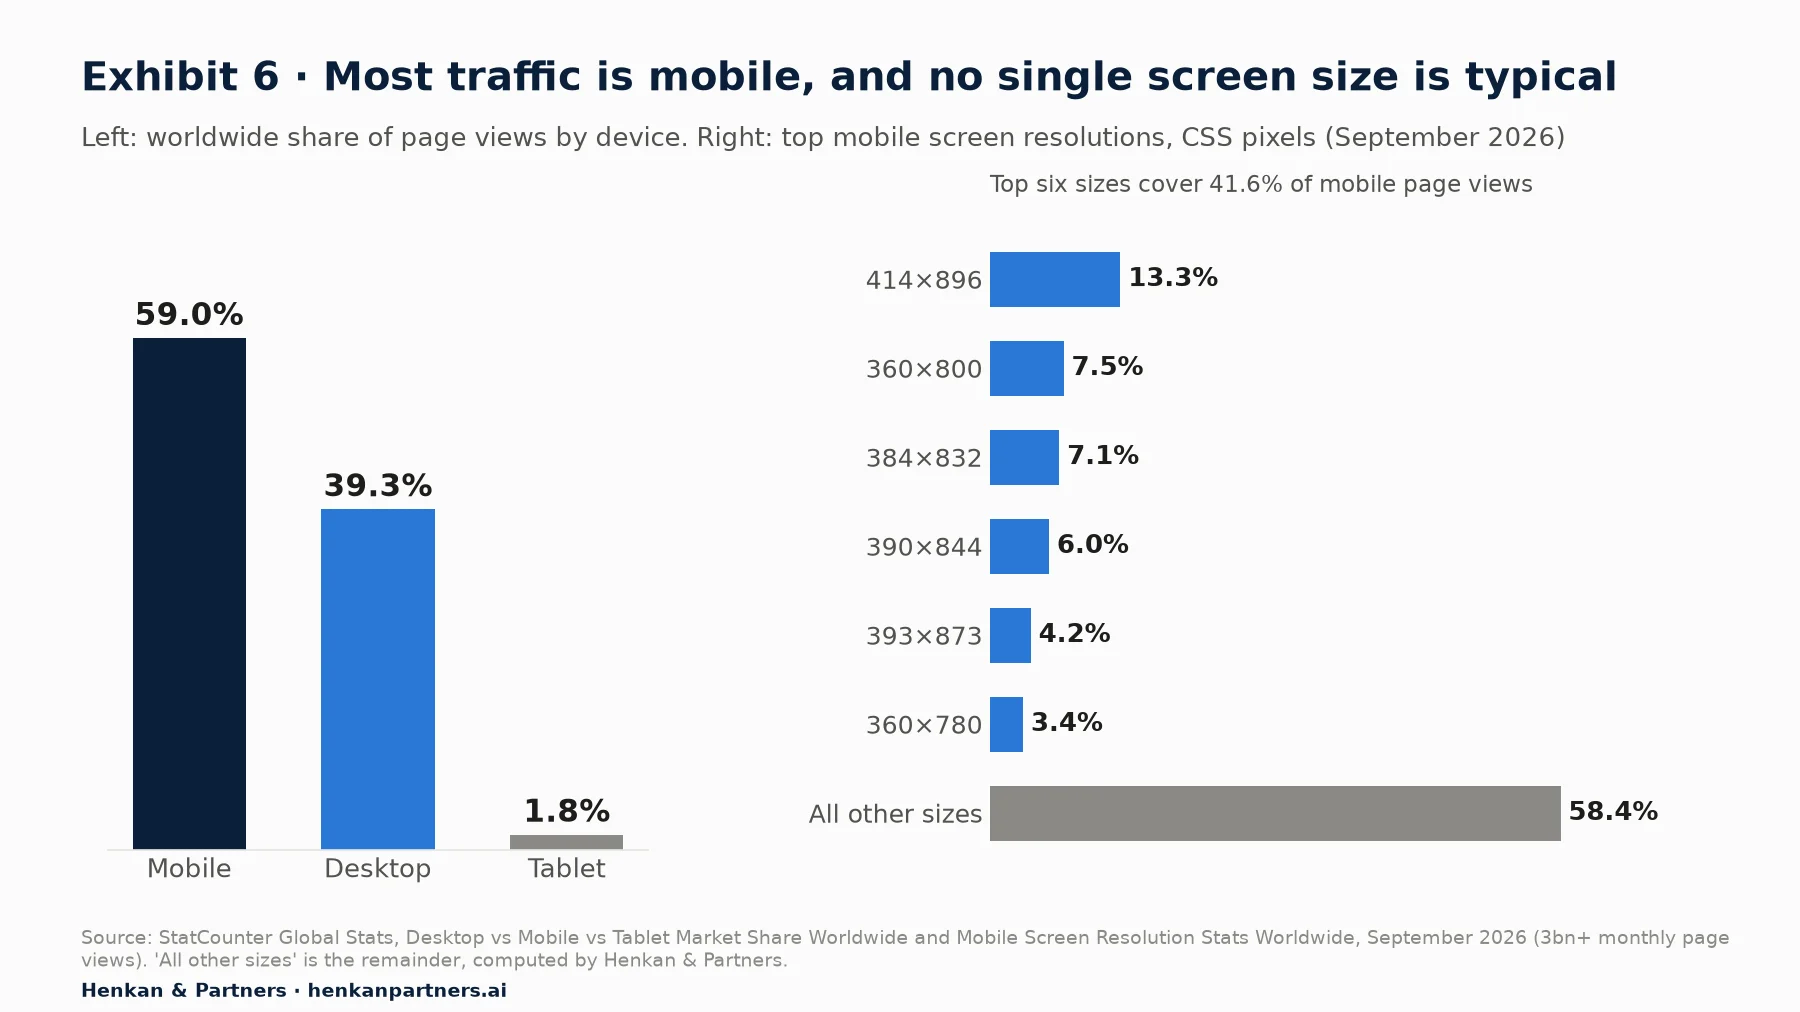
What this shows. Mobile is the majority of traffic worldwide, yet no single mobile screen size dominates: the most common accounts for 13.3% of mobile page views and more than half of traffic comes from sizes outside the top six. Designing and checking for "the" mobile screen is not enough; you need to check ranges of widths.
How to use Screen resolution without drowning in rows
In Reports > Tech > Tech details you can switch the dimension to Screen resolution. You will see a long list of sizes, most with small numbers. Three tips make it usable:
- Filter to one device category first, then read the top 10 resolutions. This shows you which widths deserve a check in your design reviews and device lab.
- Group widths into your breakpoints. In an exploration you can build segments for screen widths that match your design system's breakpoints, then compare their engagement rate and key events. A breakpoint that underperforms is a strong lead for a layout problem.
- Check the browser too. Switch the dimension to Browser. A browser with much lower engagement or key events than others on the same device often points to a rendering or compatibility bug rather than a design flaw. Hand those to developers first.
Device analysis is the core of step 3 of this path, finding UX friction in GA4, and of our mobile UX audit method.
Section 8 · Site search
Site search terms are the most honest UX signal GA4 collects
People who search tell you, in their own words, what they want and could not find by browsing. That makes site search data unusually valuable for designers: it is behavioural (they typed it) and close to intent (they told you what they wanted).
Enhanced measurement records a view_search_results event when a search results page is shown, as long as the results URL contains a query parameter GA4 recognises. By default these are q, s, search, query and keyword; you can add others in the enhanced measurement settings for site search. The term itself is stored in the search_term parameter.
How to read your search terms
- Go to Explore > Free form. In Variables, add the dimensions Search term and Device category, and the metric Event count. If Search term is not available in your property, Google's Explore playbook suggests registering search_term as a custom dimension.
- Drag Search term into Rows and Event count into Values. Add a filter: Event name exactly matches view_search_results.
- Sort by event count and export the top 100 terms.
- Tag each term by type: exact product, product type, feature, use case, compatibility, symptom, non-product (returns, delivery, sizes, help), abbreviation or misspelling.
- For the biggest types, run the searches yourself on mobile and desktop and judge the results. The types that fail are your design backlog.
Why tag by query type? Because search failures cluster by type. Baymard Institute's 2026 search benchmark of 170+ e-commerce sites and apps finds issues with non-product searches on 66% of sites, abbreviations and symbols on 54%, and compatibility searches on 44%, against 12% for exact brand or model searches (Exhibit 7).
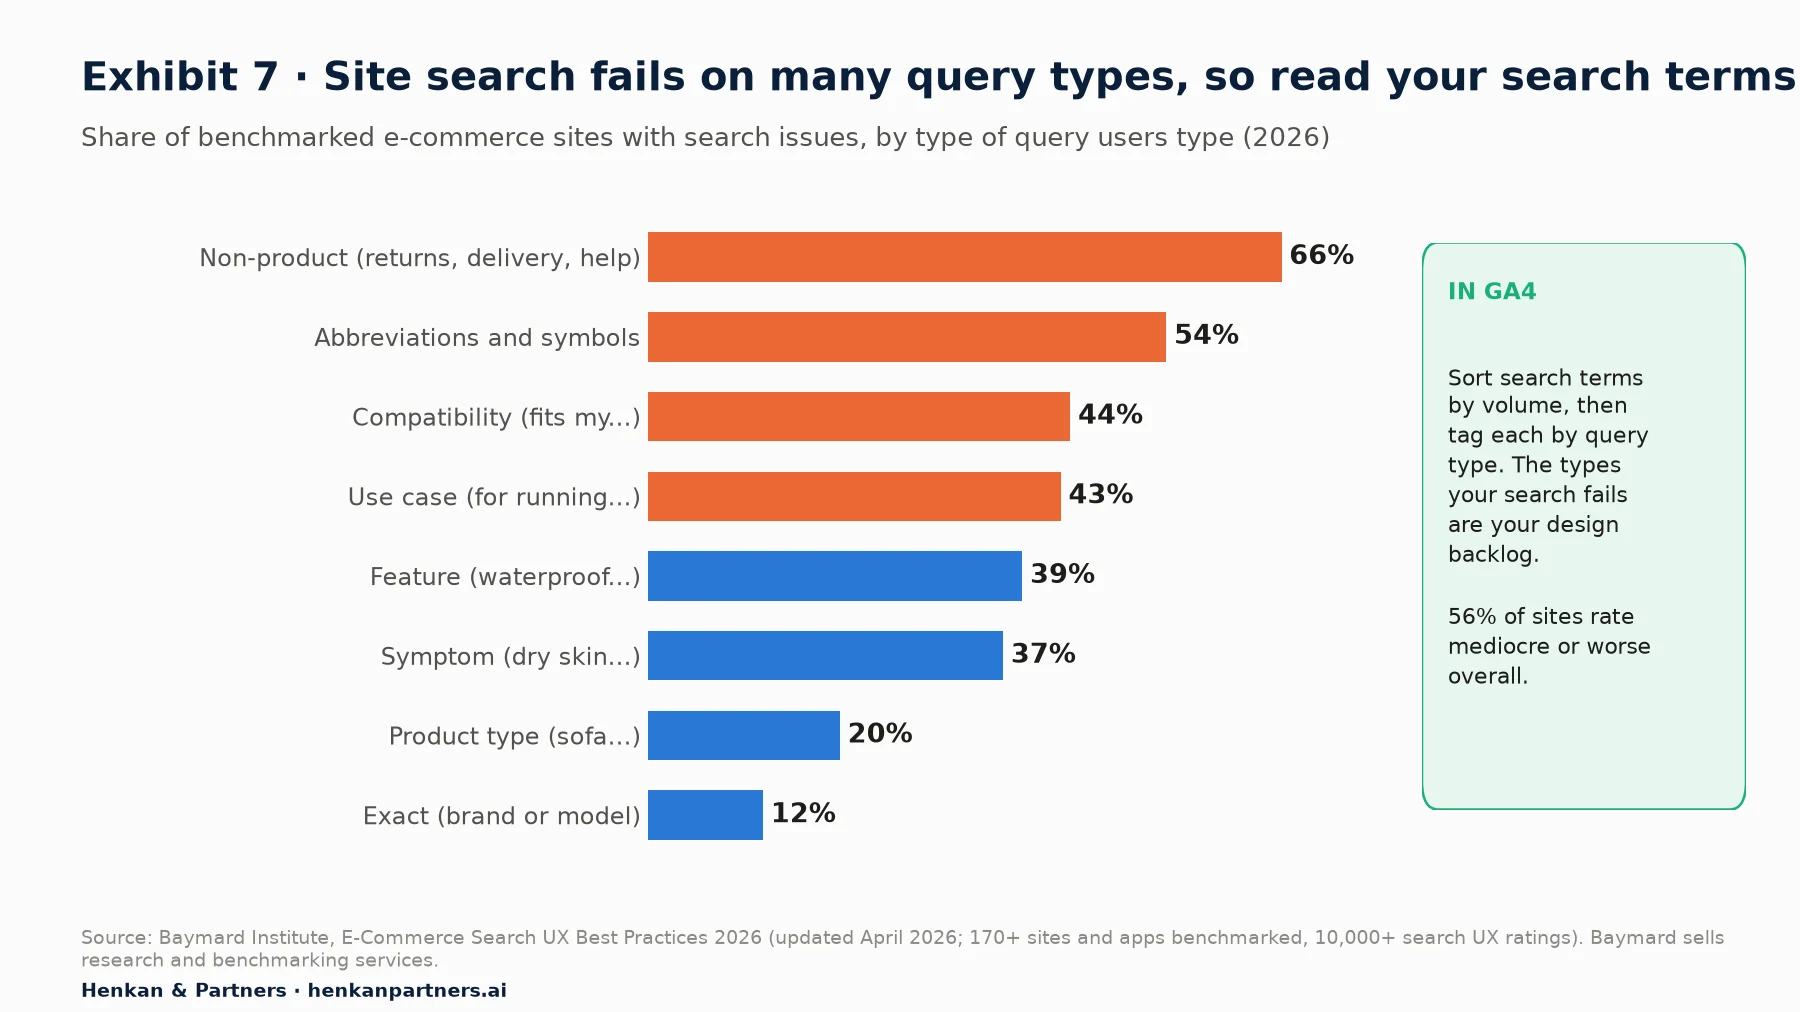
What this shows. Search engines usually handle exact product names. They struggle when people describe a need, a feature or a problem, or ask about delivery and returns. If your GA4 search terms contain many queries of the weak types, you have a likely design and merchandising problem, and you know its volume.
Three limits of GA4 search data
- No zero-result signal by default. GA4 knows a results page was shown, not whether it was empty. Ask for a parameter such as results_count on view_search_results, or a dedicated no-results event.
- Thresholding can hide rows. Google's documentation on data thresholds says that when a report or exploration includes search query information, rows may be withheld if there are not enough users. Rare terms can disappear; widen the date range if you need them.
- Search that does not change the URL is invisible. Instant search boxes and overlays that never load a results URL do not trigger the automatic event. Check that searches on your site appear in GA4 before analysing them.
For designers. Review the top search terms once a month with your content and merchandising colleagues. It is the cheapest user research you will ever do.
For design leaders. Make "searches with no results" a tracked event and a standing metric for the search and navigation team.
Section 9 · Reading traps
Most misleading GA4 readings come from a handful of predictable traps
You do not need to understand GA4's data model in depth to avoid being fooled. You need to recognise a few situations where the numbers mean something different from what they seem to say.
| Trap | What happens | What to do |
|---|---|---|
| Data is still processing | Google states processing can take 24 to 48 hours and numbers may change | Wait at least two full days before reading a release |
| Explorations only look back so far | Event data retention can be set to 2 or 14 months for standard properties (up to 50 months for 360) and affects explorations and funnel reports; standard aggregated reports are not affected | Ask your admin which setting is used before planning a year-on-year comparison |
| Sampling in explorations | Google notes that queries involving more than 10 million events may use sampled data | Check the data quality icon; shorten the date range if sampled |
| Thresholding | Rows with demographics or search terms may be withheld when users are few | Widen the date range; do not read missing rows as zero |
| Consent gaps | Visitors who decline analytics are missing or only partly modelled | Compare ratios and trends, not absolute counts |
| Page title vs page path | Different URLs can share a title, and one template can have many URLs | Use page path for templates, title for content; group with content groups |
| Before/after reading of a redesign | Seasonality, campaigns and traffic mix all move numbers | Use an A/B test, or at least a comparison period and a control segment |
The last trap deserves its own article: measuring a redesign properly is step 4 of this path, combining GA4 with qualitative research and measuring a redesign. For deeper funnel and retention methods, see funnel and cohort analysis.
Section 10 · AI assistants
AI assistants can query GA4 for you, but they inherit every limit described above
Designers increasingly ask an AI assistant instead of clicking through reports. Google publishes an experimental, read-only Google Analytics MCP server that lets assistants supporting the Model Context Protocol run reports, funnel reports and realtime reports through the Google Analytics Data and Admin APIs. Several third-party connectors do the same.
This lowers the barrier to asking questions, and it is genuinely useful for quick lookups ("top 20 search terms on mobile last month"). But the assistant reads the same processed data you would: thresholded rows, consent gaps, the 90% scroll event and the generous engaged-session rule all still apply. It can also choose the wrong dimension, for example a session-scoped source when you meant first user source, and present the result with confidence.
- Ask for the query, not just the answer. Have the assistant show the dimensions, metrics, filters and date range it used.
- Check one number in the interface. Reproduce the headline figure in GA4 before sharing it.
- Keep the why with people. An assistant can summarise what changed; explaining why still needs research with real users.
- Protect data. Use read-only access and never paste personal data from replays or surveys into general-purpose tools.
Section 11 · What to do next
What to do next
1. Get Viewer access and find your five reports
Ask your analytics owner for Viewer access to the GA4 property. Open Pages and screens, Landing page, Tech details, a Funnel exploration and a Free form exploration with Search term. Save the explorations so they are ready when you need them.
2. Check what enhanced measurement records on your site
With an admin, open Admin > Data streams > your stream > Enhanced measurement. Note which events are on, whether browser-history page views are enabled for single-page screens, and whether your site search parameter is recognised. Write down the blind spots from Exhibit 3 that affect your product.
3. Set a device-split baseline for the flows you own
For each flow you design (search, product page, checkout, sign-up), record the current engagement rate, key events and the main drop-off step by device. Keep it in your design documentation. It becomes the reference for every future change.
4. Request the tracking that GA4 does not collect
List the interactions that matter to your design and that enhanced measurement misses: field errors, filters, tabs, modals, zero-result searches, element visibility. Turn them into a request using step 2 of this path and the shared GA4 tracking plan. To speed things up, download the GA4 Tracking Request Kit: it contains a question bank per role, an event spec template, a naming convention, a QA checklist and a tracking-plan sheet layout.
5. Pair every GA4 finding with one research activity
For each problem GA4 locates, plan the smallest research activity that explains it: ten replays, five usability sessions, a one-question survey on the page. Then move on to finding UX friction in GA4.
6. Get help when the stakes are high
If you are preparing a redesign, or your tracking cannot answer the questions above, an outside view can save months. Henkan & Partners audits GA4 set-ups, writes UX tracking plans and runs the research and experiments that follow. Disclosure: Henkan & Partners sells analytics, research and experimentation services. Talk to us.
FAQ
Frequently asked questions about GA4 for UX designers
Frequently asked questions
What is GA4 for UX designers?
It is the use of Google Analytics 4 by designers to locate and size design problems: where people drop out of a journey, which devices and screens struggle, which pages get little attention, what people search for and which entry pages fail. GA4 answers where and how many; qualitative research answers why.
What is GA4?
Google Analytics 4 is Google's analytics tool for websites and apps. It records interactions as events with parameters, and offers pre-built reports plus an Explore workspace for custom analyses such as funnels and paths. W3Techs detects Google Analytics on 47.2% of all websites in October 2026.
Can GA4 show heatmaps or session recordings?
No. GA4 records events, not screens, pointer movements or recordings. For heatmaps and session replay you need a separate tool such as a session replay or experience analytics platform.
What does engagement rate mean in GA4?
It is the percentage of sessions that were engaged. A session is engaged if it lasts longer than 10 seconds, records a key event or has two or more page or screen views. Bounce rate is the inverse: the share of sessions that were not engaged. The 10-second timer can be adjusted by admins.
How does GA4 measure scroll depth?
With enhanced measurement on, GA4 records a scroll event the first time a user reaches 90% of the page's vertical depth. There are no other thresholds by default. To know whether people saw a specific block, ask developers for a visibility event on that block.
Does GA4 track form abandonment?
Only partly. Enhanced measurement records form_start and form_submit, but not field errors or the field where people gave up, and it can miss forms submitted by JavaScript. Field-level analysis needs custom events.
Where do I find site search terms in GA4?
Create a Free form exploration with Search term in Rows and Event count in Values, filtered to the view_search_results event. Site search tracking must be enabled in enhanced measurement and your results URL must use a recognised query parameter such as q or search.
Why do GA4 numbers change after a few days?
Google states that data processing can take 24 to 48 hours and that report data may change during that time. Read a release only after at least two full days of processed data.
Can I use GA4 to prove a redesign worked?
Not reliably on its own. Before/after comparisons mix the redesign with seasonality, campaigns and changes in traffic mix. Use an A/B test where traffic allows, or a careful comparison with a control segment and period.
Key terms
- Enhanced measurement
- A GA4 feature that records page views, scrolls, outbound clicks, site search, YouTube video engagement, file downloads and form interactions without extra code. It matters because it is the default data most designers see, with significant blind spots.
- Event
- A single recorded interaction, such as page_view or view_search_results, with parameters that describe it. Everything in GA4 is built from events, so if an interaction is not sent as an event, GA4 cannot report it.
- Parameter
- A detail attached to an event, such as search_term or form_id. Parameters often need registering as custom dimensions before they appear in reports, which is why some data seems to be missing.
- Key event
- An event marked as important to the business, called a conversion until Google renamed it in 2024. Key events matter to designers because they define success in reports and also make a session count as engaged.
- Engaged session
- A session that lasts more than 10 seconds, has a key event or has two or more page or screen views. It is the building block of engagement rate and only signals that a visit was not a quick exit.
- Engagement rate
- The percentage of sessions that were engaged. Useful as an alarm for pages that lose people immediately, misleading as a measure of experience quality.
- Bounce rate (GA4)
- The percentage of sessions that were not engaged, the inverse of engagement rate. It differs from Universal Analytics' bounce rate, so old and new figures are not comparable.
- Engagement time
- The time a web page is in focus or an app screen is in the foreground. It excludes background tabs, so it reflects time actually spent on the page rather than time a tab stayed open.
- Exploration
- A custom analysis built in GA4's Explore workspace, such as a funnel, path or free-form table. Explorations answer questions standard reports cannot, but may be sampled and are limited by data retention.
- Comparison
- A report feature that shows the same table for several groups of users, such as mobile versus desktop, side by side in different colours. It is the fastest way to see whether a design works on one device and fails on another.
- Data thresholds
- Rules that withhold rows containing demographic or search-term data when too few users are involved. They explain why rare search terms can be missing.
- Sampling
- Estimating results from a subset of data when an exploration query involves more than 10 million events. Sampled numbers are approximations, so check the data quality icon before relying on small differences.
- Single-page app
- A site that changes screens without loading new pages. Without the browser-history page view setting or custom events, its screens may not appear in GA4.
- MCP (Model Context Protocol)
- An open protocol that lets AI assistants call external tools and data sources. Google's experimental GA4 MCP server lets assistants run read-only reports, with the same data limits as the interface.
Sources
All sources were checked in October 2026. GA4 interface paths, report names, event definitions and limits come from current Google Analytics Help pages and may change; check them if you read this later. Baymard, StatCounter and W3Techs figures are third-party measurement or research vendor data; the MonsterInsights guide is vendor content. Exhibits 1 and 3 (blind-spot column) are Henkan & Partners frameworks; the right-hand panel of Exhibit 5 and the worked example in Section 2 use illustrative data.
- Google Analytics Help (2026). [[GA4] Enhanced event measurement](https://support.google.com/analytics/answer/9216061).
- Google Analytics Help (2026). [[GA4] Engagement rate and bounce rate](https://support.google.com/analytics/answer/12195621).
- Google Analytics Help (2026). Configure your Google tag settings.
- Google Analytics Help (2026). User engagement.
- Google Analytics Help (2026). [[GA4] Pages and screens report](https://support.google.com/analytics/answer/12926732).
- Google Analytics Help (2026). [[GA4] Tech details report](https://support.google.com/analytics/answer/12980150).
- Google Analytics Help (2026). [[GA4] Landing page report](https://support.google.com/analytics/answer/12931766).
- Google Analytics Help (2026). Get started with Explorations.
- Google Analytics Help (2026). [[GA4] Explore playbook](https://support.google.com/analytics/answer/12664847).
- Google Analytics Help (2026). Apply comparisons to reports.
- Google Analytics Help (2026). [[GA4] About data thresholds](https://support.google.com/analytics/answer/9383630).
- Google Analytics Help (2026). [[GA4] Data retention](https://support.google.com/analytics/answer/7667196).
- Google Analytics Help (2026). [[GA4] Data freshness](https://support.google.com/analytics/answer/11198161).
- Google Analytics Help (2026). Conversions vs. key events.
- CMSWire, DeBois, P. (2024). Google Analytics' Key Events vs. Conversions: What's New?.
- Google Analytics (2026). Google Analytics MCP server (experimental).
- W3Techs (2026). Usage statistics of traffic analysis tools for websites.
- Nielsen Norman Group, Fessenden, T. (2018). Scrolling and Attention.
- Nielsen Norman Group, Rohrer, C. (2022). When to Use Which User-Experience Research Methods.
- Baymard Institute (2026). E-Commerce Search UX Best Practices 2026.
- StatCounter Global Stats (2026). Desktop vs Mobile vs Tablet Market Share Worldwide.
- StatCounter Global Stats (2026). Mobile Screen Resolution Stats Worldwide.
- MonsterInsights (2026). GA4 Enhanced Measurement: What It Tracks, What It Misses, and What To Do About It (vendor content).