Focus
Reducing Churn in a Subscription App with Product Analytics
Alexandre Suon · 2026-10-21
Most subscription apps measure churn too late: on the day someone cancels. By then the decision was made weeks earlier, in a habit that never formed or a payment that failed. This guide shows membership and subscription businesses with a companion app (gyms, coaching, streaming, meal kits and other consumer subscriptions) how to define churn and retention correctly, spot the leading indicators of churn risk, run the analyses in Firebase, GA4, BigQuery and Looker Studio, and turn what they find into experiments that reduce churn.
Executive summary
- Churn is two problems with different fixes. Voluntary churn is a decision; involuntary churn is a failed payment. In RevenueCat's 2026 report on more than 115,000 apps, nearly a third of subscription cancellations on Google Play (31%) were involuntary billing failures, more than double the 14% on the App Store. Measure them separately, or you will try to fix a payment problem with a better onboarding.
- Read retention as cohort curves, not as one monthly average. A blended churn rate mixes new subscribers with loyal ones. Cohort curves show how fast each intake drops and whether the curve flattens, which is the real sign that a group of members has found a habit.
- Most churn is decided early. Month 1 accounts for 35% of all annual-plan cancellations, and 55% of 3-day trial cancellations happen on day 0 (RevenueCat, 2026). In Amplitude's 2025 benchmark of over 2,600 companies, 69% of the products with strong day-7 activation were also strong performers at three months.
- Leading indicators beat lagging ones. A drop in usage frequency against the member's own baseline, an unfinished onboarding and missing adoption of the core feature show up weeks before the cancellation. In our illustrative example, a simple 'usage halved' flag covers 20% of subscribers and catches 59% of the next month's churners.
- Firebase and GA4 cover most of the analysis. Cohort and funnel explorations, user stickiness ratios, churn probability and predictive audiences, then the BigQuery export for anything custom and Firebase A/B Testing to test the fix with retention goals.
- Habits take months, and nudges fade. Gym habits took months to form in a study of over 30,000 gym members (PNAS, 2023). In a megastudy of 54 programmes to raise gym attendance, 45% increased weekly visits by 9% to 27% while they ran, but only 8% had a lasting measurable effect. Judge every retention experiment on retention after the nudge stops, and work one business question at a time.
Section 1 · Definitions
Define churn and retention before you measure them, or every team will report a different number
In a subscription business with a companion app, the word 'churn' is used for at least four different things: a subscriber who cancels, a payment that fails, a member who stops opening the app, and revenue lost to downgrades. They have different causes, different owners and different fixes. Finance counts cancellations, the product team counts inactive users, and the CRM team counts unsubscribes. Until the definitions are written down, the three numbers will never reconcile and every meeting will start with an argument about which one is right.
Subscription churn is the share of paying subscribers at the start of a period whose subscription ends during that period, either because they cancel (voluntary churn) or because a renewal payment fails and is not recovered (involuntary churn). Usage retention is the share of a cohort of users still active in the app after a given time. The first is what you lose; the second is usually what predicts it.
Four kinds of churn deserve their own line in the reporting:
- Voluntary churn. The subscriber turns off auto-renewal or cancels the membership. The reasons are about value: not enough use, price, a better alternative, a change in personal circumstances.
- Involuntary churn. The renewal payment fails (expired card, insufficient funds, bank decline) and is not recovered. The subscriber may not even know. App stores handle part of the recovery: on Google Play, a grace period is enabled by default, during which the user keeps access, followed by an account hold that by default lasts 60 days minus the grace period, during which access should be blocked (Android Developers).
- Revenue churn. Downgrades, discounts and plan changes that reduce revenue without a cancellation. Track net revenue retention alongside subscriber counts, or a wave of discounted 'saves' will look like a retention success.
- Usage churn, or dormancy. The member still pays but no longer uses the app or the service. For annual memberships and gyms, this is the largest hidden pool of future cancellations, because the decision to leave is made long before the renewal date.
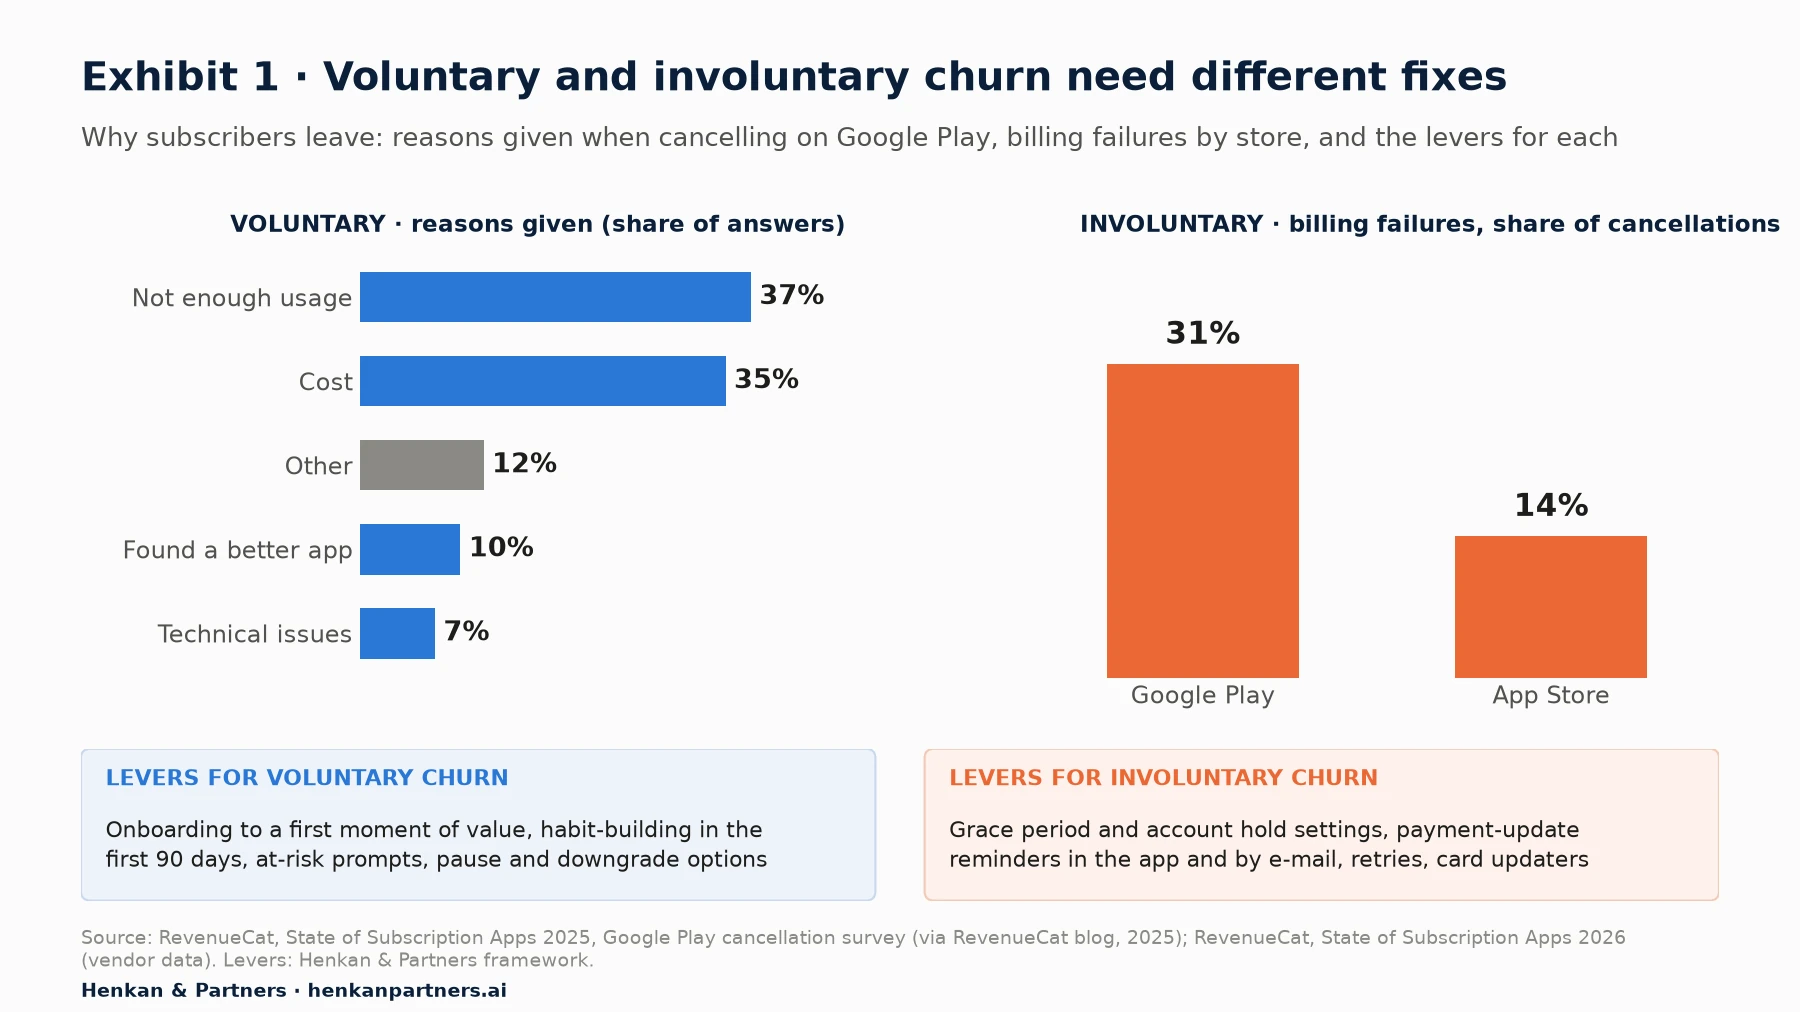
What this shows. The most common reason subscribers give for cancelling on Google Play is not price but insufficient use (37% of survey answers), just ahead of cost (35%). Both are partly visible in product analytics before the cancellation: usage falls first, and price complaints rise when people stop getting value. Involuntary churn is a different problem with a different owner: it is fixed with billing settings, payment reminders and retries, not with product changes.
Cohort retention curves are the main tool, and their shape matters more than their level
A cohort is a group of subscribers who started in the same period, for example everyone who subscribed in March. For each cohort, plot the share still subscribed (or still active) after one, two, three or more months. Three shapes are worth recognising. A curve that keeps falling towards zero means that cohort never found lasting value. A curve that flattens means a core group has formed a habit, and the height of the flat part is the retention you can build on. A curve that rises again (sometimes called a smile) means members are coming back, usually after a seasonal break or a win-back campaign.
Our funnel and cohort analysis guide explains how to build and read cohort tables in general, and the essential guide to product analytics sets out the wider method. Here we focus on what cohorts mean for subscription churn.
Monthly churn rate (month m) = subscribers lost during month m ÷ subscribers at the start of month m

Cohort retention at month m = subscribers from the cohort still subscribed at month m ÷ cohort size at the start

Retention after m months = (1 − churn in month 1) × (1 − churn in month 2) × … × (1 − churn in month m)

Stickiness = DAU ÷ MAU (or DAU ÷ WAU, WAU ÷ MAU)
Stickiness measures how often active users come back. GA4 calculates the DAU/MAU, DAU/WAU and WAU/MAU ratios automatically, where DAU is the number of active users in the last 24 hours, WAU in the last 7 days and MAU in the last 30 days (Google Analytics Help). Choose the ratio that matches the natural rhythm of the product. A meditation app may expect daily use. A gym member who trains three times a week will never reach a high DAU/MAU and should be judged on WAU/MAU, or on the number of weeks with at least two sessions.
| Metric | Definition | Use it to answer | Watch out for |
|---|---|---|---|
| Voluntary churn rate | Cancellations in the period ÷ subscribers at the start | Is the product delivering enough value? | Annual subscribers often turn off renewal months before the plan expires |
| Involuntary churn rate | Failed renewals not recovered ÷ renewals due | Is billing recovery working? | Store billing and web or direct-debit billing behave differently |
| Cohort retention curve | Share of a start cohort still subscribed or active at month m | Are newer cohorts doing better than older ones? | Mixing annual and monthly plans in the same curve |
| Stickiness (DAU/MAU, WAU/MAU) | Recent active users ÷ monthly active users | Is the habit getting stronger? | Products that are naturally weekly will look weak on DAU/MAU |
| Net revenue retention | Revenue from a cohort in month m ÷ its revenue in month 0 | Are we keeping value, not only members? | Upgrades can hide subscriber losses |
| Reactivation rate | Share of churned subscribers who resubscribe within 12 months | Is win-back worth investing in? | Some tools count a returning subscriber as new |
Our view. Define one 'active' event per product: the event that represents value, such as a workout logged, a class booked, an episode watched past a few minutes or a meal-kit week not skipped. Do not use app opens. App opens include people who open the app to find the cancel button.
Section 2 · Benchmarks
Benchmarks set expectations, but your own cohorts are the only comparison that counts
Published benchmarks agree on one pattern: most users leave quickly, and those who stay past the first weeks are much more likely to stay for months. The figures below come from vendors' customer bases and use different definitions, so treat them as orders of magnitude rather than targets.
- App usage. Across Adjust's data, median retention for all apps was 26% on day 1, 13% on day 7 and 7% on day 30; health and fitness apps reached 27% on day 1 (Adjust, 2024, vendor data).
- Subscription plans. In RevenueCat's 2026 report, first-year retention of annual plans fell from 31% to 28% year on year, monthly plans from 10% to 8%, and weekly plans from 1.7% to 1.2% (vendor data).
- Early cancellations. Month 1 accounts for 35% of all annual-plan cancellations (23% to 50% depending on the category), and 55.4% of 3-day trial cancellations happen on day 0 (RevenueCat, 2026).
- Win-back. Only about 5% of churned annual subscribers reactivate within a year, against 20% of churned monthly subscribers (RevenueCat, 2026).
- Activation and long-term retention. Amplitude's 2025 Product Benchmark Report, based on over 2,600 companies, found that 69% of products with strong day-7 activation were also strong three-month performers, and that having 7% of a cohort return on day 7 puts a product in the top 25% (vendor data).
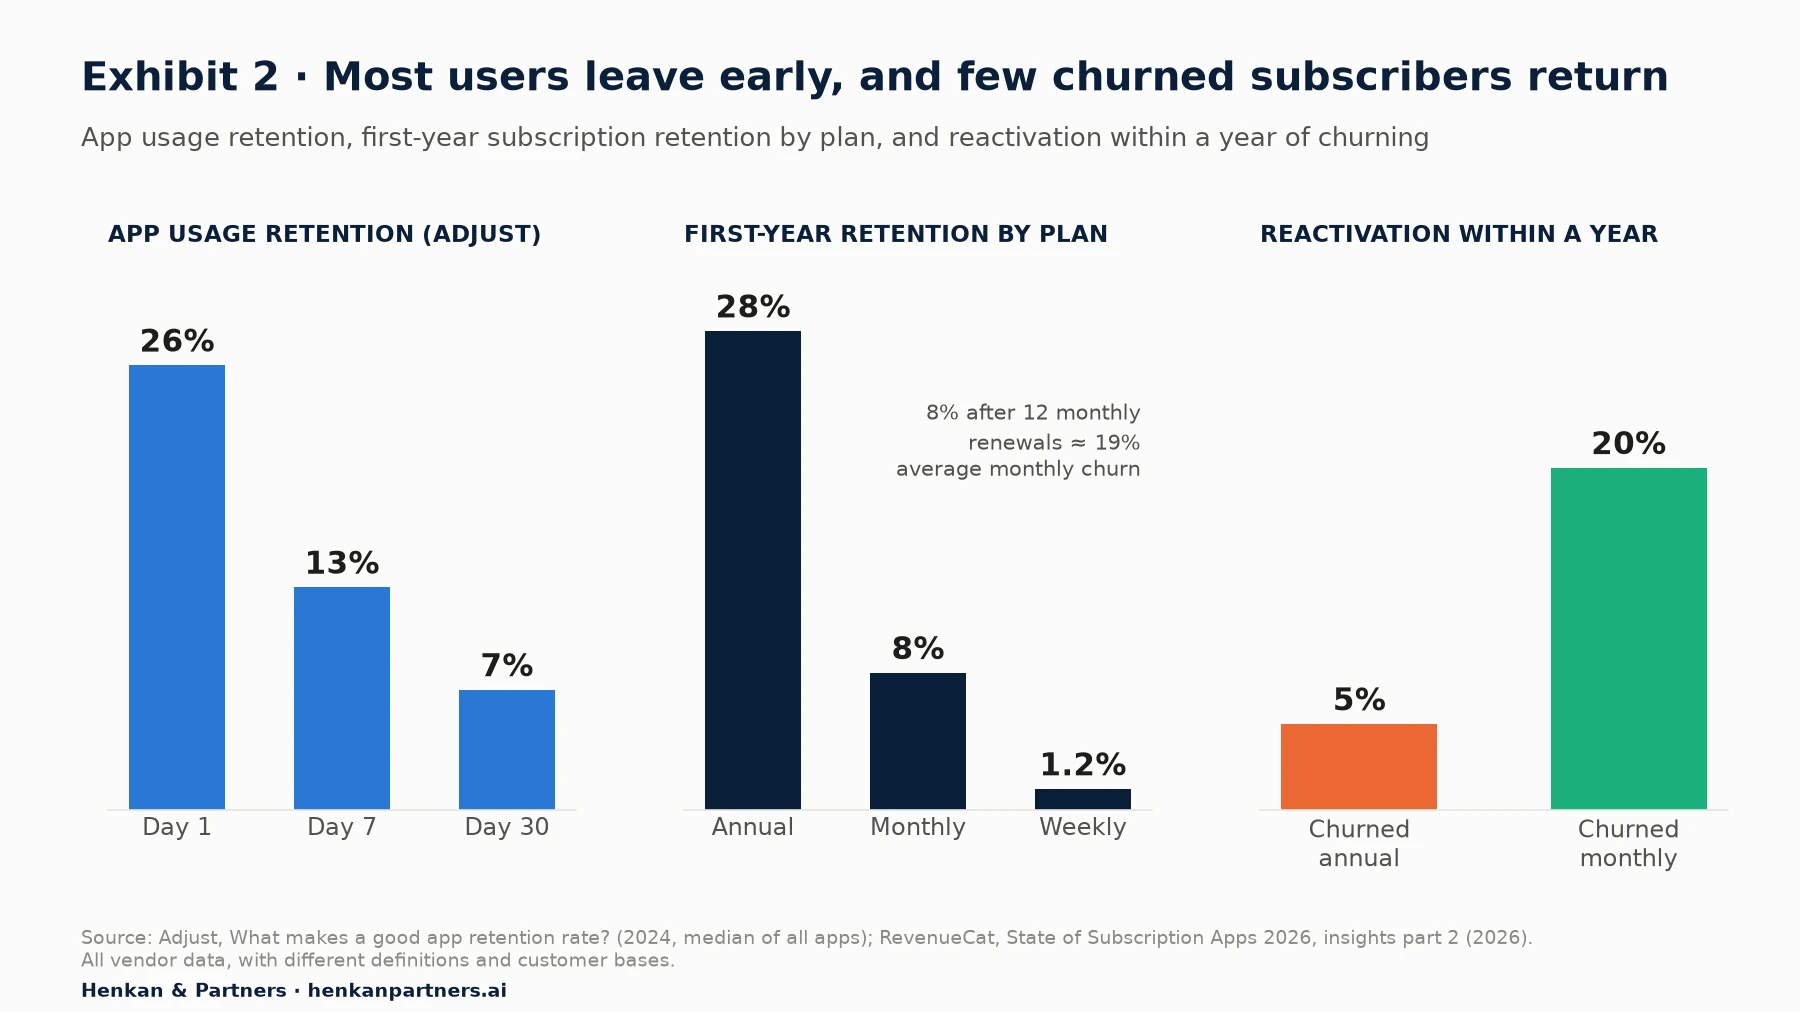
What this shows. Retention losses are front-loaded in usage and in billing. A monthly plan that keeps 8% of subscribers after a year loses about 19% of the remaining base each month on average. And once an annual subscriber has gone, only one in twenty comes back within a year. Prevention is worth far more than win-back, which is why the rest of this guide concentrates on the early warning signs.
Two cautions before you compare yourself with these numbers. First, most of these benchmarks describe app-store subscriptions. A gym or coaching membership billed by direct debit, with a contract and a physical service, will have very different curves. Second, plan mix drives the averages: a business that moves members from monthly to annual plans will see churn fall for a year and then arrive all at once at renewal. Your own cohorts from last year are the only benchmark that shares your definitions, your prices and your customers. Our article on e-commerce KPIs and benchmarks discusses the same problem for online retail.
Section 3 · Leading indicators
Churn is visible weeks before the cancellation, in four leading indicators
A cancellation is a lagging indicator: it records a decision already made. Product analytics earns its keep by finding the behaviour that comes before that decision, while there is still time to act. Four indicators do most of the work in subscription apps:
- Declining usage frequency. Compare each subscriber's recent activity with their own baseline, not with the average. A member who trained four times a week and now trains once is at higher risk than one who has always trained once. In the gym study described below, the time since the previous visit was an important predictor of attendance for 76% of members (Buyalskaya et al., 2023).
- Onboarding completion. Did the new subscriber finish set-up and reach a first moment of value (goals set, first workout logged, first class booked, first recipes chosen) within a defined window, such as 14 days?
- Core feature adoption. Which features do retained subscribers use that churned subscribers did not? Our guide to measuring feature adoption in GA4 covers the explorations step by step.
- Habit formation. Regularity matters as much as volume: the same days of the week, a run of consecutive active weeks, a stable time of day. A member whose behaviour has become predictable is less likely to leave.
Add a few negative signals to these four: crashes and errors for the user, notifications disabled, a payment method about to expire, a support contact about billing or cancellation. None of them is decisive alone, but together they make a usable risk score.
The aha moment is the first time a new user experiences the core value of the product, such as completing a first full workout plan or cooking a first box. Teams often look for it in the data as a behaviour that separates retained users from churned ones. Treat any such threshold as a hypothesis to test, not a finding: users who would have stayed anyway also reach it more often.
An illustrative usage-decline flag
Consider an illustrative membership app with 8,000 active subscribers at the start of a month. The team defines a simple flag: a subscriber is 'down 50% or more' when their active weeks over the last four weeks are less than half their average in their first eight weeks. No machine learning, just a comparison with each member's own baseline, computed in BigQuery every Monday. The figures are illustrative, but the pattern is typical.
| Segment | Share of subscribers | Subscribers | Churn in next 30 days | Churners | Share of all churners |
|---|---|---|---|---|---|
| Usage steady or rising | 65% | 5,200 | 4% | 208 | 27% |
| Usage down 25–50% | 15% | 1,200 | 9% | 108 | 14% |
| Usage down 50% or more (flag) | 20% | 1,600 | 28% | 448 | 59% |
| All subscribers | 100% | 8,000 | 9.6% | 764 | 100% |
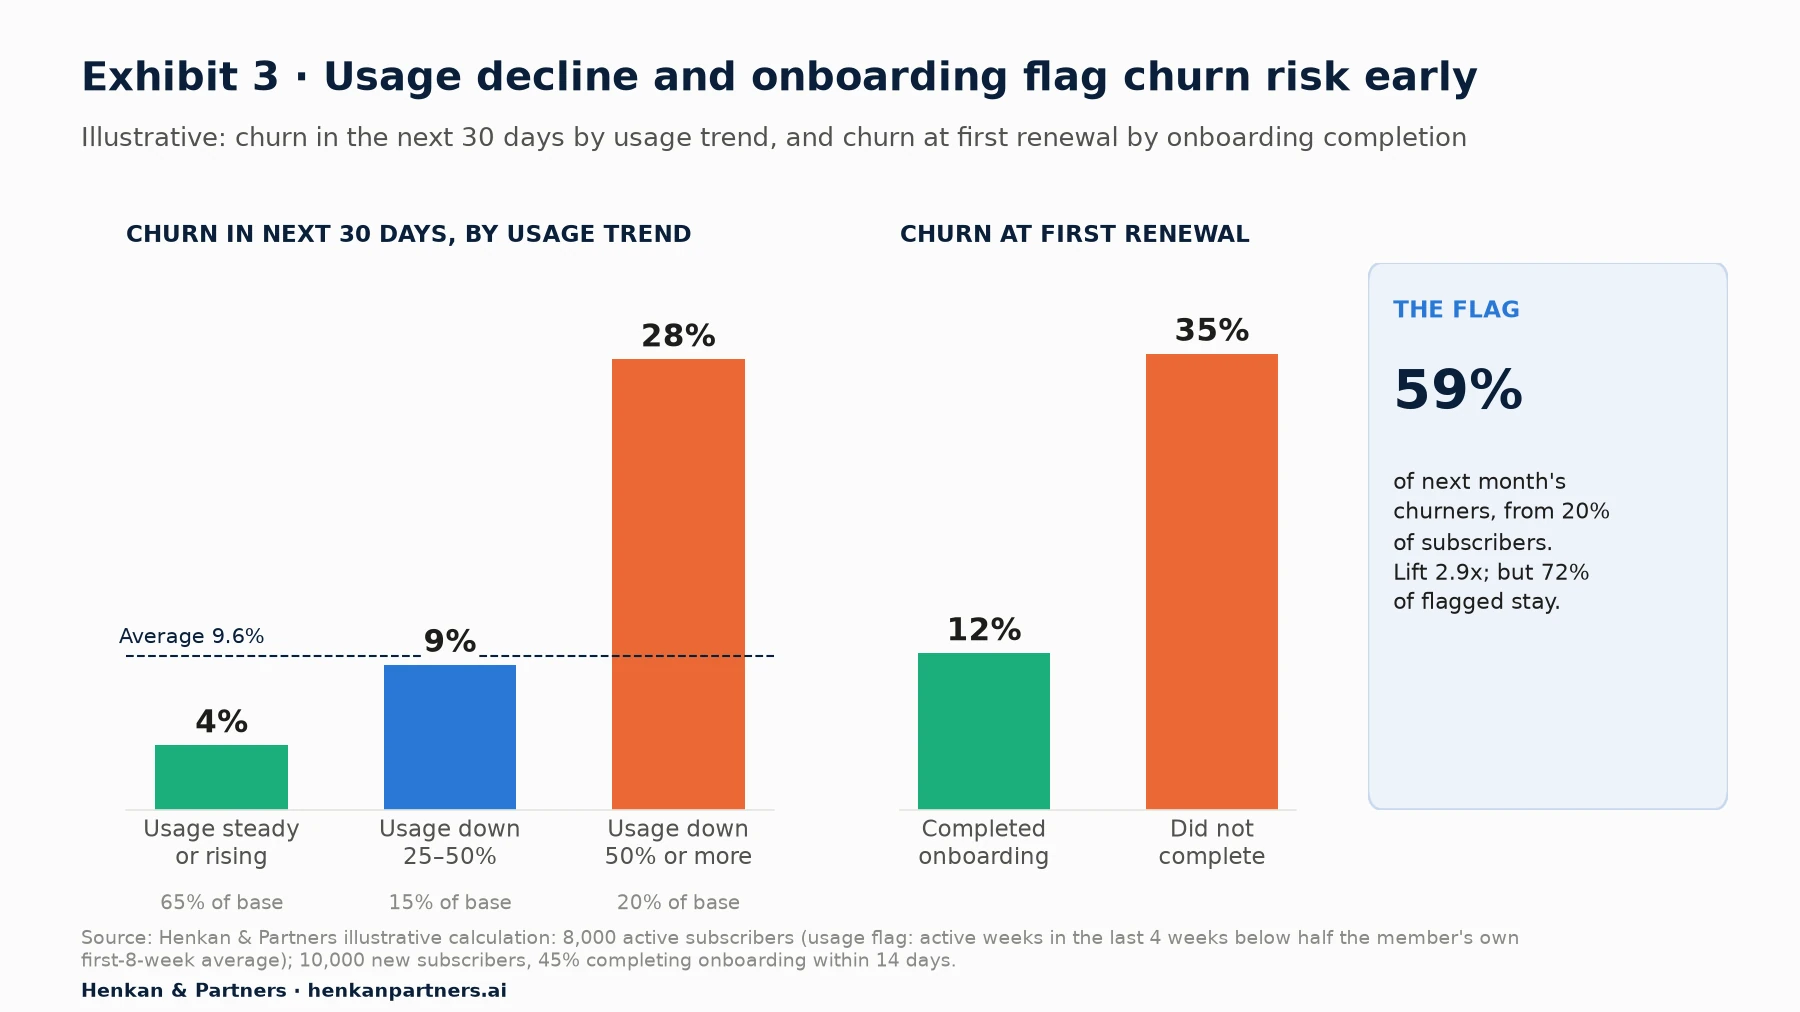
What this shows. The flagged group churns at 2.9 times the average rate. By looking at one subscriber in five, the team reaches 59% of next month's churners, early enough to act. The flag is far from perfect: 72% of flagged members would not have left anyway. That is why the first response to a risk flag should be something helpful and cheap, such as a lighter plan for the week or a coach message, rather than a discount that would be given away to many people who would have stayed.
Habit research explains why the first months decide retention
Habit research gives three useful facts for subscription apps, and all three point to the first months:
- Habits take longer than folklore says. In a study of 96 volunteers (82 completed) who chose a daily eating, drinking or exercise behaviour, the time to reach maximum automaticity averaged 66 days, with individual estimates from 18 to 254 days. Exercise habits took about one and a half times as long to plateau as eating or drinking habits, and missing a single day did not materially affect the process (Lally et al., 2010).
- Exercise habits take months. Using machine learning on more than 12 million gym visits from over 30,000 members and more than 40 million hospital hand-washing events, researchers found that gym habits typically took months to form (about six months on average), against a few weeks for hand-washing. Members whose attendance had become more predictable also responded less to an intervention to increase attendance (Buyalskaya et al., 2023).
- Nudges work while they run, then mostly fade. In a megastudy with 61,293 members of an American fitness chain, 54 four-week digital programmes were tested. 45% of them significantly increased weekly gym visits, by 9% to 27%. The best performer offered small rewards for returning after a missed workout. But only 8% produced a significant, measurable effect after the programme ended, and expert forecasts did not reliably identify the winners in advance (Milkman et al., 2021).
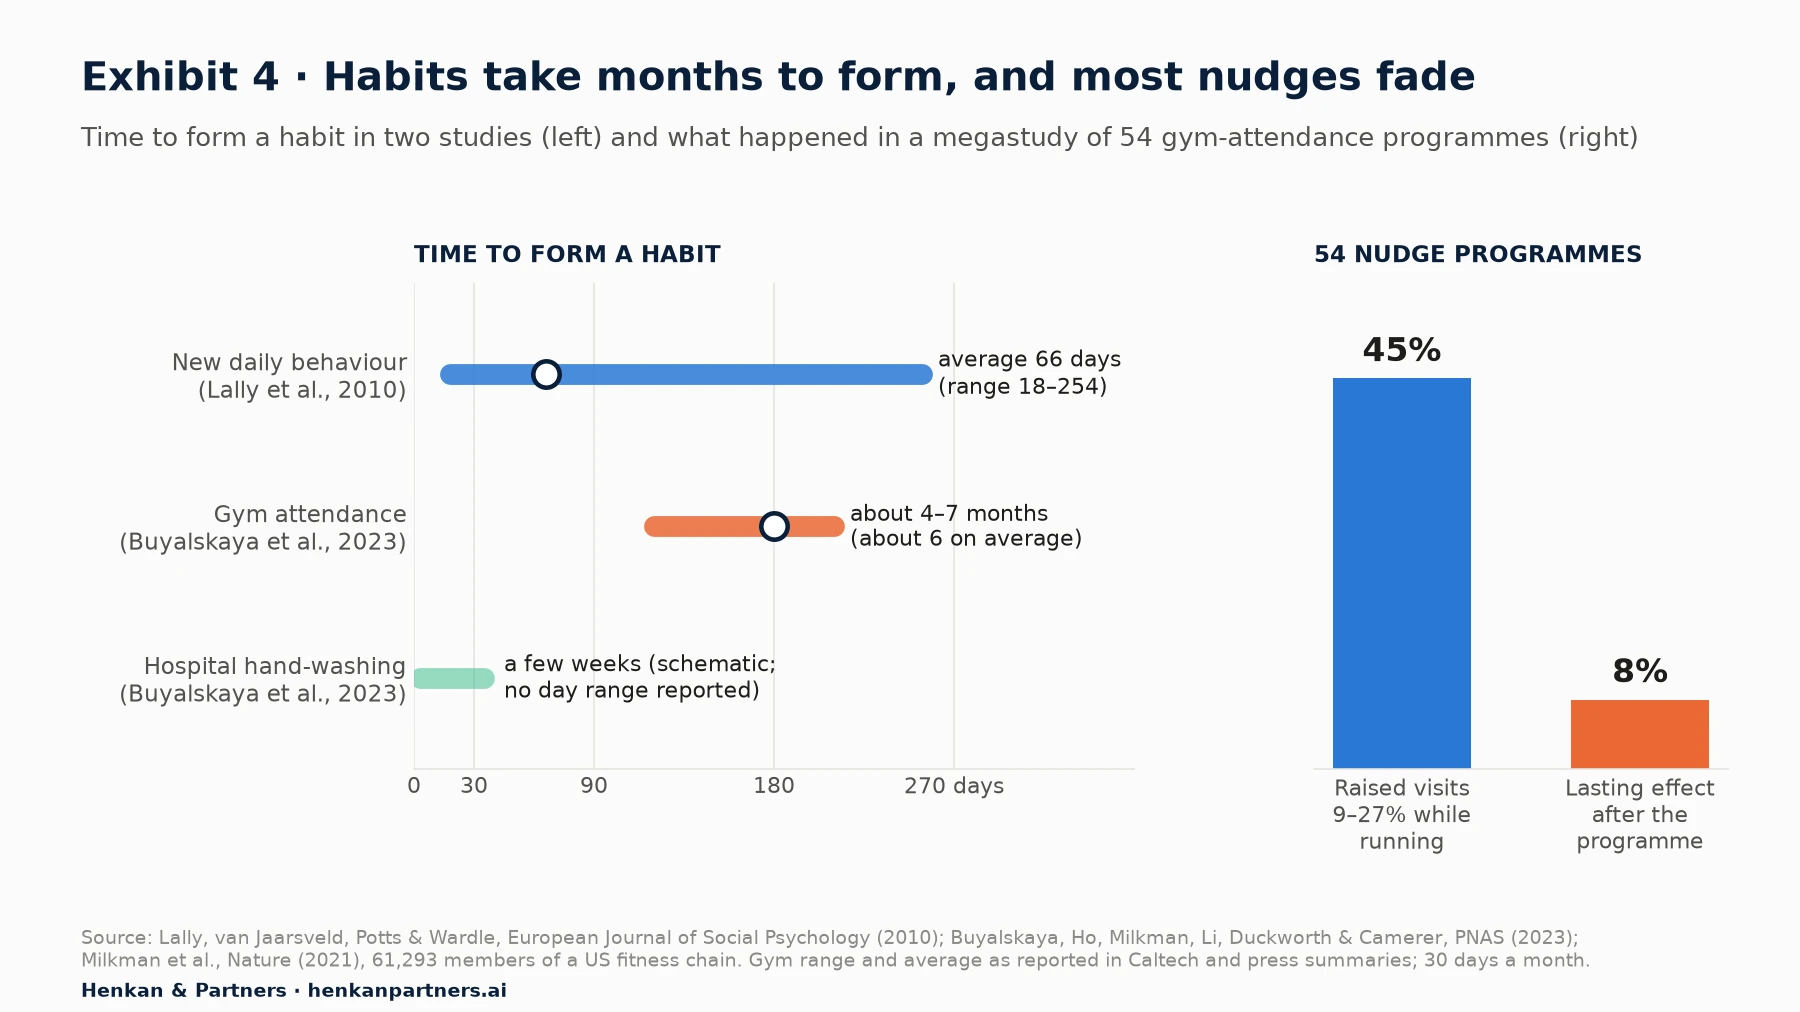
What this shows. The window in which a new member either forms a habit or drifts away is measured in weeks to months, not in the first session. And a programme that raises activity while it runs proves little on its own: what matters is whether activity, and renewals, stay higher once the programme stops.
Our view. For membership businesses, onboarding is not the first session but the first 8 to 16 weeks. Design a 'first 90 days' programme that builds a weekly rhythm, and measure it on retention in month four, not on onboarding screens completed.
Section 4 · Firebase and GA4
Firebase, GA4, BigQuery and Looker Studio cover most churn analyses, if the events are right
Firebase's analytics is Google Analytics 4 for apps: the same events, the same reports and the same BigQuery export. Most of what a subscription app needs is already collected automatically. The gap is almost always the value event: the custom event that says the member actually used the service.
| Event | What it records | Platforms | Note |
|---|---|---|---|
| first_open | First launch after an install or reinstall | Android and iOS | Does not fire on download |
| session_start, user_engagement | Activity; user_engagement fires when the app is in the foreground for at least one second | Android and iOS | Too weak to define 'active' for churn work |
| in_app_purchase | A completed store purchase, including an initial subscription | Android and iOS | Test and sandbox purchases are ignored |
| app_store_subscription_convert, app_store_subscription_renew | A free trial converts to paid; a paid subscription renews (both default key events) | Android and iOS | Initial subscriptions from 1 July 2019 onwards |
| app_store_subscription_cancel | A paid subscription is cancelled in Google Play | Android only | For iOS, use App Store Server Notifications on your server |
| app_remove | The app is uninstalled | Android only | A useful guardrail for notification tests |
| notification_open | The user opens a Firebase Cloud Messaging notification | Android and iOS | notification_receive and notification_dismiss are Android only |
| Your value events | workout_logged, class_booked, onboarding_step, plan_paused… | Android and iOS | Define them in the tracking plan with a user ID |
If members pay outside the app stores, by direct debit, at a club desk or on the web, the subscription status lives in a billing or membership system, not in Firebase. Set the same user ID in both systems, and join them in BigQuery. Without that join, you can measure usage retention but not churn.
Five analyses to run, in this order
- Cohort exploration for retention. In GA4 Explore, cohort inclusion can be first touch, any event, any transaction, any conversion or a specific event: use your subscription-start event. Set the return criterion to your value event, not 'any event'. Weekly cohorts run from Sunday to Saturday, not on a rolling seven days. Choose standard, rolling or cumulative calculation, and break cohorts down by plan, acquisition source or onboarding status. The exploration shows at most 60 cohorts and the top 15 values of a breakdown dimension (Google Analytics Help).
- Funnel exploration for onboarding. Build the steps from first_open to the first value event, show elapsed time between steps, and compare open and closed funnels. The step with the largest drop and the longest delay is the first candidate for an experiment.
- Stickiness trend. Plot DAU/MAU or WAU/MAU by month in Looker Studio, next to the share of subscribers active in at least two of the last four weeks. A rising stickiness ratio usually shows up in cohort curves a few months later.
- Predictive metrics and audiences. GA4's churn probability is 'the probability that a user who was active on your app or site within the last 7 days will not be active within the next 7 days'. The 'Likely 7-day churning users' audience template selects users above the 80th percentile of churn probability, and 'Likely 7-day churning purchasers' does the same for users who have purchased. To be eligible, at least 1,000 returning users must have triggered the condition, and 1,000 must not have, over a seven-day period in the last 28 days, with sustained model quality (Google Analytics Help). Note that this 'churn' means seven days of inactivity, not a cancelled subscription, and that a new audience collects users from its creation onwards.
- BigQuery export for anything custom. Usage against each member's own baseline, joins with billing data, survival curves by plan and lifetime value all need raw events. For standard GA4 properties, the daily export allows up to 1 million events a day; the streaming export has no volume limit but costs $0.05 per gigabyte, on top of BigQuery storage and query costs (Google Analytics Help). Our GA4 BigQuery export guide covers the schema and first queries.
-- Active weeks per member, from the GA4 / Firebase BigQuery export (illustrative)
SELECT
  user_id,
  DATE_TRUNC(PARSE_DATE('%Y%m%d', event_date), WEEK(MONDAY)) AS week,
  COUNT(*) AS value_events
FROM `your-project.analytics_XXXXXXX.events_*`
WHERE event_name = 'workout_logged'
  AND _TABLE_SUFFIX BETWEEN '20260701' AND '20260930'
GROUP BY user_id, week

-- Flag: active weeks in the last 4 weeks < 50% of the member's average over their first 8 weeks
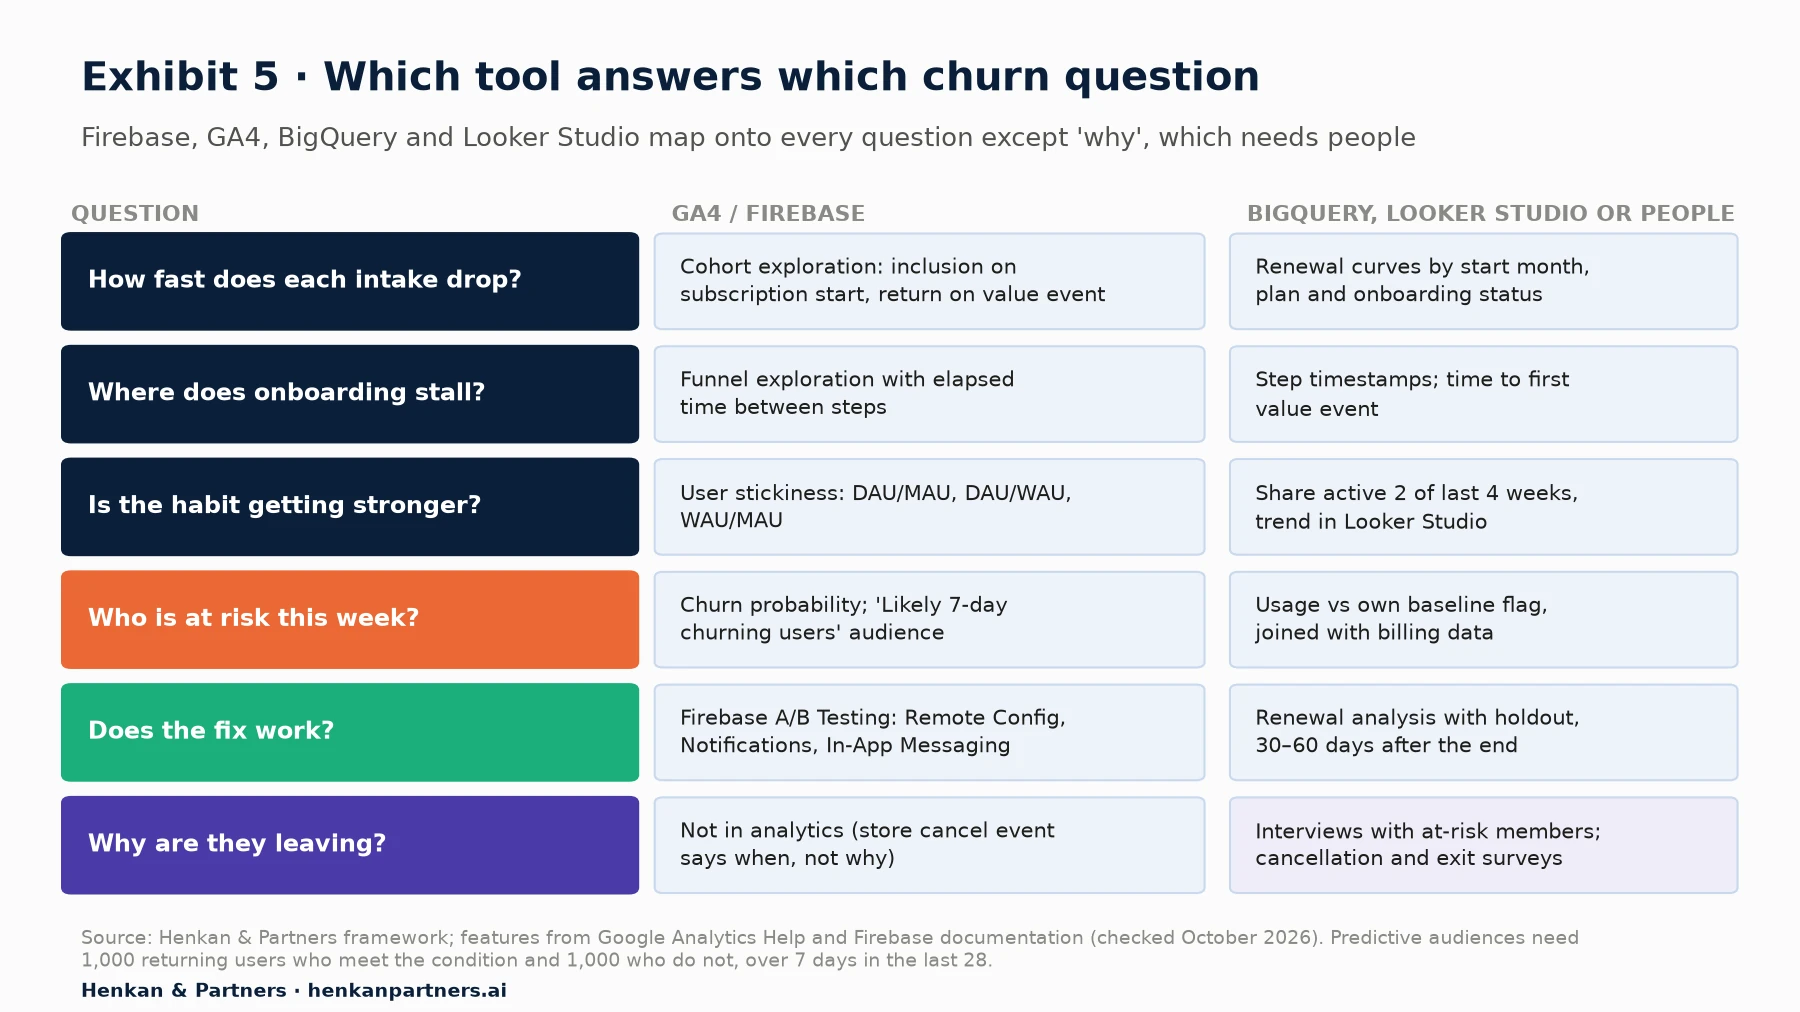
What this shows. Every question except 'why' has a native answer in the Google stack, and BigQuery is where the answers can be combined with billing data and checked. Predictive audiences are useful for activation campaigns but are a black box with eligibility thresholds that many smaller apps will not meet; a transparent usage-versus-baseline flag in BigQuery is often the better starting point. The 'why' column is deliberately outside analytics, which is the subject of Section 7.
For product managers. Ask for the value event and a user ID before any churn dashboard. Without them, every chart measures app opens.
For leaders. Ask for one churn view split three ways: voluntary, involuntary and dormant-but-paying. If the team cannot produce it, the first investment is in data, not in campaigns.
Section 5 · Worked example
A worked example: what a better onboarding is worth, and how to prove it
Take an illustrative coaching app sold as a monthly subscription at €15, with 10,000 new subscribers a month. The team defines onboarding completion as 'goals set and three workouts logged within 14 days'. In the last cohorts, 45% of new subscribers complete it. Completers churn 12% at the first renewal and 6% a month afterwards; non-completers churn 35% at the first renewal and 10% a month afterwards.
| Metric (illustrative) | Completers (45%) | Non-completers (55%) | Whole cohort |
|---|---|---|---|
| Churn at first renewal | 12% | 35% | 24.7% |
| Monthly churn after month 1 | 6% | 10% | — |
| Retention after 6 months | 64.6% | 38.4% | 50.2% |
| Retention after 12 months | 44.6% | 20.4% | 31.3% |
| First-year revenue per subscriber (€15 a month) | €123.61 | €81.90 | €100.67 |
Now suppose a new onboarding raises completion from 45% to 55%. If the extra completers behave like today's completers, the cohort's first-year revenue rises from €1,006,734 to €1,048,445, or €41,711 per monthly cohort. That is an upper bound. Completers are partly self-selected: people who were more motivated to begin with. If only half the gap is caused by onboarding itself, the gain is about €20,855 per cohort. Across twelve monthly intakes, that is between about €250,000 and €500,000 of first-year revenue, enough to justify serious work, but only if an experiment confirms the causal part.
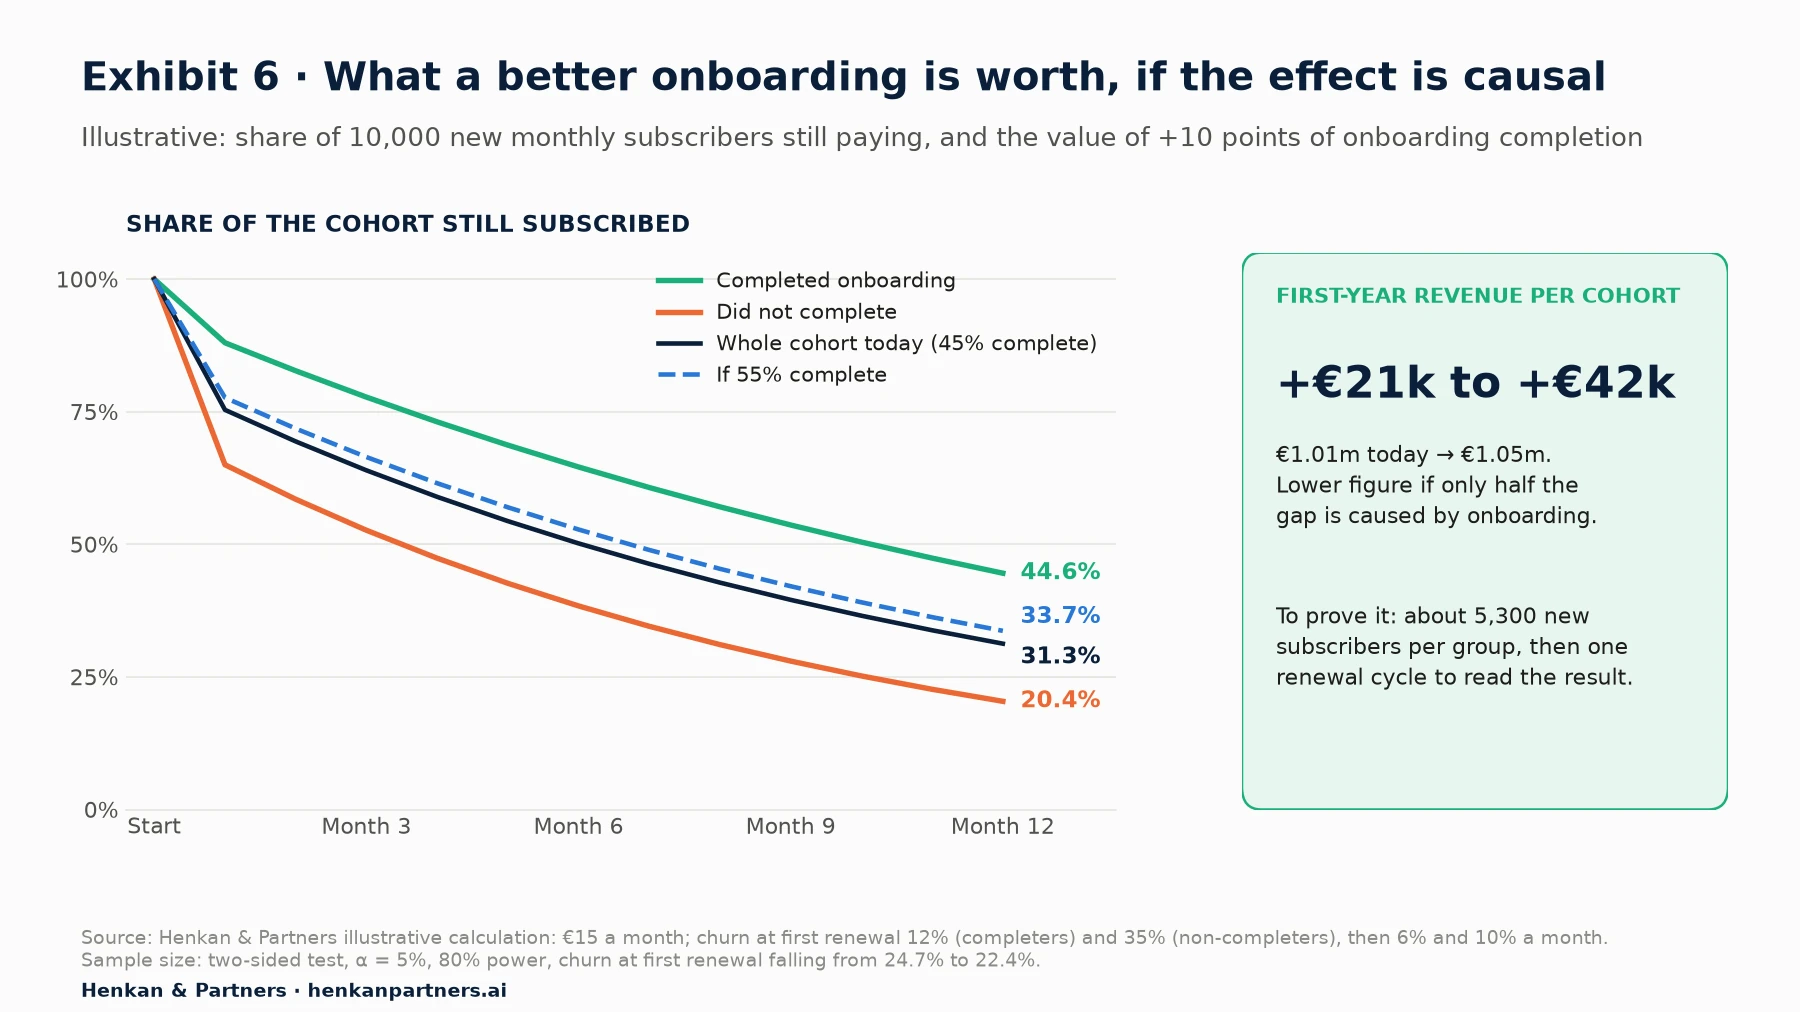
What this shows. The gap between the two curves is the size of the prize, not proof of it. The proof comes from a test: half of new subscribers get the new onboarding, half the current one, and the primary metric is churn at the first renewal. To detect a fall from 24.7% to 22.4% with a two-sided test at 5% significance and 80% power, the test needs about 5,300 new subscribers per group, roughly one month of intake, and then another month to observe the renewals. Our guide to A/B test sample size and duration shows the calculation.
One practical detail: Firebase A/B Testing offers built-in goals of Retention (1 day), Retention (2–3 days), Retention (4–7 days), Retention (8–14 days) and Retention (15+ days), plus revenue and crash-free users (Firebase documentation). Those are usage retention goals. For a renewal-based primary metric, use the subscription events or your billing data, and analyse the experiment in BigQuery with the experiment assignment exported from Firebase.
Section 6 · Experiments
Turn each finding into an experiment, and judge it on retention after the nudge stops
Analysis finds correlations; only experiments show which changes reduce churn. Every finding from the previous sections can be written as a testable change, with a primary metric measured on retention and guardrails that catch the damage a retention tactic can do.
| Finding | Experiment | Primary metric | Guardrails |
|---|---|---|---|
| Non-completers churn three times more at first renewal | Shorter set-up; a first plan delivered in the first session; goal-based reminders in week 1 | Churn at first renewal | Trial-to-paid conversion, support contacts |
| Usage halved predicts churn | In-app 'plan your week' prompt or coach message when the flag fires | Active weeks in the next 4 weeks, then 60-day renewal | Notification opt-outs, uninstalls |
| Missed sessions break the rhythm | An easy restart after a missed session (short workout, small reward) | Return within 7 days; activity after the programme ends | Reward cost, complaints |
| Push messages are generic | Frequency and personalisation test, with a no-push holdout | Retention at 30 and 60 days | Uninstalls, notification opt-outs |
| Cancellations cluster after holidays or injury | Offer a pause or a lighter plan in the cancellation flow | Subscribers still paying at 90 days | Refund requests, complaints, revenue per subscriber |
| Payment failures are a large share of churn | Longer grace period, in-app and e-mail payment-update reminders | Recovered renewals | Access cost during the grace period |
| Churned subscribers rarely return | Win-back offer to recently churned subscribers | Reactivated and still paying after 90 days | Margin per reactivated subscriber, re-churn |
Each line uses tools that already exist. Firebase A/B Testing can run experiments on Remote Config, the Notifications composer and In-App Messaging (Firebase documentation), and Remote Config conditions can target Analytics audiences and user properties. Google Play enables subscription pauses by default, for one to three months on monthly and longer plans, and the pause takes effect at the end of the current billing period (Android Developers). On the App Store, win-back offers give a free or discounted period to subscribers whose subscription has expired and will not auto-renew, with eligibility rules set in App Store Connect (Apple Developer).
Push notifications need particular care, because they can buy short-term activity at the cost of long-term reach. In an experiment with 17,500 users of a retailer's app, five push frequencies were tested over seven weeks: as the frequency of non-personalised notifications increased, uninstalls rose and the direct open rate fell (Wohllebe et al., 2021). Permission also limits reach: on Android 13 and later, notifications are off by default for newly installed apps until the user grants the permission (Android Developers). Analyse every notification test on all assigned users, not only those who opted in.
- Randomise at the user level and keep a holdout. For lifecycle messages, a permanent holdout group that receives none of them is the only way to know what the programme adds. Our article on measuring personalisation ROI explains how to size it.
- Choose retention or renewal as the primary metric. Opens and clicks are secondary metrics. A message that raises opens but not renewals has not reduced churn.
- Add guardrails. Uninstalls, notification opt-outs, refunds and support contacts. Our guide to guardrail metrics shows how to set harm thresholds.
- Read the result after the intervention ends. The megastudy above found lasting effects for only 8% of programmes. Plan a follow-up reading 30 to 60 days after the test closes.
- Size the test before launch. Renewal-based metrics need whole billing cycles, so a test can take two to three months. Decide in advance whether you can afford it.
Our view. Discounts are the most expensive save offer and the easiest to over-use. Our default order in a cancellation flow is: solve the problem (a lighter plan, a schedule change), then pause, then downgrade, and only then a discount, tested against a holdout.
Section 7 · Qualitative research
Numbers show who is about to leave; interviews with at-risk users show why
Product analytics shows behaviour, not reasons. A usage drop can mean an injury, a new job, a move, a competing app or a programme that got boring, and each needs a different response. Interviews fill that gap, as long as they are run with the right people at the right time. Nielsen Norman Group reminds researchers that interviews collect reported behaviour rather than observed behaviour, and recommends asking about specific past events ('Tell me about the last time you…') rather than general habits (Rosala and Pernice, NN/g, 2023).
- Recruit from the risk flag, before people cancel. Five to eight members from the flagged group, five who cancelled in the last 30 days, and five loyal members for contrast. Interviews with people who left months ago produce rationalisations; interviews with people who are drifting now produce the real story.
- Ask about the last weeks, not about the app. 'Tell me about the last week you trained. What was different from a month ago?' Then about the moment they thought about cancelling, and what they did next.
- Code the answers into the same categories as the cancellation survey. Not enough use, cost, a better alternative, technical problems, other. This lets you compare the interview themes with the survey shares in Exhibit 1.
- Write each pattern as a hypothesis. 'Members who miss two weeks after a holiday do not restart because the plan feels too hard; an easy restart week will raise return within 7 days.' Our guide from customer insight to test backlog shows how to prioritise them.
- Close the loop. Tag interviewed members in your data and check, two months later, who churned. It keeps the team honest about which signals really mattered.
Scale comes from surveys. Google Play's cancellation survey, as reported by RevenueCat, shows the mix of reasons across many apps; your own in-app or exit survey can show it for your members, but only if the answer options are mutually exclusive and stable over time. Our article on on-site survey design applies equally to in-app surveys.
Section 8 · Cadence
Answer one business question at a time, on a fixed four-week cycle
Churn dashboards often fail for a simple reason: they try to answer every question a little, so no question is answered well enough to act on. A question-led cadence works better. Each cycle starts with one business question, chosen by the people who will act on the answer, and ends with a decision and a record of what was learned.
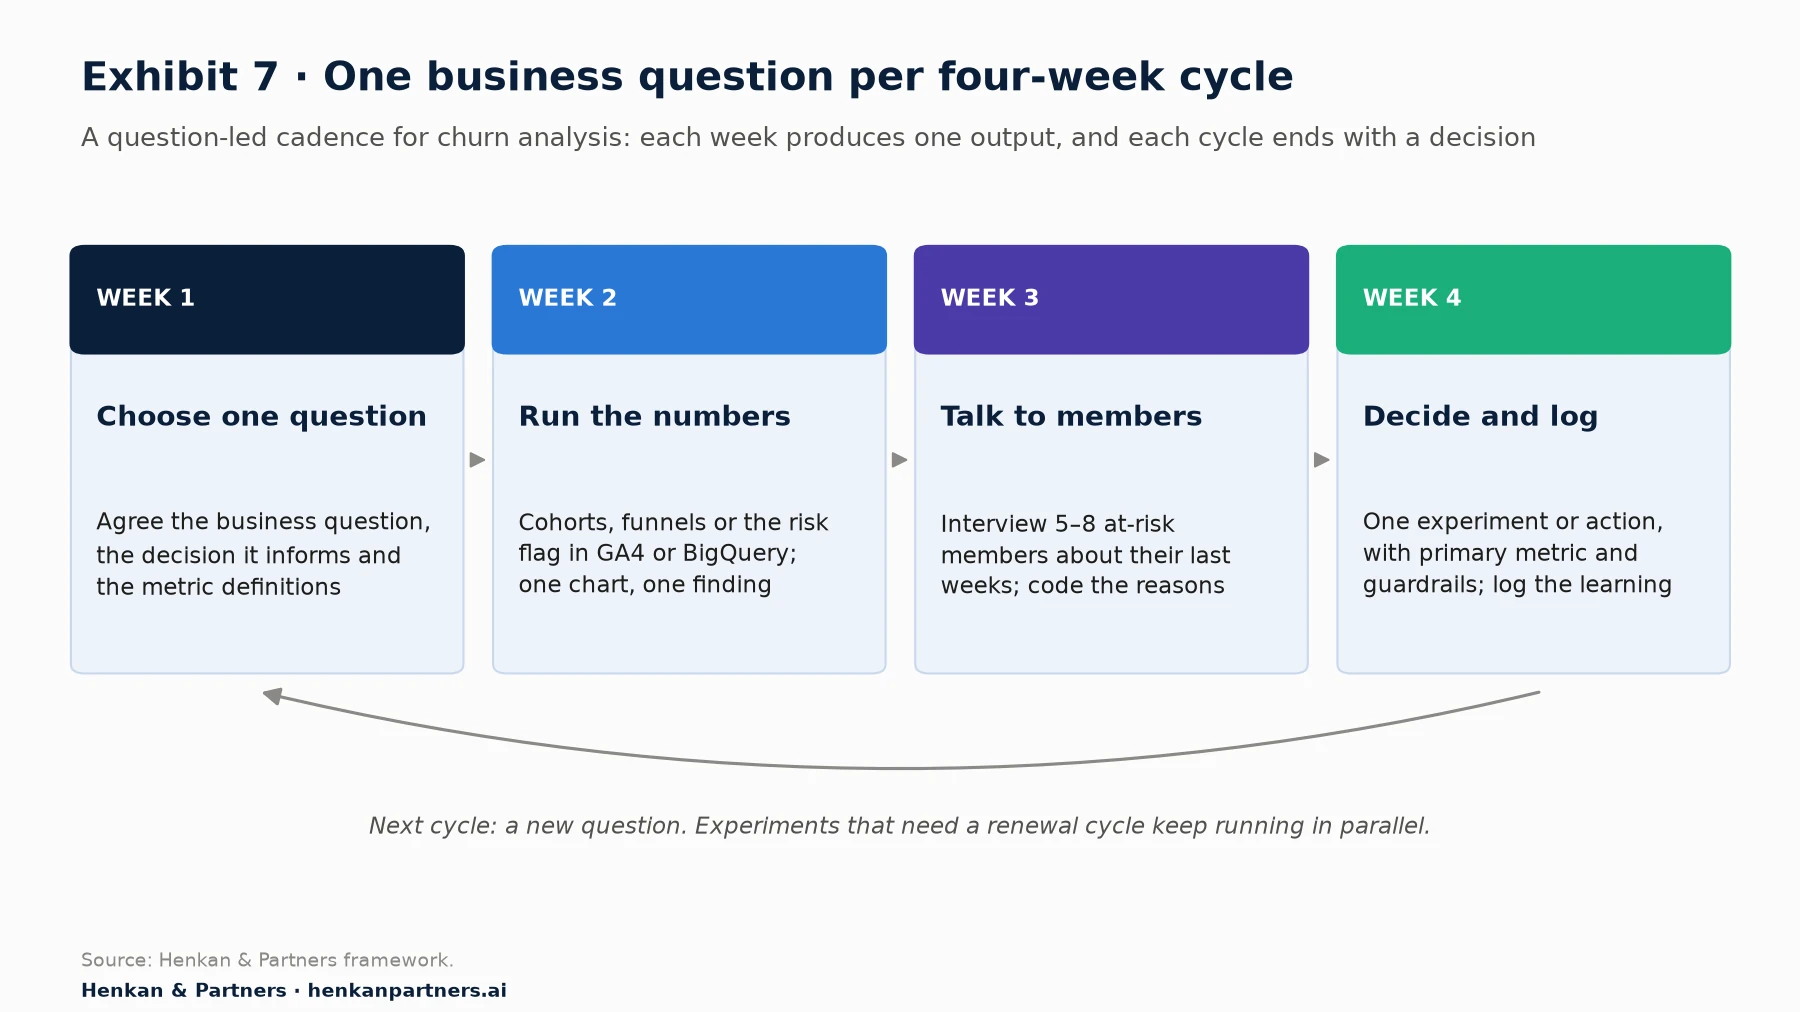
What this shows. Each week has one output: a written question, a chart, five to eight interview notes, a test plan or decision. The cycle is short enough to keep momentum and long enough to include the qualitative step that most analytics routines skip. Questions that need a renewal cycle to answer feed experiments that run in parallel with the next cycles.
| Business question | Analysis | Tool | Decision it informs |
|---|---|---|---|
| Are this year's cohorts retaining better than last year's? | Cohort curves by start month and plan | GA4 cohort exploration, BigQuery | Whether recent product changes worked |
| Where do new subscribers stall? | Onboarding funnel with elapsed time | GA4 funnel exploration | Which onboarding step to test first |
| What do retained members do in their first 30 days? | Feature adoption by retention outcome | BigQuery, Looker Studio | Which aha-moment hypothesis to test |
| How much of our churn is involuntary? | Failed renewals against cancellations | Store or billing data | Whether to invest in billing recovery |
| Who is at risk this week? | Usage-against-baseline flag; churn probability | BigQuery, predictive audiences | Which members get a lifecycle message |
| Did the last intervention still work after it stopped? | Holdout comparison 30–60 days after the end | Firebase A/B Testing, BigQuery | Keep, iterate or stop |
For leaders. Ask for one question per month and one decision per month. A team that answers twelve churn questions a year, each with a decision, will learn more than one that maintains a forty-chart dashboard.
For analysts. Write the question and the decision it will inform before running the query. If no decision depends on the answer, choose another question.
Section 9 · Mistakes
Seven mistakes that make churn analysis confidently wrong
- One blended churn rate. A single monthly figure mixes new and loyal members, monthly and annual plans. It moves when the mix moves, not when the product improves. Use cohorts.
- Mixing voluntary and involuntary churn. A payment failure fixed with a new onboarding will never move. Split the two from the first report.
- Counting app opens as activity. Members open the app to cancel, to check a bill or because of a notification. Define 'active' with a value event.
- Treating correlations as causes. Members who use a feature stay longer, but motivated members also use more features. Treat every 'aha moment' as a hypothesis for an experiment.
- Measuring nudges on opens and clicks. The only metric that counts is retention or renewal, measured after the nudge stops.
- Reading GA4 'churn' as cancellation. GA4's churn probability predicts seven days of inactivity. It is useful for engagement, but it is not a subscription-churn model.
- Discounting everyone at risk. Risk flags are imprecise: in our illustrative example, 72% of flagged members would have stayed. A blanket discount gives margin away to them, and it teaches members to threaten to cancel.
Section 10 · What to do next
What to do next
1. Write the churn definitions and the value event
Agree in one page what counts as voluntary churn, involuntary churn, dormancy and an active member, and which event represents value. Add the value event and a user ID to the tracking plan if they are missing.
2. Split voluntary and involuntary churn this month
Pull cancellations and failed renewals from the stores or your billing system, and report them separately. Check your grace period and payment reminder settings at the same time.
3. Build cohort curves by start month and onboarding status
Use the GA4 cohort exploration for usage retention and BigQuery for renewals. Compare this year's cohorts with last year's, and completers with non-completers.
4. Set up a usage-decline flag and interview at-risk members
Compute each member's activity against their own baseline every week, and interview five to eight flagged members before they cancel.
5. Run one retention experiment with a holdout
Pick the finding with the largest prize, test it with retention or renewal as the primary metric, and read it again after the intervention ends. Henkan & Partners helps subscription and membership businesses set up product analytics, churn analysis and retention experiments in the tools they already use. Talk to us.
FAQ
Frequently asked questions about reducing churn in a subscription app
Frequently asked questions
What is the difference between churn and retention?
Churn is the share of subscribers lost during a period; retention is the share of a starting group still subscribed or active after a given time. For a single cohort, retention after several months is the product of one minus each month's churn rate.
What is the difference between voluntary and involuntary churn?
Voluntary churn happens when a subscriber decides to cancel or turn off renewal. Involuntary churn happens when a renewal payment fails and is not recovered. They need different fixes: product and value for the first, billing recovery for the second.
How do you calculate a cohort retention curve?
Group subscribers by the month they started, then for each later month divide the number still subscribed or active by the cohort's starting size. Plot one line per cohort and look for whether the curve flattens.
What are the leading indicators of churn in a subscription app?
A drop in usage frequency against the member's own baseline, unfinished onboarding, low adoption of the core feature and a weak or irregular usage rhythm. Crashes, disabled notifications and expiring payment methods add to the risk.
Can Firebase or GA4 predict churn?
GA4 offers a churn probability metric and predictive audiences such as 'Likely 7-day churning users', for properties that meet the eligibility thresholds. They predict seven days of inactivity, not subscription cancellation, so most subscription businesses also build their own risk flag in BigQuery.
What is a good retention rate for a subscription app?
It depends on the plan and the product. RevenueCat's 2026 data shows first-year retention of 28% for annual plans and 8% for monthly plans across app-store subscriptions. Your own cohorts from the previous year are the most useful comparison.
Do push notifications reduce churn?
They can raise short-term activity, but too many generic notifications increase uninstalls. Test frequency and content against a holdout, use retention as the primary metric and uninstalls and opt-outs as guardrails.
How long should a retention experiment run?
Long enough to reach the planned sample size and to observe the renewal or retention window, which often means two to three months. Read the result again 30 to 60 days after the intervention ends, because many effects fade.
Key terms
- Subscription churn
- The share of paying subscribers whose subscription ends during a period. It matters because it is the number finance reports and the one that drives revenue.
- Voluntary churn
- Churn caused by a subscriber's decision to cancel or turn off renewal. It matters because it reflects the value members get from the product.
- Involuntary churn
- Churn caused by a failed renewal payment that is not recovered. It matters because it is fixed with billing settings and reminders, not product changes.
- Usage retention
- The share of a cohort still active in the app after a given time. It matters because it usually predicts subscription churn.
- Cohort
- A group of users who started in the same period. It matters because comparing cohorts separates product changes from changes in the customer mix.
- Retention curve
- The share of a cohort still subscribed or active, plotted over time. It matters because a curve that flattens shows that a core group has found a habit.
- Stickiness (DAU/MAU)
- Daily active users divided by monthly active users, or similar ratios. It matters as a measure of habit strength, read against the product's natural rhythm.
- Value event
- The tracked event that shows a member actually used the service, such as a workout logged. It matters because 'active' should mean value, not app opens.
- Aha moment
- The first time a new user experiences the core value of the product. It matters as a hypothesis for onboarding, to be tested rather than assumed.
- Leading indicator
- A behaviour that changes before the outcome you care about, such as a drop in usage before a cancellation. It matters because it leaves time to act.
- Churn probability (GA4)
- GA4's predicted probability that a user active in the last 7 days will not be active in the next 7. It matters as an engagement signal, not a cancellation forecast.
- Predictive audience
- A GA4 audience built on predictive metrics, such as likely 7-day churning users. It matters because it can be used for targeting in Firebase and Google Ads, if the property is eligible.
- Grace period
- A period after a failed renewal during which the subscriber keeps access while payment is retried. It matters because it recovers involuntary churn.
- Win-back offer
- A free or discounted period offered to subscribers whose subscription has ended. It matters because few churned annual subscribers return without one.
- Holdout group
- A randomly chosen group that receives none of the tested messages or programmes. It matters because it shows what the programme adds over doing nothing.
Sources
All sources were checked in October 2026. RevenueCat, Adjust and Amplitude figures come from their own customer data and are vendor data; their definitions differ. Google, Firebase, Android and Apple features come from their own documentation. Exhibits 1 (levers), 5 and 7 and Tables 1, 5 and 6 are Henkan & Partners frameworks; Exhibits 3 and 6 and Tables 2 and 4 are illustrative calculations; the sample size in Section 5 uses the standard two-proportion formula.
- RevenueCat (2026). State of Subscription Apps 2026 and SOSA 2026 insights, part 2 (vendor data).
- RevenueCat (2025). State of Subscription Apps 2025 (vendor data).
- Tideman, D. (2025). Churn in subscription apps: top 5 cancelation reasons (and what to do about them). RevenueCat blog (vendor content).
- Shrestha, P. (2024). What makes a good app retention rate? Adjust (vendor data).
- Amplitude (2025). The 7% retention rule and Time to value drives user retention, based on the 2025 Product Benchmark Report (vendor data).
- Lally, P., van Jaarsveld, C. H. M., Potts, H. W. W. & Wardle, J. (2010). How are habits formed: Modelling habit formation in the real world. European Journal of Social Psychology, 40(6), 998–1009.
- Buyalskaya, A., Ho, H., Milkman, K. L., Li, X., Duckworth, A. L. & Camerer, C. F. (2023). What can machine learning teach us about habit formation? Evidence from exercise and hygiene. PNAS, 120(17), e2216115120.
- Milkman, K. L., Gromet, D., Ho, H. et al. (2021). Megastudies improve the impact of applied behavioural science. Nature, 600, 478–483.
- Wohllebe, A., Hübner, D.-S., Radtke, U. & Podruzsik, S. (2021). Mobile apps in retail: Effect of push notification frequency on app user behavior. Innovative Marketing, 17(2), 102–111.
- Rosala, M. & Pernice, K. (2023). User Interviews 101. Nielsen Norman Group.
- Google Analytics Help. Predictive metrics, Predictive audiences, Cohort exploration, Automatically collected events, User stickiness, BigQuery Export and Audiences.
- Firebase documentation. Firebase A/B Testing, Create Remote Config experiments and Remote Config parameters and conditions; Firebase blog, Targeting audiences with Cloud Messaging (2022).
- Android Developers. Notification runtime permission and Grace period, account hold, pause, and resubscribe.
- Apple Developer. Supporting win-back offers in your app.
- Henkan & Partners. Illustrative usage-decline flag, onboarding cohort economics and sample-size calculation (formulas as stated in the article).