Focus
GA4 for Product Managers: The Questions It Answers, the Ones It Can't, and How Not to Be Fooled by the Numbers
Alexandre Suon · 2026-10-02
GA4 for product managers is mostly about knowing which questions to ask it. Google Analytics 4 can tell you how many people use a feature, where they drop out of a flow and whether they come back. It cannot tell you why, or prove that your release caused the change. This focus maps a product manager's ten standard questions to the right GA4 reports and explorations, shows where GA4 stops and other tools take over, and lists the reading traps that make confident people wrong.
Executive summary
- GA4 is the analytics data most product teams already have, so learn to question it before replacing it. W3Techs finds Google Analytics on 47.2% of all websites and 82.7% of sites that use a tracked analytics tool (1 October 2026). For many product managers it is the only behavioural data available on day one.
- GA4 answers 'how many', 'where' and 'in what order' well, and 'why' or 'what caused it' badly. Adoption counts, funnels, paths, short-term retention and the channels behind good users are within reach. Motives need research, and causal claims need an A/B test or a holdout.
- Ten standard product questions map to nine places in GA4. The Engagement overview, Events, Landing page, User acquisition and Retention reports cover the basics; the Funnel, Path, Free-form and Cohort explorations cover the rest. Our table in Section 3 gives the click-path and the trap for each.
- GA4 stops where you need accounts, long histories, raw events or causal proof. Explorations only see 2 or 14 months of event data on standard properties, the BigQuery daily export is capped at 1 million events a day, and dedicated product analytics tools now start free (Amplitude 2 million events a month, Mixpanel and PostHog 1 million; vendor data).
- Most 'wrong' GA4 numbers are definitions, not bugs. 'Users' in reports means active users; an engaged session lasts more than 10 seconds by default; thresholds, sampling above 10 million events, the (other) row, (not set), consent gaps, the property time zone and 24 to 48 hours of processing all reshape what you see.
- A ten-point check before sharing a number prevents most bad decisions. Name the count, check the key event and engagement definitions, look at the data-quality icon, confirm the period is at least three days old, and treat AI assistants that query GA4 as fast juniors whose settings you check.
Section 1 · The starting point
GA4 for product managers starts with the data you already have, read with care
GA4 for product managers means using Google Analytics 4, Google's free event-based analytics tool, to answer product questions: how many people use a feature, where they drop out of a flow, whether they come back and which channels bring the users who stay. It is the 'Ask' step of our ABC: know what GA4 can answer, what it cannot, and how to read its numbers without being fooled.
Product managers rarely choose their analytics tool. They inherit it, usually from marketing, and in most companies it is GA4. That is not a bad starting point: GA4 records events, not just page views, and its explorations build funnels, paths and cohorts without a line of SQL.
The problem is that GA4 was not designed around product questions, and its numbers carry definitions that are easy to miss. 'Users' does not mean everyone who visited. An 'engaged session' is a setting someone may have changed. A funnel can quietly sample. The answer to 'did the release work?' can shift for days after you look. This article, the first in our learning path The ABC of GA4 for Product Managers, is about asking the right questions and reading the answers correctly. The next steps cover how to ask for tracking, how to measure feature adoption and how to measure a launch.
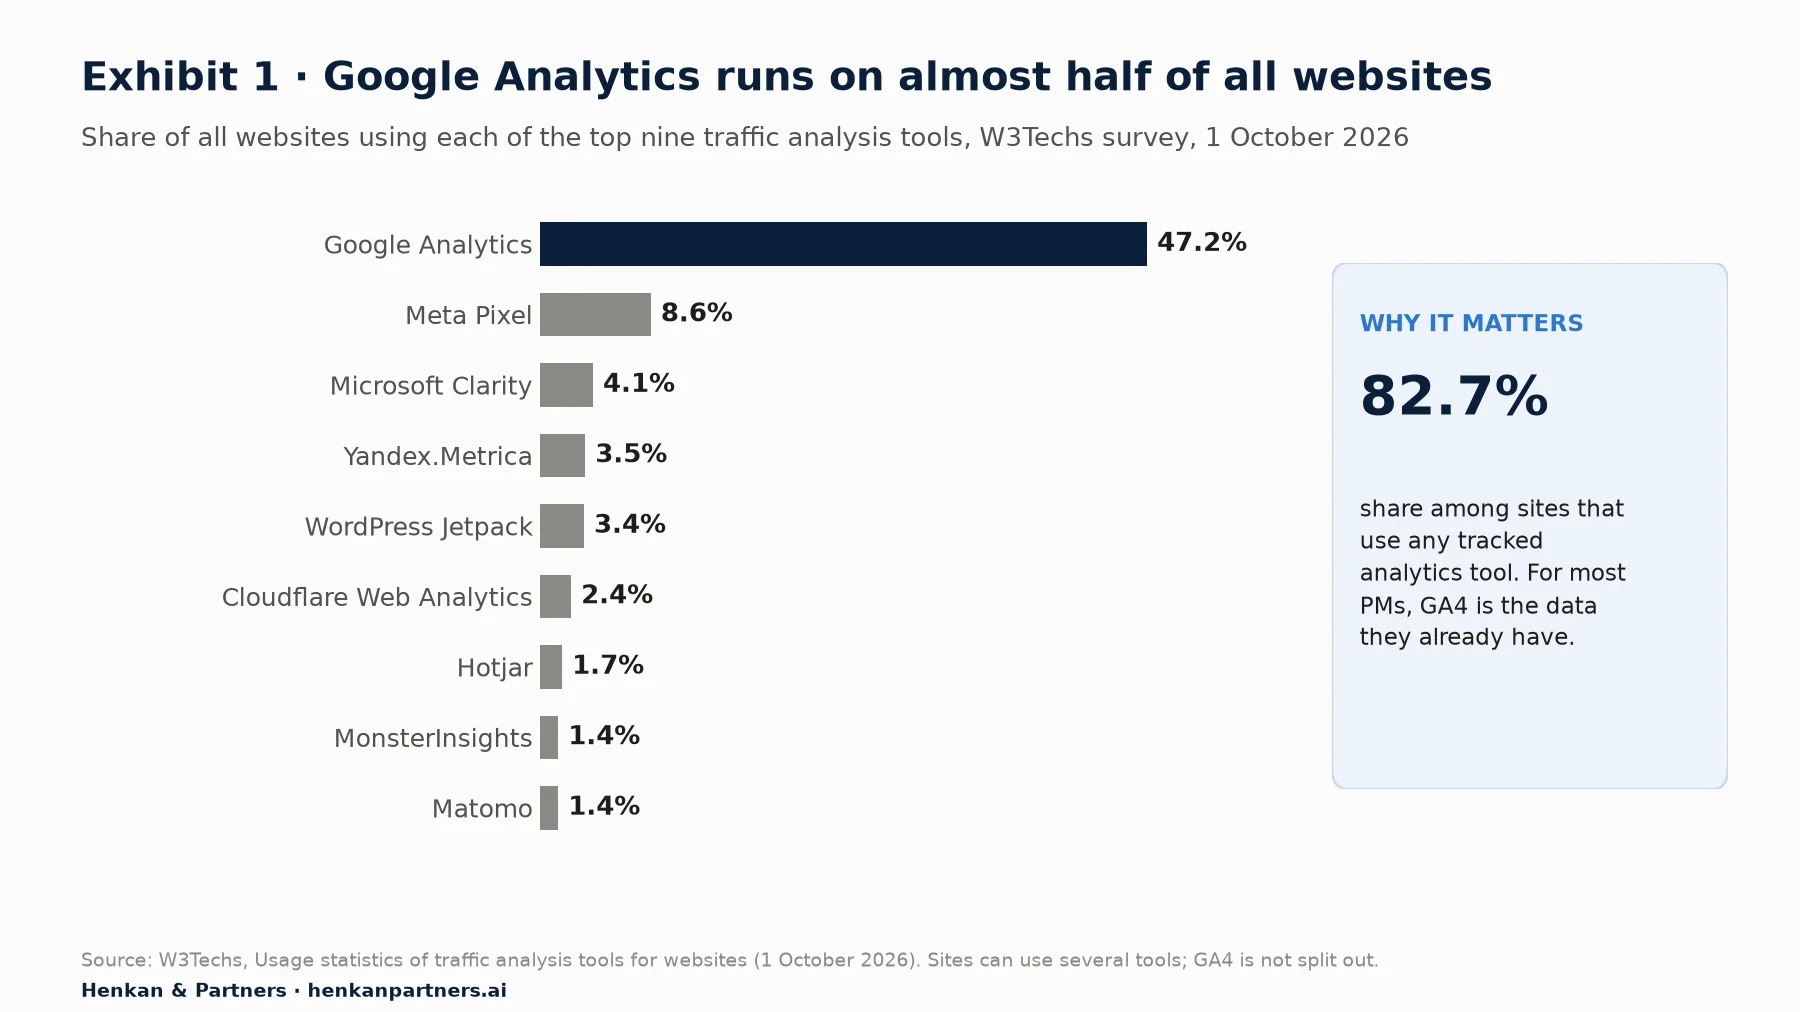
What this shows. Google Analytics is close to a default: almost half of all websites run it, and among sites with any tracked analytics tool its share is 82.7%. W3Techs does not split GA4 from older Google Analytics tags, so treat the figure as an order of magnitude. For a product manager, the practical conclusion is simple: learn to use the data you already have before buying more.
For the mechanics behind the numbers, read How GA4 Actually Works; for the wider practice, our Guide to Web Analytics for Product Owners. Here we stay practical and GA4-specific.
Section 2 · The questions
GA4 answers five families of product questions, each up to a clear limit
Most product questions fall into five families. GA4 handles the first part of each well, the second only with extra set-up, and the third not at all.
1. Adoption: how many people use what we built?
If the feature fires its own event (for example `save_for_later`), GA4 counts how many users triggered it and how often, by device, country, platform or channel. Reports > Engagement > Events gives the event count and total users per event. Adoption by customer plan, account type or experiment variant needs that context sent as a parameter or user property and registered as a custom dimension (see which custom dimensions to collect). Adoption by company account, the core B2B question, is outside what GA4 is built for.
2. Funnels: where do people drop out?
Explore > Funnel exploration shows completion and abandonment between steps you define, as an open funnel (users can enter at any step) or a closed one (they must start at step one), with breakdowns by device or channel. GA4 tells you where people leave. It does not tell you why: that needs session replay, surveys or usability tests. Our funnel and cohort analysis guide covers the five settings that decide what a funnel says.
3. Retention: do people come back?
Reports > Life cycle > Retention shows new and returning users, retention by cohort at day 1, 7 and 30, and the share of users who return each day in their first 42 days, according to Google. Explore > Cohort exploration lets you choose the return criterion (any event, or your feature event). Longer views run into the data retention setting: explorations can only reach back 2 or 14 months on a standard property.
4. Good users: which sources bring people who stay or buy?
Reports > Acquisition > User acquisition groups users by the channel that first brought them ('first user' dimensions). Traffic acquisition groups sessions by their own source, whether the user is new or returning. Product managers usually want the first: which channels bring users who later adopt, return or convert. Value by channel needs purchase or lead values sent with key events; true customer lifetime margin lives in finance and CRM data, not GA4.
5. Release impact: did our change move anything?
GA4 shows trends before and after a release and lets you compare segments, such as users who saw the change against those who did not. It cannot separate your release from seasonality, a campaign launched the same week or a change in traffic mix. For a causal answer you need an A/B test or a holdout group; our A/B testing guide and the path's launch measurement article explain how.
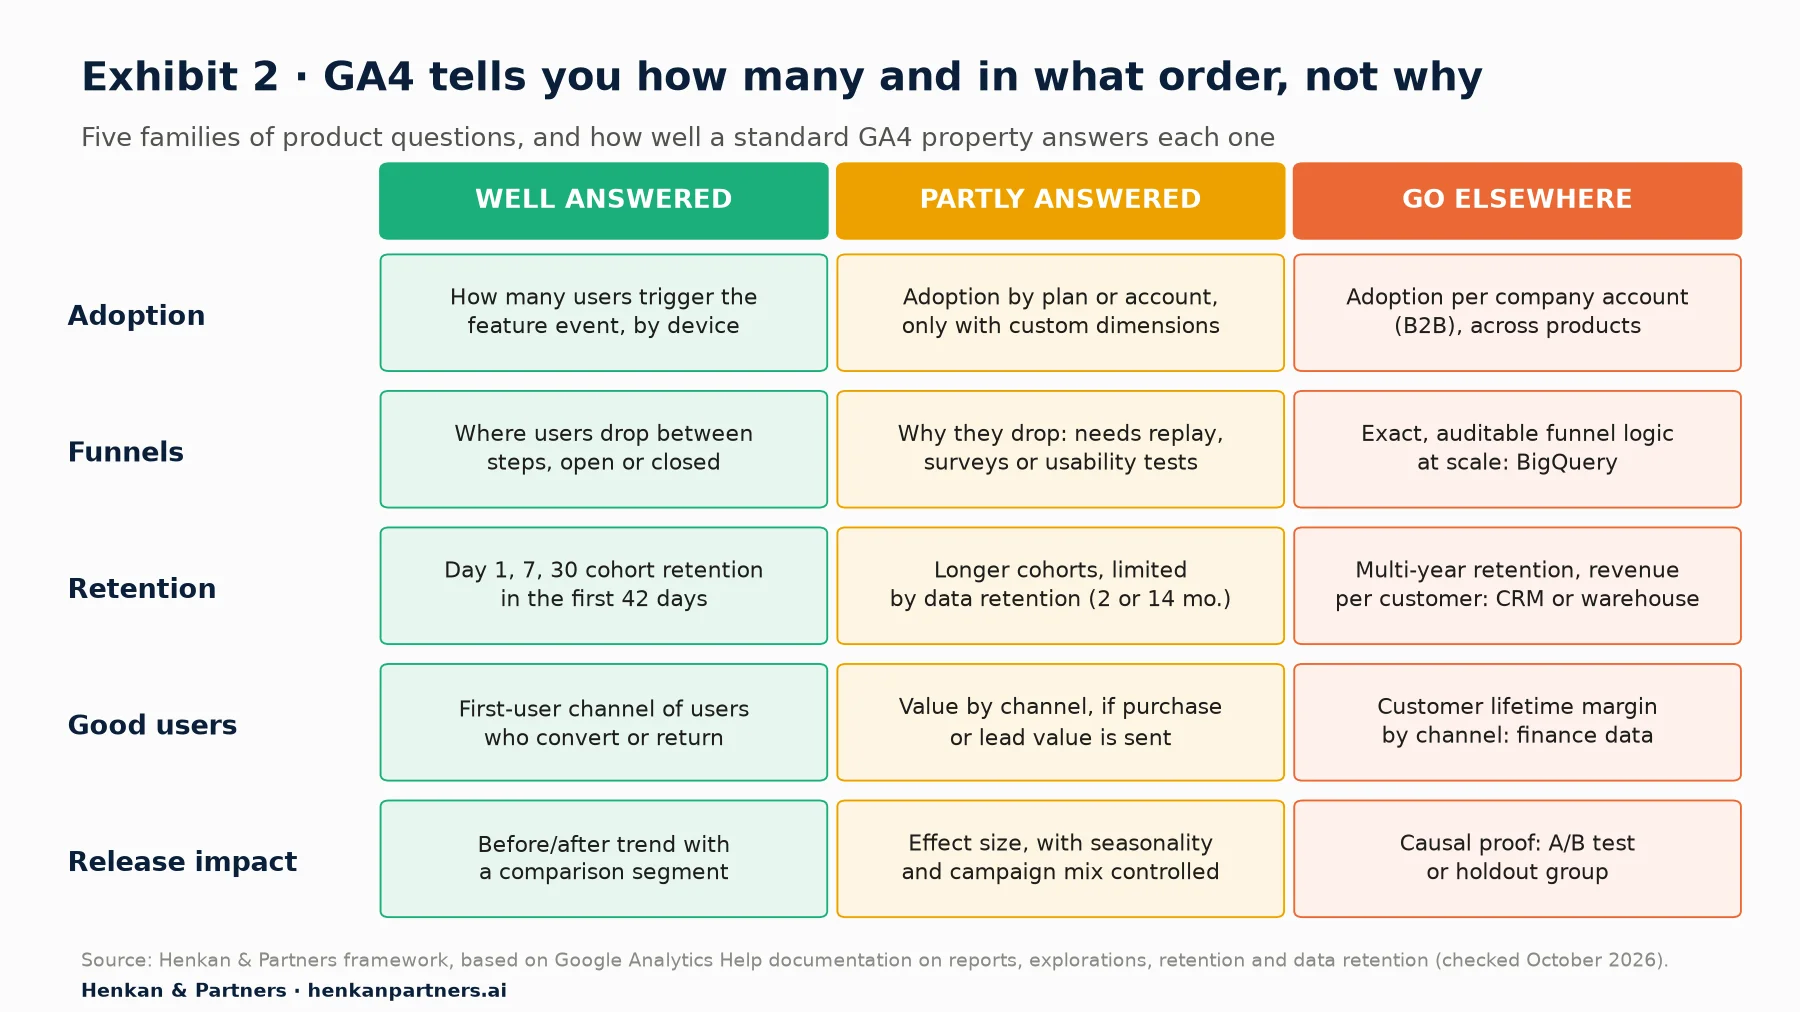
What this shows. The left column is where GA4 is genuinely strong and where you should start. The middle column is reachable, but only if someone planned the tracking: custom dimensions, values on key events, a comparison segment. The right column is where teams waste the most time, trying to force GA4 to explain motives or prove causality. Plan those answers with other tools from the start.
Our view. Write the question before you open GA4. 'How many weekly active users saved an item for later in September, by device?' takes five minutes. 'Is save for later working?' cannot be answered until someone defines 'working'.
Section 3 · Ten questions
A product manager's ten standard questions map to nine places in GA4
The table below is the core of this article. It lists the ten questions we hear most often from product managers, where to answer each one in the GA4 interface, the metric to use and the trap to avoid. Report names and paths are those of the default Life cycle collection, checked against Google's documentation in October 2026; if your administrator customised the navigation, some reports may sit elsewhere or be hidden.
| Question | Where in GA4 | Metric to use | Watch out for |
|---|---|---|---|
| 1. How many people use the product, and is it growing? | Reports > Engagement > Engagement overview (User activity over time card) | Active users over 1, 7 and 30 days | 'Users' in reports means active users, not everyone who visited |
| 2. How sticky is it? | Reports > Engagement > Engagement overview (User stickiness card) | DAU/MAU, DAU/WAU, WAU/MAU | GA4 counts browsers and devices unless you send a user ID |
| 3. How many users adopted feature X? | Reports > Engagement > Events, then the feature's event | Total users and event count for the event | The feature needs its own event; custom parameters need registering |
| 4. Who adopts it? | Same report with a comparison (device, country, new vs returning), or Explore > Free form | Users who triggered the event, broken down | Demographic breakdowns can trigger thresholding |
| 5. Where do users drop in the key flow? | Explore > Funnel exploration | Completion and abandonment rate per step | Open vs closed funnel; sampling above 10 million events |
| 6. What do users do before and after X? | Explore > Path exploration | Next and previous events or pages | Paths show sequences, not intent; noisy events crowd the view |
| 7. Do users come back? | Reports > Life cycle > Retention, or Explore > Cohort exploration | Day 1, 7, 30 retention by cohort | Retention report covers the first 42 days; modelled data excluded |
| 8. Which channels bring users who stay or convert? | Reports > Acquisition > User acquisition | First user primary channel group vs key events or retention | User acquisition (first touch) differs from Traffic acquisition (session) |
| 9. Which entry pages lead to engaged sessions? | Reports > Engagement > Landing page | Sessions, average engagement time per session, key events | (not set) appears when a session has no page_view |
| 10. Did the release change behaviour? | Any report with a date comparison, then Explore > Free form by day | The metric your release targets, plus guardrails | Seasonality, campaigns, data delays; causal proof needs a test |
Two habits make this table work. First, use comparisons in standard reports before building an exploration: the comparison icon at the top of a report places Android against iOS, or new against returning users, side by side. Second, write the settings you used (date range, segment, funnel type) next to every number you share; our funnel and cohort guide calls this the settings line.
For product managers. If question 3 cannot be answered because the feature has no event, the problem is not GA4 but the brief. The next article in this path, how to ask for GA4 tracking, shows how to turn a user story into an event spec developers can build.
For product leaders. Ask each team to answer questions 1, 3, 5 and 7 for its main feature monthly, with the settings line attached. It quickly shows whether tracking is good enough to steer the roadmap.
Section 4 · Where GA4 stops
GA4 stops where you need accounts, long histories, raw events or causal proof
Product questions push GA4 in four directions where it runs out of road. Knowing them tells you when to add a product analytics tool, use the BigQuery export or run an experiment.
| When you need… | Why GA4 struggles | What takes over |
|---|---|---|
| Analysis by account, workspace or team (B2B) | Reports are built around users and events; an account ID can be sent as a parameter or user property, but high-cardinality values crowd reports into an (other) row | A product analytics tool with account-level analysis, or BigQuery |
| Long histories in explorations | Event-level data for explorations and funnel reports is kept 2 or 14 months on standard properties (26 to 50 months only on GA4 360) | BigQuery export, started early, or a product analytics tool |
| Exact, auditable logic on raw events | Explorations sample above 10 million events per query; definitions such as sessions and attribution are fixed by GA4 | BigQuery export (1 million events a day on the standard daily export) |
| Proof that your change caused the result | Before/after comparisons mix your release with seasonality, campaigns and traffic mix | A/B tests, feature-flag holdouts |
| Motives and usability problems | GA4 records what happened, not why | Session replay, surveys, usability tests, customer interviews |
The BigQuery export deserves a word. In our experience it only holds data from the day you link it, with no history before that, and Google states that data cannot be re-exported once exported: link it now, even if nobody queries it for months. Standard properties have a daily export limit of 1 million events. Our GA4 audit checklist includes the export among its checks.
Dedicated product analytics tools are also easier to try than they used to be: Amplitude, Mixpanel and PostHog all publish free plans (vendor data). Our Essential Guide to Product Analytics compares them.
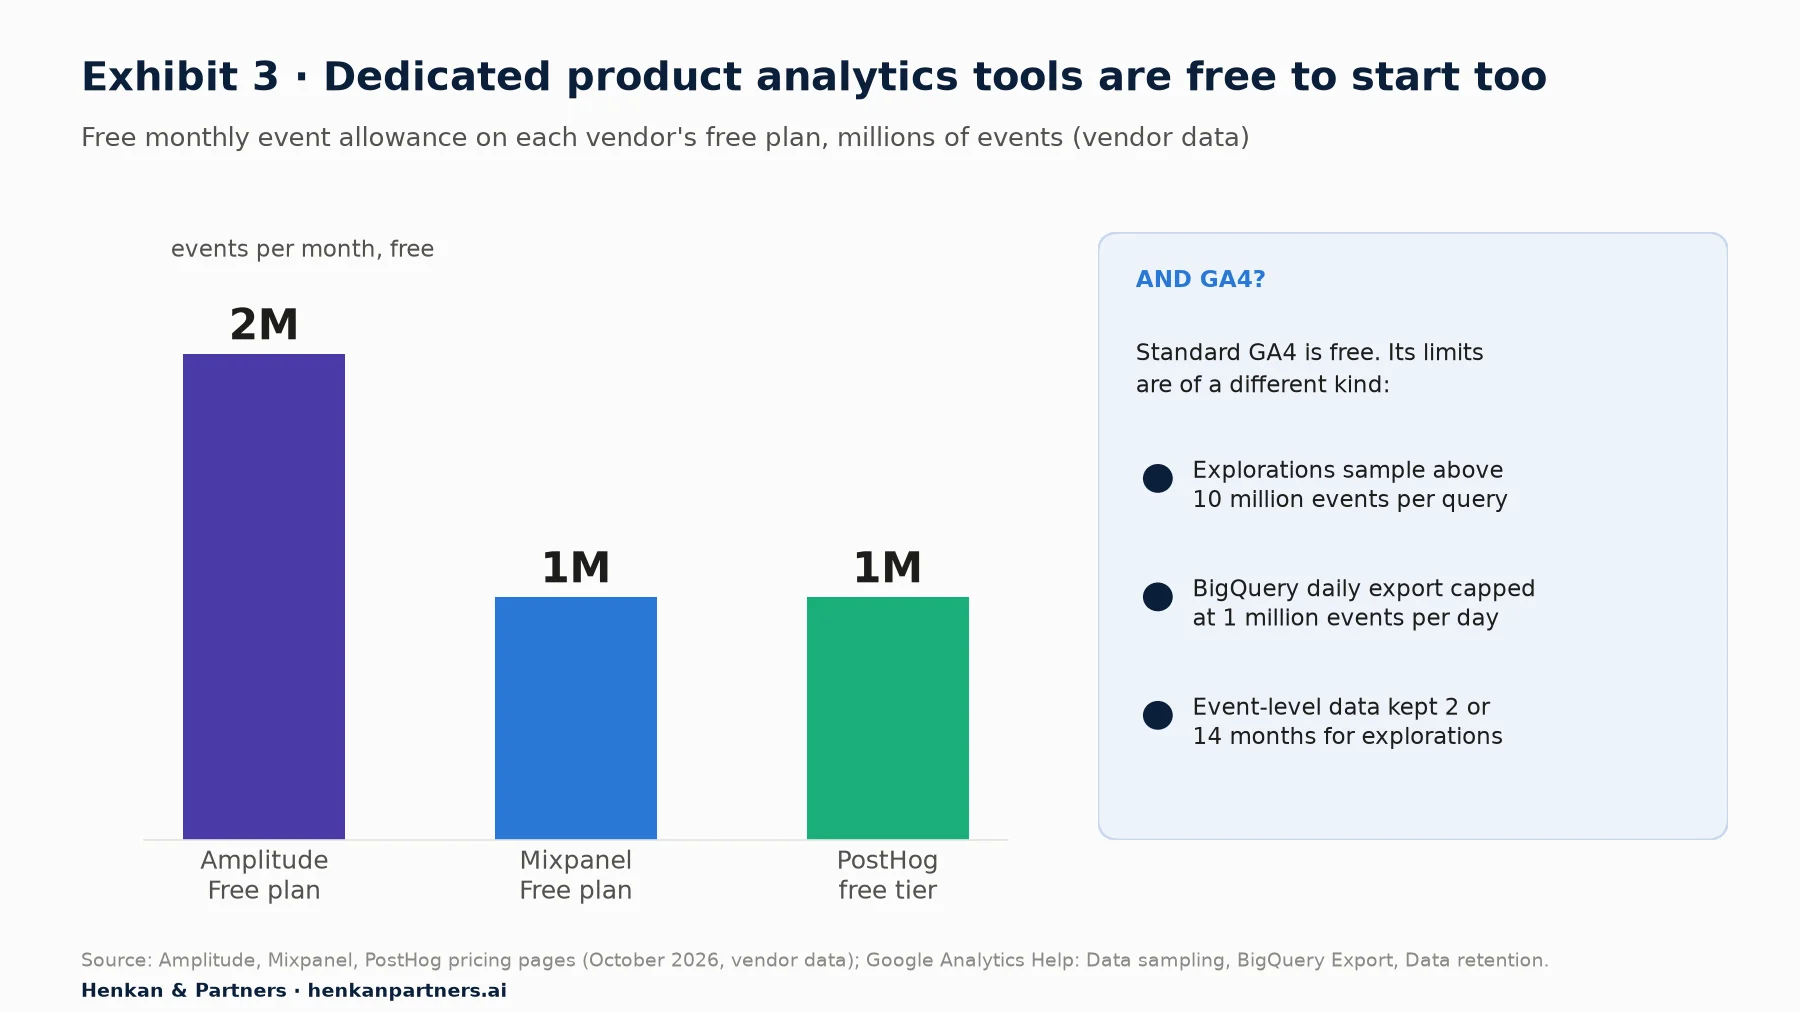
What this shows. Cost is no longer the main reason to stay on GA4 alone. A small product team can run a dedicated product analytics tool for free, alongside GA4, if its volume fits. The real costs are elsewhere: a second tracking implementation, a second set of definitions to keep aligned with GA4, and consent to manage for both. Start a second tool when a recurring question sits in the right-hand column of Exhibit 2, not because the first one is hard to read.
Disclosure: Henkan & Partners implements and audits GA4, BigQuery and product analytics tools for clients. Free-plan figures are taken from each vendor's pricing page and can change.
Section 5 · Counting people
Users, active users and sessions are different counts, so always name the one you mean
A common argument in product reviews: two people quote different 'user' numbers for the same week, both from GA4, and both are right. Google's definitions:
- Total users: the number of unique users who triggered any event in the date range.
- Active users: the number of unique users who engaged with your site or app, that is, had an engaged session or sent specific engagement events.
- New users: the number of unique users who logged a `first_visit` (web) or `first_open` (app) event in the period.
- Returning users: users who started at least one previous session, whether or not it was engaged.
The key detail, in Google's own documentation: in GA4 reporting, you only see active users. When a standard report says 'Users', it means active users. An exploration or a Looker Studio chart that uses Total users will show a higher number for the same period, and neither is a bug.
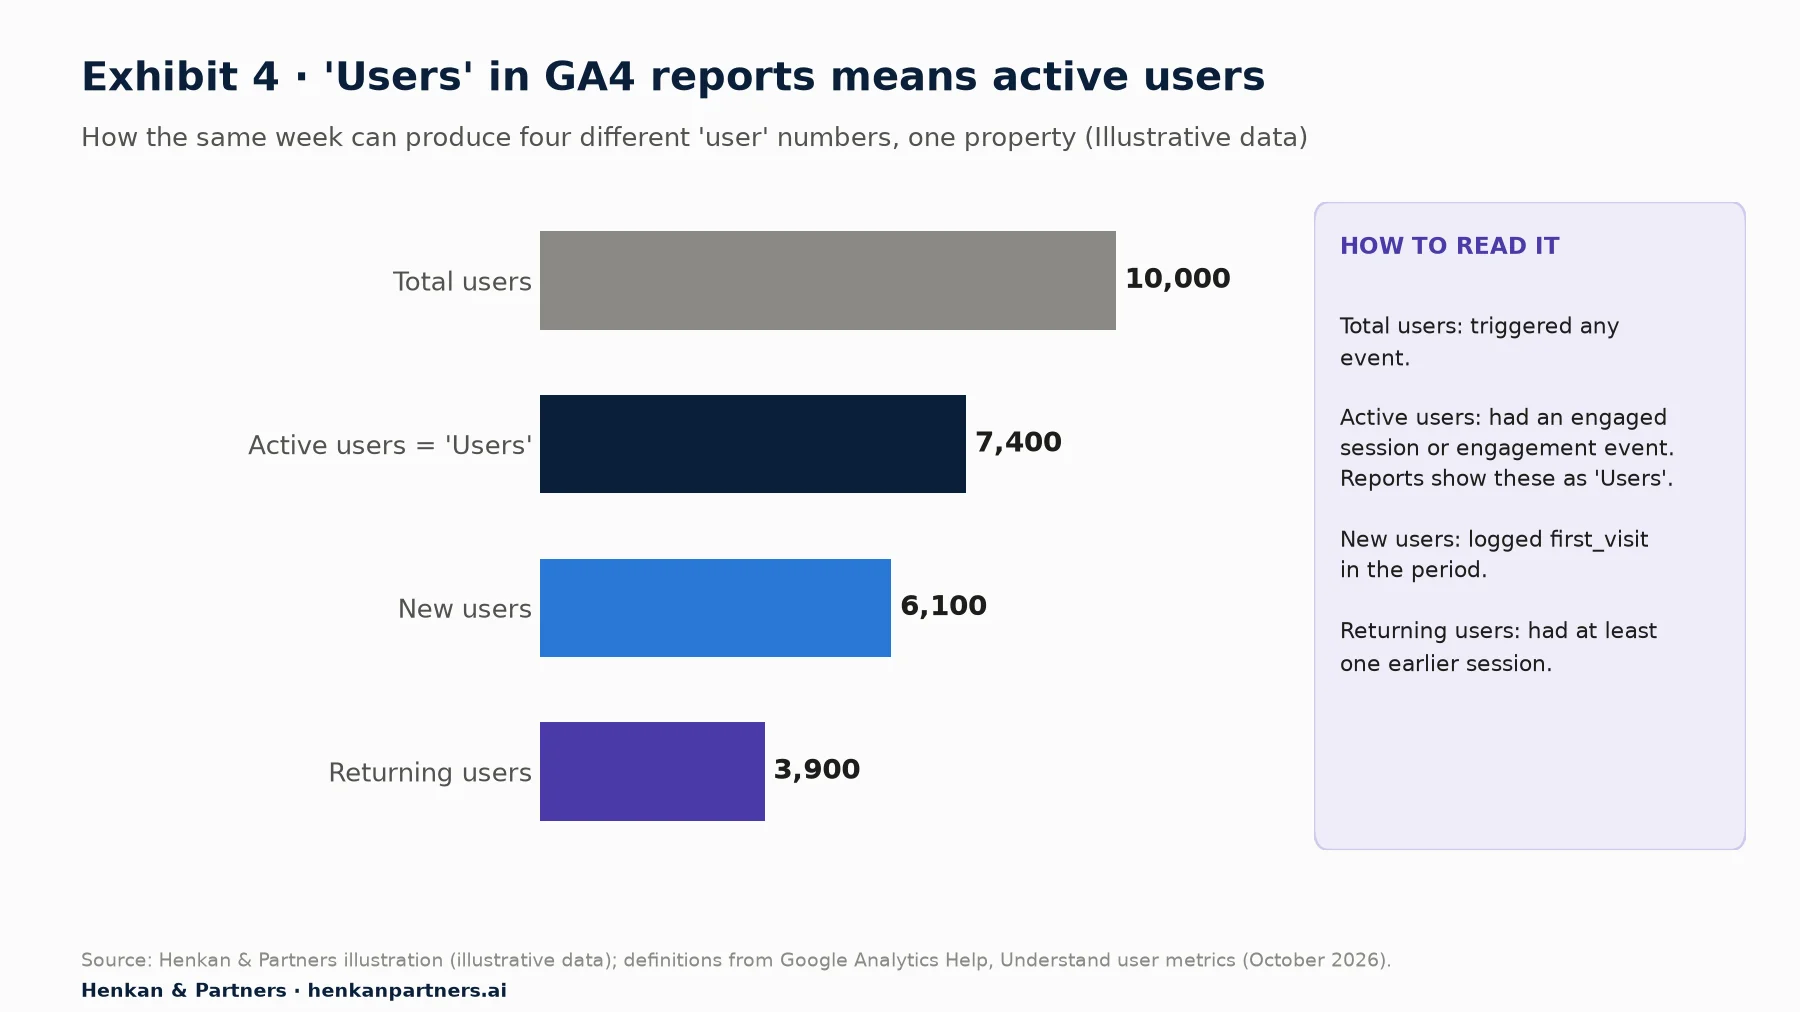
What this shows. The numbers are invented, but the pattern is typical: total users above active users, and new and returning users as another cut of the same population. When someone quotes 'users', ask which one. For adoption rates, pick one denominator (we suggest active users) and keep it.
Users are browsers and devices unless you tell GA4 otherwise
A 'user' in GA4 is an identifier, not a person. Without a user ID, the same person on a laptop and a phone counts twice, and clearing cookies creates a new 'user'. GA4's reporting identity setting (Admin > Data display > Reporting identity) decides which identifiers reports use: Blended uses the user ID, then the device ID, then modelling; Observed uses the user ID, then the device ID; Device-based uses the device ID only. Google states that switching between them does not affect data collection and can be changed at any time. That makes it safe to check, and important to know, because the same report can show different user counts under each option.
Sessions are a third unit; one ends after 30 minutes of inactivity by default. Use users for adoption, sessions for flows, and never mix them in one ratio.
Section 6 · Definitions
Engagement rate and key events are settings someone chose, so check them before comparing
Engagement rate depends on a timer you can change
Google defines an engaged session as one that lasts longer than 10 seconds, has a key event, or has two or more page or screen views. Engagement rate is the share of sessions that are engaged, and bounce rate is its inverse: the share of sessions that were not engaged. Unlike in the old Universal Analytics, a single-page visit where someone reads for a minute is not a bounce.
The 10 seconds is a default, not a law. An administrator can change the engaged-session timer under Admin > Data streams > (your web stream) > Configure tag settings > Settings > Show all > Adjust session timeout, the same screen as the session timeout. If someone raised it last quarter, engagement rate will drop with no change in behaviour. Before comparing engagement across periods, or with another property, check the setting.
Key events are what GA4 used to call conversions
In March 2024 Google announced that GA4 'conversions' would become key events, keeping the word 'conversion' for the actions used to measure and optimise Google Ads campaigns. Key events are the events you mark as important to your business, such as `sign_up`, `purchase` or your feature's core action. Google allows up to 30 key events on a standard property and 50 on GA4 360, and marks some events (for example `purchase`) as key events by default. Two consequences:
- Key events change other metrics. A session with a key event counts as engaged, and key event rates appear across reports. Marking a new event as a key event can lift engagement rate without any change in behaviour.
- Ask what is marked, and since when. Before you use key events or key event rate in a review, check the key events list in Admin and agree with the team which ones represent product success. A noisy event marked as key (for example a page scroll) makes every rate meaningless.
For product managers. Keep a one-line definition for every metric you put in a roadmap review: 'Adoption = active users who triggered `save_for_later` ÷ active users who viewed a product page, weekly, engaged-session timer 10 s'. It sounds pedantic, but it ends most arguments.
Section 7 · Hidden data
Thresholds, sampling, (other) and (not set) hide or reshape rows, so look for the warning signs
Thresholding withholds rows to protect privacy
GA4 applies data thresholds to prevent anyone from inferring the identity of individual users. According to Google, they can apply to demographic data in reports, explorations and API calls, to search query data and to narrow date ranges with low user counts. Thresholds are system defined and you cannot adjust them. When they apply, the data quality indicator at the top of the report says that thresholding has been applied. What you can do: widen the date range, remove demographic dimensions, or use the BigQuery export (which does not include Google signals data).
Sampling estimates explorations above a quota
Google applies sampling when the events needed for a report, exploration or request exceed the property's quota; in our experience it is explorations that hit it. The quota is 10 million events on a standard property, up to 1 billion on GA4 360. The data quality icon then shows the percentage of data used. A funnel built on 8% of events can mislead on small segments. Shorten the date range or simplify the exploration until the icon shows full data, or move the analysis to BigQuery.
The (other) row groups values when a table has too many rows
When a report has more rows than its limit, GA4 shows the most common values and groups the rest under (other). Google lists the causes: high-cardinality custom dimensions, secondary dimensions, filters and comparisons all increase the number of rows. It recommends standard reports (which use aggregate tables) over explorations for high-cardinality questions, and advises against using custom dimensions for user identifiers. If your feature analysis is grouped by something with thousands of values, such as product ID or search term, expect (other).
(not set) means GA4 received no value for that dimension
Google describes (not set) as a placeholder used when Analytics has not received any information for a dimension. The causes it lists are the ones we see most in product work: a landing page of (not set) when a session has no `page_view`; source and medium of (not set) when `session_start` is missing; custom parameters in their first 24 hours after registration, or not present on the event that started the session; and consent mode implemented incorrectly. A large (not set) share is a tracking question for your developers, not something to filter out.
Section 8 · Consent and timing
Consent gaps, time zones and processing delays move numbers after the fact, so wait and reconcile
Consent decides who you see, and modelling fills only part of the gap
In Europe and many other markets, visitors who refuse analytics cookies are not measured the normal way. With consent mode, GA4 can model their behaviour from similar users who accepted, but only under conditions. Google's eligibility rules require at least 1,000 events a day with `analytics_storage` denied for at least 7 days, and at least 1,000 daily users with consent granted for at least 7 of the previous 28 days. Modelled data appears only under the Blended reporting identity.
Two details matter for product managers. First, many smaller products never reach those thresholds, so their GA4 numbers describe consenting users only. Second, Google lists where modelled data is not supported: audiences, user explorer, cohort and user lifetime explorations, retention reports, BigQuery exports and segments with sequences. Your active-user trend and your retention cohort can therefore describe slightly different populations. Our consent focus explains the wider rules.
The property time zone decides what 'a day' is
GA4 assigns events to dates in the property's reporting time zone. Google's example: a visit on Tuesday in the visitor's time zone, when it is still Monday in yours, is recorded as Monday. Changing the time zone only affects data going forward and can create a flat spot or a spike on the day of the change. In BigQuery, `event_date` uses the property's time zone while `event_timestamp` is in UTC microseconds. If your product database counts days in UTC and GA4 in Paris time, daily numbers will never match exactly. Agree one definition of 'a day' before comparing.
Data is not final for a few days
Google publishes typical processing times. For a standard property, realtime data arrives in a few minutes, intraday data in 2 to 6 hours and daily data in about 12 hours, and processing can take 24 to 48 hours, during which numbers may change. Attribution of key events can be adjusted for up to 12 days. That is why a 'day one' readout of a launch is a preview, not a result.
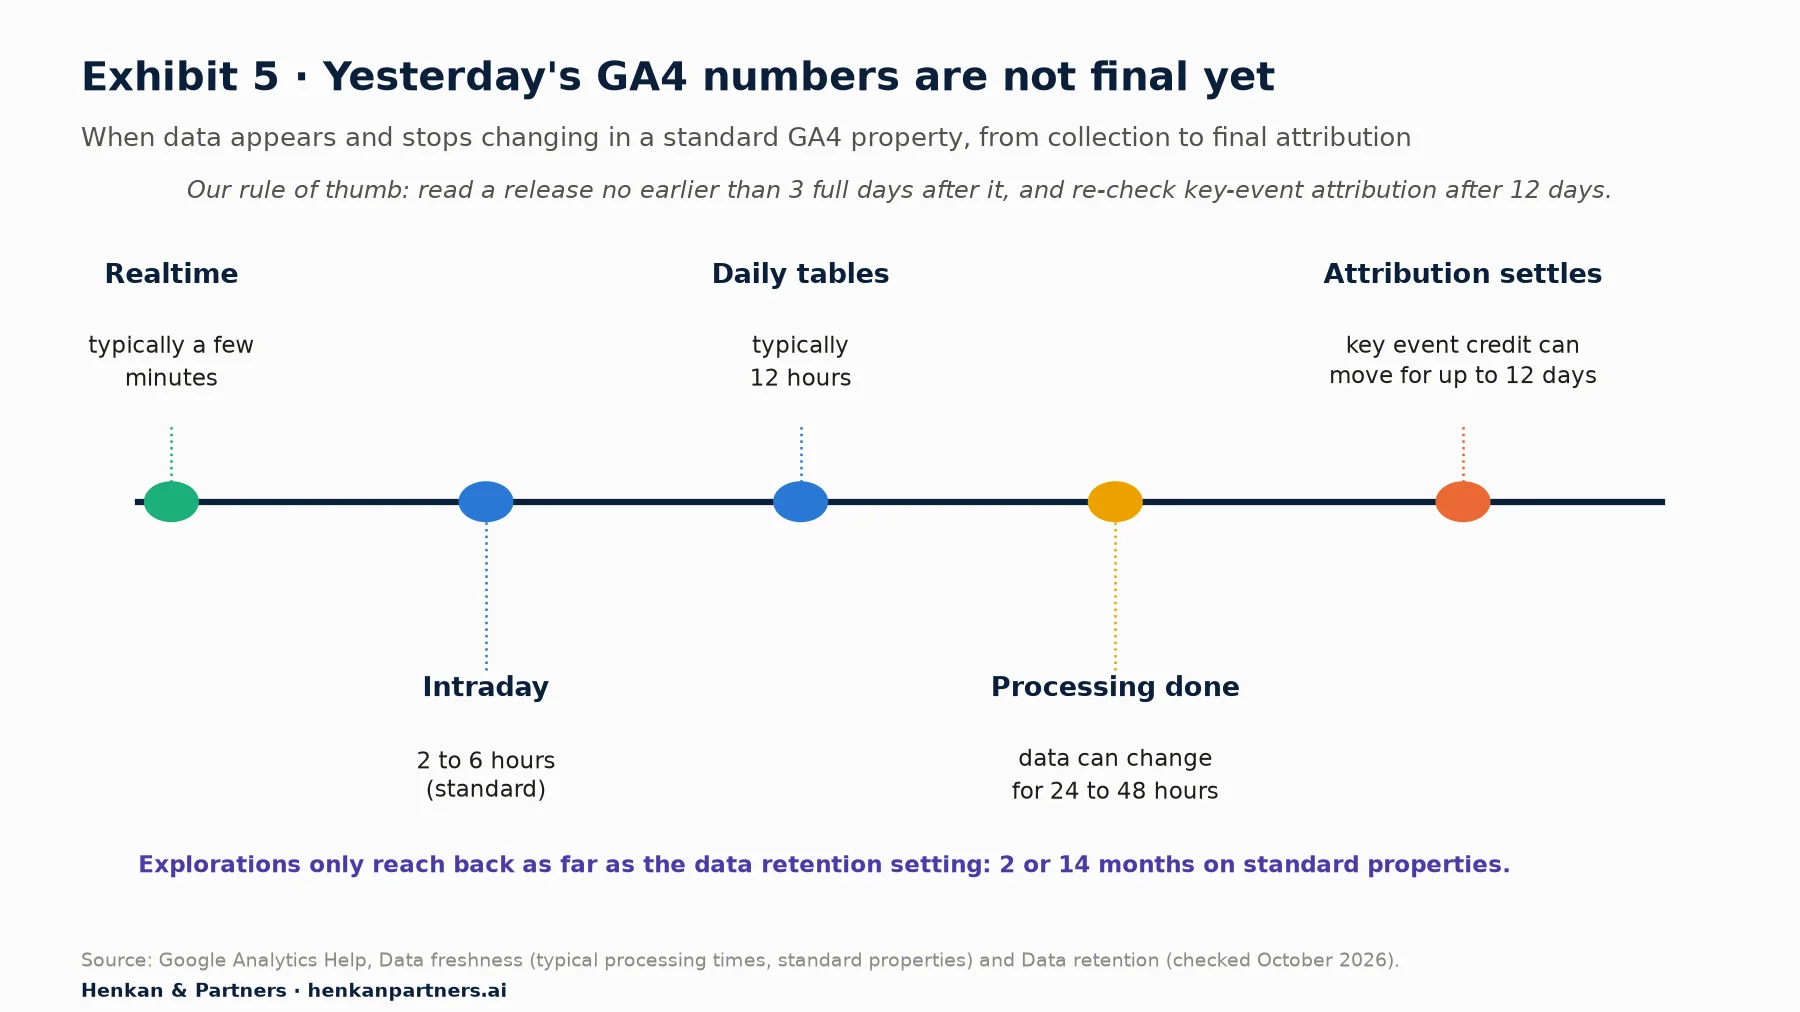
What this shows. A number pulled the morning after a release can still move. In our experience, three full days after the release is the earliest point to read a first result, and anything involving key event attribution by channel should be re-checked after twelve days. The bottom line of the exhibit is the other time limit: explorations cannot look further back than the retention setting, so check that yours is not set to 2 months.
In the current Admin screen the setting sits under Admin > Data collection and modification > Data retention; Google's help page still labels the path Data Settings > Data Retention. An Editor role is needed. The options on a standard property are 2 or 14 months. Google notes it affects explorations and funnel reports, not standard aggregated reports, and that a change is applied after 24 hours, during which it can be reverted.
Section 9 · Before you share
Ten checks before you share a GA4 number prevent most bad product decisions
Every trap in the previous four sections has a quick check. We use the list below with product teams as a pre-flight checklist: run through it before a number goes into a roadmap review, a board deck or a Slack thread that will be quoted for months.
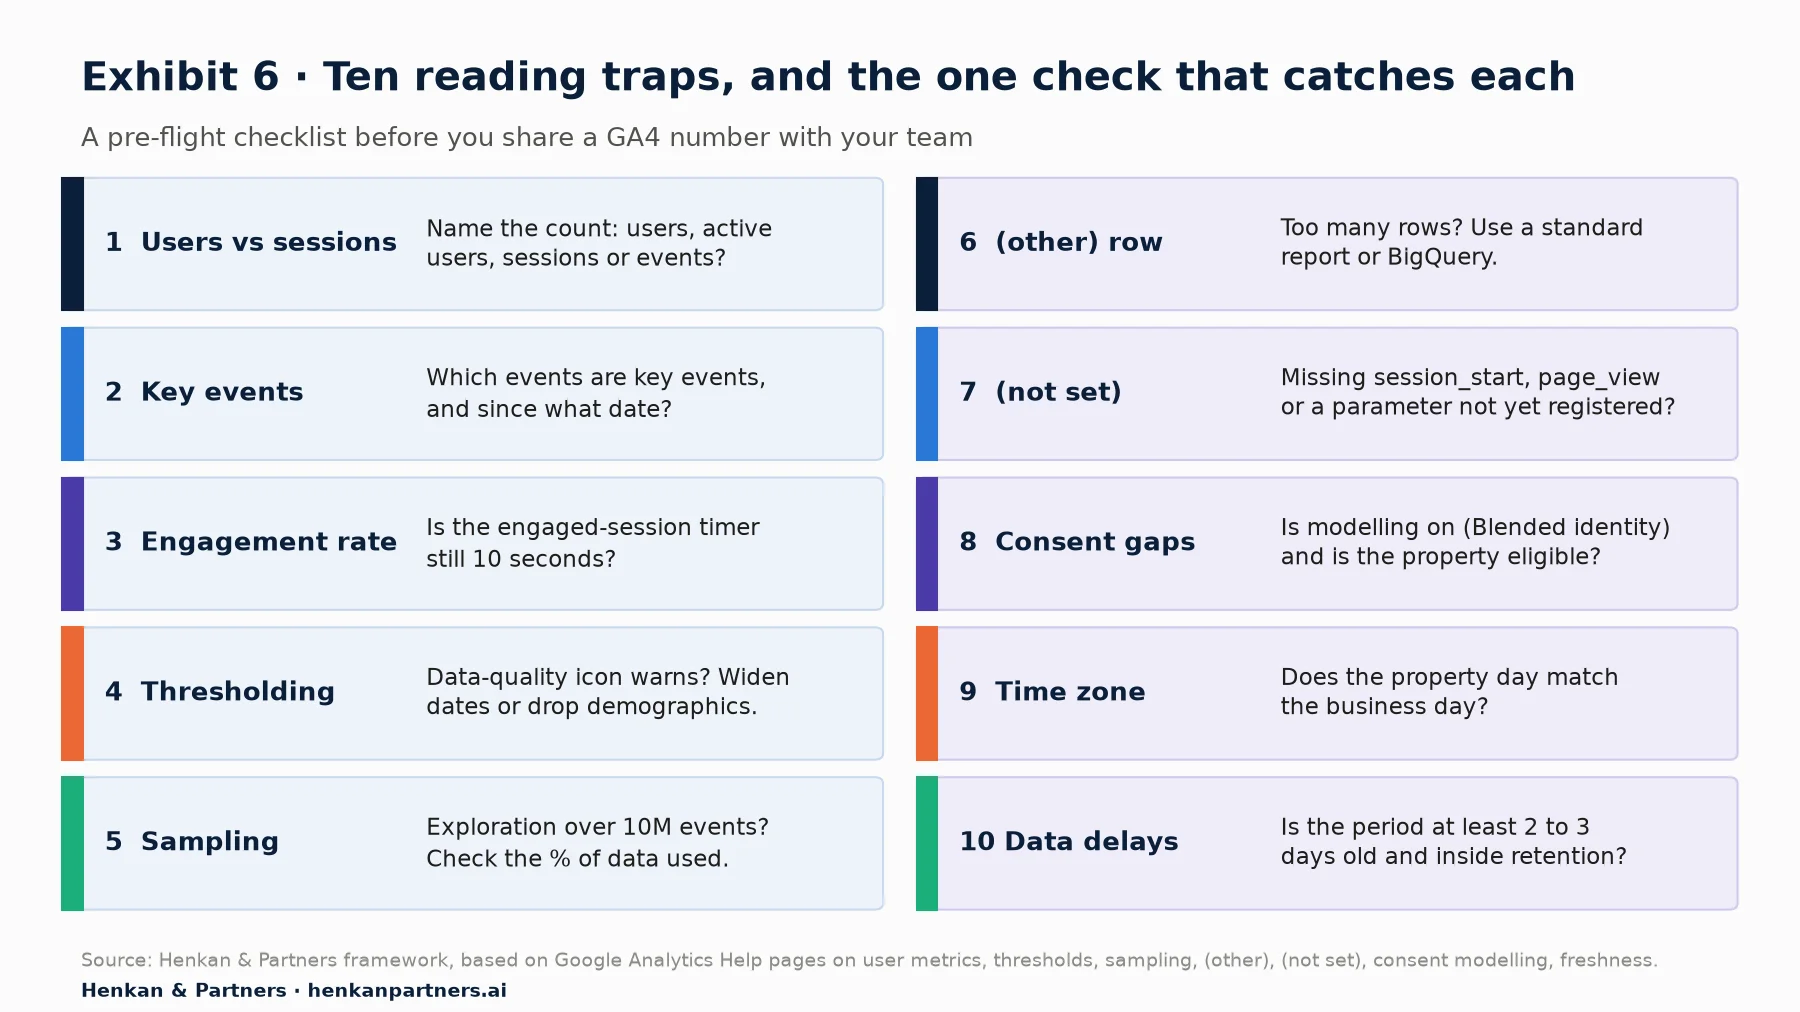
What this shows. Most checks take seconds: hover over the data-quality icon, glance at the date range, ask which 'users' the chart shows. In our experience they catch most misreadings in product reviews.
Worked example: a feature that 'lost half its users'
Illustrative example. On a Monday, a Free-form exploration shows weekly users of a 'compare products' feature falling from about 4,000 to about 2,000. The team wants to roll it back. The checklist changes the story:
- Count. The exploration uses Total users; last month's dashboard used Active users. Re-run with Active users.
- Delays. The last two days are not fully processed. Compare five complete days instead.
- Sampling. The data quality icon shows sampled data. A shorter date range restores full data.
- Consent. A new consent banner went live mid-week, so consenting traffic fell.
- Result. On matched definitions, feature users fell about 12%, in line with consented sessions, and the adoption rate is flat. No rollback.
Section 10 · AI assistants
AI assistants can query GA4 for you, but they inherit every trap in this article
Product managers increasingly ask an AI assistant for numbers rather than opening GA4. Google publishes an experimental Google Analytics MCP server, an open-source connector based on the Model Context Protocol, that lets an assistant call GA4's Admin and Data APIs with read-only access. Its tools include `run_report`, `run_funnel_report`, `run_realtime_report` and `get_custom_dimensions_and_metrics`. Analytics vendors and agencies, including us, build similar connectors.
Useful, but the assistant reads the same processed data, definitions and limits. The Data API returns flags that tell you when a response is affected: `subjectToThresholding`, `dataLossFromOtherRow` (rows rolled into (other)), `samplingMetadatas` and the property `timeZone`. Ask your assistant to report those flags with every answer, and to state which metric it used (`activeUsers` or `totalUsers`) and which date range. Standard properties also have API quotas, such as 200,000 core tokens per property per day, so an assistant looping over many queries can run out.
- Use AI for first drafts of questions, quick counts, writing the settings line and explaining a report you do not know.
- Check yourself the metric chosen, the date range and time zone, the flags for thresholding, sampling and (other), and whether the event names it used actually exist in your property.
- Never let it declare that a release 'worked' from a before/after trend. That is a causal claim, and GA4 data alone cannot support it.
Section 11 · What to do next
What to do next: five steps to make GA4 answer your product questions
1. Write your ten questions
Start from the table in Section 3 and adapt it to your product. For each question, write the metric, the denominator and the decision it supports. If a question has no decision attached, drop it.
2. Check five settings once
With your analytics owner, check the reporting time zone, data retention (14 months, not 2), the engaged-session timer, the list of key events and the reporting identity. Link BigQuery now if it is not linked; the export does not fill in the past. The GA4 audit checklist covers the rest.
3. Turn unanswerable questions into tracking requests
Every question GA4 cannot answer because an event or parameter is missing becomes a tracking request. The next article in this path, How Product Managers Should Ask for GA4 Tracking, shows how to write the event spec, and you can download the GA4 Tracking Request Kit for the question bank, event spec template and QA checklist.
4. Run the adoption and launch analyses
Follow the path: Measuring Feature Adoption in GA4 walks through funnel, path, segment overlap and cohort explorations click by click, and How to Measure a Product Launch in GA4 covers before/after traps and when you need an A/B test. Then funnel and cohort analysis goes deeper on method.
5. Agree a shared tracking plan, and get help where you need it
Product, design, engineering and marketing all depend on the same GA4 property. The capstone of every path, The GA4 Tracking Plan, shows how the four roles request, build and check tracking together. If you want a second pair of eyes on your property or your product metrics, Talk to us.
FAQ
Frequently asked questions about GA4 for product managers
Frequently asked questions
What is GA4 for product managers?
It means using Google Analytics 4, Google's free event-based analytics tool, to answer product questions such as feature adoption, funnel drop-off, retention and which channels bring users who stay. GA4 answers 'how many' and 'in what order' well; motives need research and causal claims need an A/B test.
Is GA4 good enough for product analytics?
For many teams it is enough to start: it records events, and its Funnel, Path and Cohort explorations cover the core analyses. It struggles with account-level (B2B) analysis, long histories in explorations (2 or 14 months on standard properties) and exact logic at scale, where a product analytics tool or the BigQuery export takes over.
What is the difference between users and active users in GA4?
Total users are unique users who triggered any event; active users are those who engaged, meaning an engaged session or specific engagement events. Google states that GA4 reports only show active users, so 'Users' in a standard report means active users.
What counts as an engaged session in GA4?
Google defines an engaged session as one that lasts longer than 10 seconds, has a key event, or has two or more page or screen views. The 10-second timer can be changed in the web stream's tag settings, so check it before comparing engagement rates.
What are key events in GA4?
Key events are the events you mark as important to your business, such as sign_up or purchase. Google announced the rename of GA4 conversions to key events in March 2024. A standard property can have up to 30 key events and a GA4 360 property up to 50.
Why do GA4 numbers change after a few days?
GA4 processing can take 24 to 48 hours, during which data may change, and key event attribution can be adjusted for up to 12 days, according to Google. Read a release no earlier than three full days after it.
Can GA4 tell me if my feature caused an increase?
Not on its own. GA4 shows before and after trends, but it cannot separate your release from seasonality, campaigns or changes in traffic mix. A causal answer needs an A/B test or a holdout group.
Key terms
- Event
- A single recorded interaction, such as a page view, a click or a purchase. In GA4 everything is an event, so a feature you cannot see as an event cannot be measured.
- Active users
- Unique users who engaged with your site or app in a period. It is what GA4 reports call 'Users', so it is the default denominator for adoption rates.
- Total users
- Unique users who triggered any event in a period. It is higher than active users, which is why two 'user' numbers for the same week can both be right.
- Engaged session
- A session lasting more than 10 seconds (by default), with a key event, or with two or more page or screen views. It drives engagement rate and bounce rate.
- Key event
- An event marked as important to the business, formerly called a conversion in GA4. Which events are marked changes engagement and conversion figures across reports.
- Exploration
- GA4's ad-hoc analysis workspace (Free form, Funnel, Path, Segment overlap, Cohort, User lifetime, User explorer). It is where most product analyses happen, and where sampling can apply.
- Data threshold
- A system-defined rule that withholds rows to protect user privacy, for example with demographic data or small counts. It cannot be switched off, so it explains some missing rows.
- Sampling
- Estimating results from a subset of events when an exploration exceeds the quota (10 million events on standard properties). It can make small segments unreliable.
- (other) row
- The row where GA4 groups less common values when a table exceeds its row limit. It signals high cardinality and hides detail you may need.
- (not set)
- A placeholder shown when GA4 received no value for a dimension. A large share usually points to a tracking problem worth fixing.
- Reporting identity
- The setting that decides which identifiers (user ID, device ID, modelling) GA4 uses to count users. It changes user counts without changing collected data.
- Consent mode modelling
- GA4's estimation of non-consenting users' behaviour from consenting users, available only above Google's eligibility thresholds. It fills part of the consent gap, not all of it.
- Data retention
- How long GA4 keeps event-level data for explorations: 2 or 14 months on standard properties. It caps how far back funnels and cohorts can look.
- BigQuery export
- The link that copies raw GA4 events into Google's data warehouse every day. It is not retroactive, so linking it early protects future analyses.
Sources
Methodology. This focus was researched and checked in October 2026, mainly against Google's official GA4 documentation (Google Analytics Help and Google for Developers), whose interface paths, limits and definitions change often; check them again if you read this later. Free-plan figures for Amplitude, Mixpanel and PostHog are vendor data from their pricing pages. W3Techs usage data is dated 1 October 2026. Exhibits 2 and 6, the ten-question table and the rules of thumb are Henkan & Partners frameworks; Exhibit 4 and the worked example use illustrative data.
- Google Analytics Help (2026). Understand user metrics.
- Google Analytics Help (2026). Engagement rate and bounce rate.
- Google Analytics Help (2026). About Analytics sessions.
- Google Analytics Help (2026). Mark events as key events.
- Google Analytics Help (2026). About data thresholds.
- Google Analytics Help (2026). Data sampling.
- Google Analytics Help (2026). About the (other) row.
- Google Analytics Help (2026). What the value (not set) means in your reports.
- Google Analytics Help (2026). Behavioral modeling for consent mode.
- Google Analytics Help (2026). Reporting identity.
- Google Analytics Help (2026). Data retention.
- Google Analytics Help (2026). Data freshness.
- Google Analytics Help (2026). Add a Google Analytics 4 property (reporting time zone).
- Google Analytics Help (2026). BigQuery Export schema.
- Google Analytics Help (2026). BigQuery Export.
- Google Analytics Help (2026). Get started with Explorations.
- Google Analytics Help (2026). Retention overview report.
- Google Analytics Help (2026). Engagement overview report.
- Google Analytics Help (2026). User acquisition report.
- Google Analytics Help (2026). Landing page report.
- Google Analytics Help (2026). Apply comparisons to reports.
- Google for Developers (2026). Data API limits and quotas.
- Google for Developers (2026). Data API ResponseMetaData.
- Google (2026). Google Analytics MCP Server (Experimental), GitHub.
- Google Analytics Help (2026). Conversions vs. key events in Google Analytics.
- Google (2024). More insightful measurement across Google Ads and Analytics, The Keyword, 21 March 2024.
- W3Techs (2026). Usage statistics and market share of traffic analysis tools for websites.
- Amplitude (2026). Pricing (vendor data).
- Mixpanel (2026). Pricing (vendor data).
- PostHog (2026). Pricing (vendor data).