Focus
How to Measure a Product Launch in GA4: Before/After, Annotations and When You Need an A/B Test
Alexandre Suon · 2026-10-02
You shipped the feature, the line in GA4 went up, and everyone wants to call it a win. This guide shows product managers how to measure a product launch in GA4 properly: why a simple before/after comparison misleads, how to plan the measurement two weeks before release, how to use annotations, comparisons and alerts, and when you need a holdout group or an A/B test instead.
Executive summary
- A before/after comparison measures everything that changed, not just your launch. Seasonality, campaigns, a shift in device mix and a change to the consent banner all land in the same number. In US e-commerce, raw sales rose 21.8% from the third to the fourth quarter of 2025, while the seasonally adjusted figure rose 2.3%.
- Most changes do not improve the metric they target, so a rising line is weak evidence. At Microsoft, about a third of tested ideas worked, a third were neutral and a third did harm. At Google and Bing, only about 10% to 20% of experiments had positive results.
- Choose the evidence level before launch, because the strong ones cannot be added afterwards. Our five-rung evidence ladder runs from a raw before/after to a randomised A/B test. A staged rollout, a holdout group or a test must be designed in; no GA4 report can recreate one later.
- Prepare GA4 two weeks early. Custom dimensions only collect data from the day you create them, the BigQuery export does not backfill data from before it is linked, and data can keep changing for 24 to 48 hours after collection. Annotate the launch, fix the comparison window and set alerts on guardrails.
- Read the result against a comparison, not against the past alone. In our worked example, a raw jump of +0.35 points in conversion rate shrinks to an estimated +0.15 points once a market that launched later is used as a comparison.
- Close every launch with a one-page readout. It states the decision, the evidence level, the guardrails and what you still do not know. AI assistants can pull the numbers and draft it, but a person must own the causal claim.
Section 1 · The question
Measuring a launch means separating what changed because of it from what changed after it
Product launch measurement is the practice of estimating the effect of a release on user behaviour and business outcomes, by comparing what happened with the launch against a credible estimate of what would have happened without it. That estimate is called the counterfactual.
Every launch raises three different questions, and GA4 answers them with different levels of confidence:
- Health: does it work? Are the new events firing, are errors stable, is checkout still converting? GA4 answers this well, within hours.
- Adoption: do people use it? Which share of eligible users tried the feature, how often, on which devices? GA4 answers this well once the events are tracked. Our sibling article on measuring feature adoption in GA4 walks through the explorations step by step.
- Impact: did it change outcomes? Did conversion, revenue per user or retention move because of the launch? This is where GA4 alone often misleads, and where this article focuses.
GA4 is very good at telling you what happened and when. It cannot tell you why on its own. It has no built-in experiment engine: Google Optimize, the testing tool that used to sit next to it, was closed on 30 September 2023, and Google now points to third-party testing tools that integrate with GA4. So impact needs a design: a comparison that holds everything else constant, or as much of it as possible.
If you are new to the series, start with GA4 for product managers for the questions GA4 answers and the reading traps, and how product managers should ask for GA4 tracking for the event specs this article assumes. For how GA4 counts users, sessions and events, see how GA4 works.
For product managers. Write down which of the three questions the launch readout must answer before you plan anything else. A launch that only needs a health check needs no comparison group. A launch that will justify next quarter's roadmap does.
For leaders. Ask for the evidence level next to every launch claim. "Conversion is up 12% since launch" and "the launch raised conversion by an estimated 3%, measured against a holdout" are different statements.
Section 2 · Before/after traps
A before/after comparison mixes your launch with seasonality, campaigns, mix shifts and tracking changes
The most common launch readout compares the two weeks after release with the two weeks before. It is fast and it feels objective. It is also exposed to at least seven confounders, any of which can be larger than the effect of the feature itself.
| Trap | What happens | How to spot it in GA4 |
|---|---|---|
| Seasonality | Paydays, holidays, sales periods and the weather move demand regardless of your release. | Compare with the same period last year (date picker > Compare > Previous year). |
| Campaigns | An email, a promotion or a paid push lands in the same window and brings more, or different, visitors. | Reports > Acquisition > Traffic acquisition, split by session source / medium, before and after. |
| Mix shift | The share of mobile, new users or a given country changes, and each group converts differently. | Add a comparison by device category or new vs returning users; check each group separately. |
| Tracking changes | A tag edit, a renamed event or a new consent setup changes what is counted, not what users do. | Look for a step change on the release day in unrelated events; check system annotations. |
| Consent changes | A new banner changes the share of visitors who are measured at all, and modelled data fills only part of the gap. | Ask the team that owns the banner what changed and when; annotate it and avoid that window. |
| Novelty effect | Users click a new feature because it is new; usage fades after a few weeks. | Plot weekly adoption by first-use week; read beyond the first two weeks. |
| Data still processing | Recent days are incomplete and attribution can still shift. | Never read the last two days; GA4 says data can change for 24 to 48 hours. |
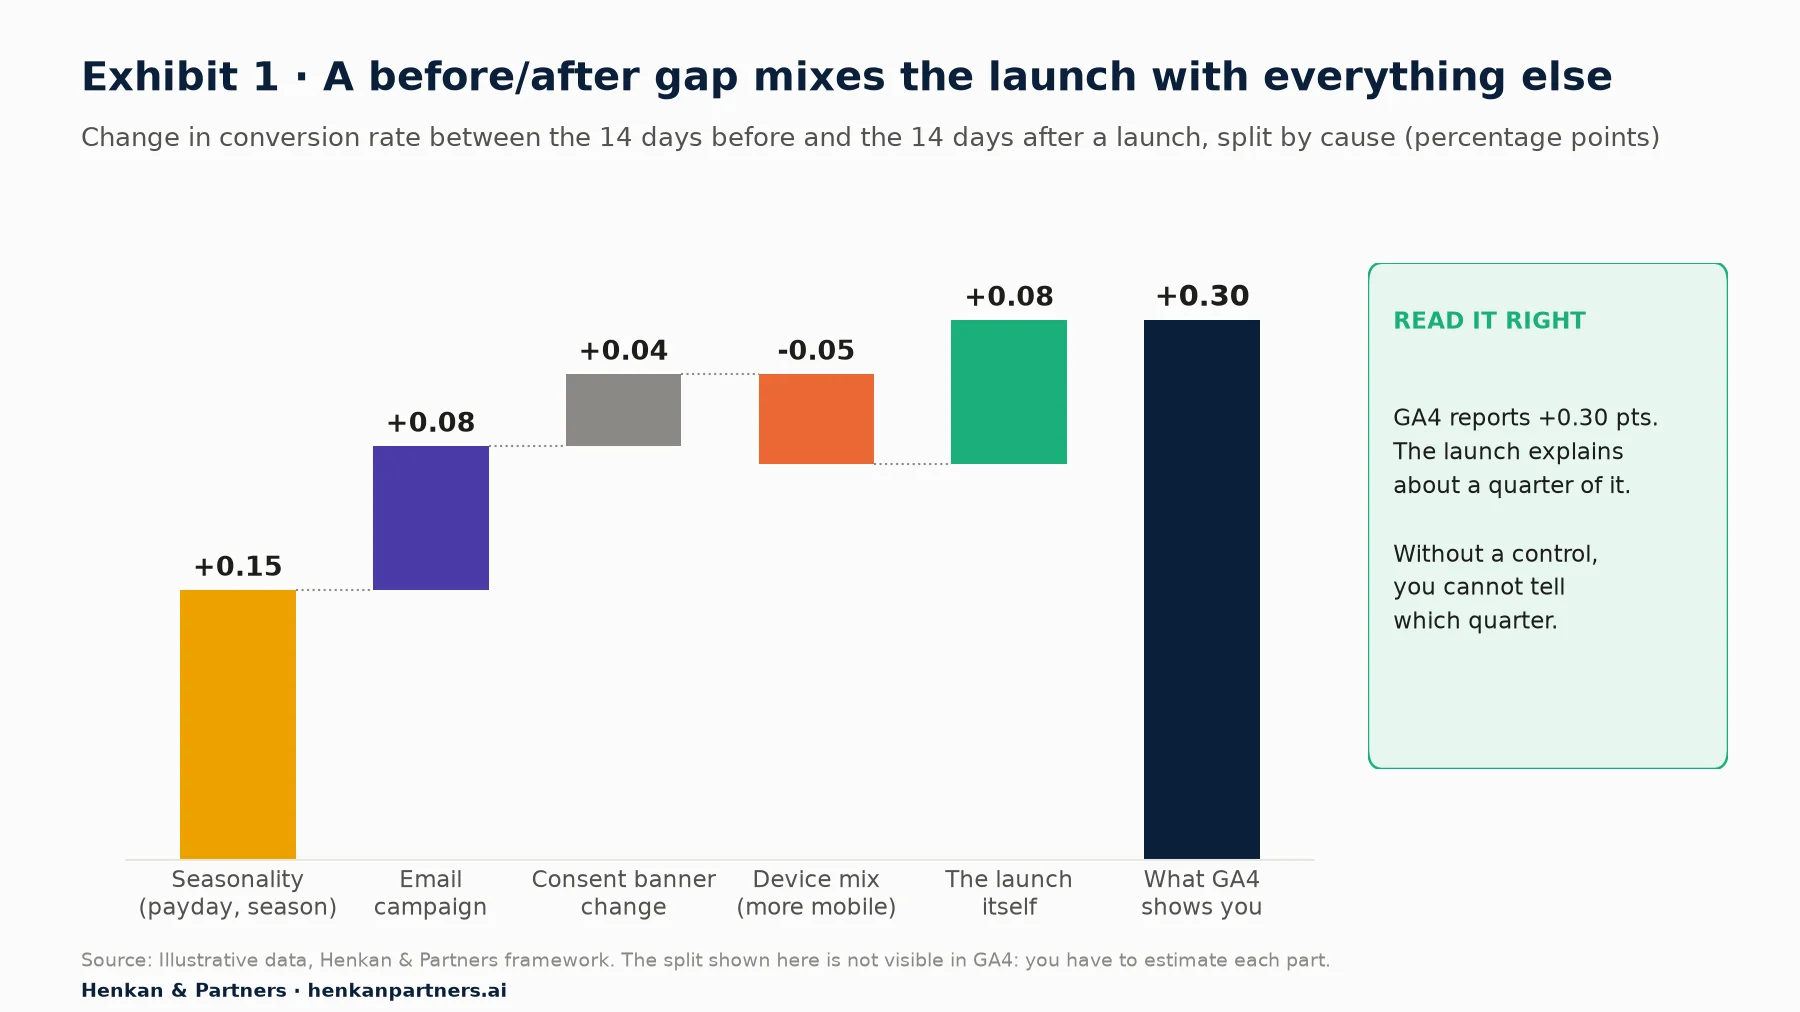
What this shows. GA4 shows you only the last bar. The split into causes is something you have to estimate, and here the launch accounts for about a quarter of the visible change. Mix shift can even work against you: more mobile traffic lowers the average conversion rate and hides part of a real effect. Without a comparison group, any of these parts could be mistaken for the launch.
Seasonal swings can dwarf the effect of a feature
Seasonal swings are not a rounding error. The US Census Bureau publishes quarterly e-commerce sales both raw and seasonally adjusted. Between the third and fourth quarters of 2025, raw sales rose 21.8% while the adjusted series rose 2.3%. In the following quarter, raw sales fell 17.5% while the adjusted series grew 3.1%.
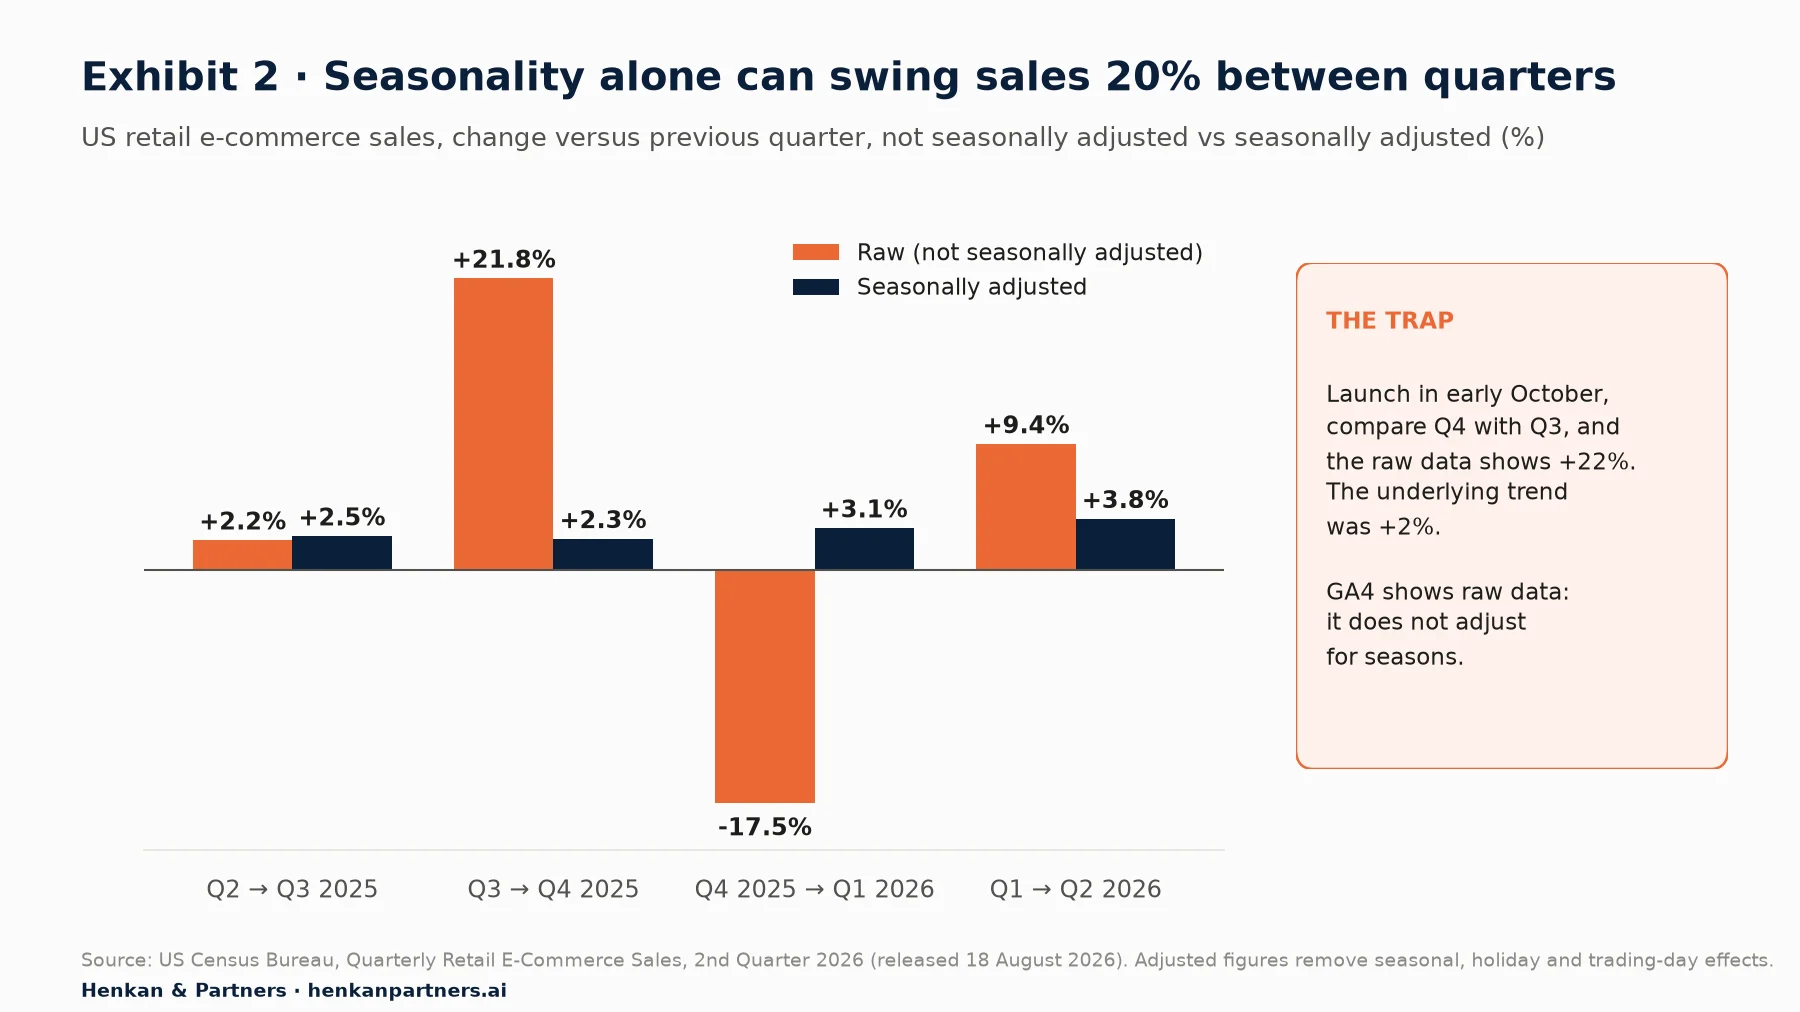
What this shows. GA4 reports raw data: it does not remove seasonal effects. A feature released in early October and judged on the fourth quarter against the third would inherit a 20-point tailwind. Released in January, the same feature would look like a failure. Your own site's seasonal pattern may be stronger or weaker, so check last year's curve before you choose the window.
Mix shift: a worked example
Suppose a retailer launches a new product page in week 10 (illustrative figures). Desktop converts at 3.0% and mobile at 1.5%, and neither changes. But a social campaign raises the mobile share of sessions from 50% to 70%. The blended conversion rate falls from 2.25% to 1.95%, a drop of 0.30 points, with no change in behaviour on either device. The readout would blame the new page for something it did not do.
Before: 0.5 × 3.0% + 0.5 × 1.5% = 2.25%
After:  0.3 × 3.0% + 0.7 × 1.5% = 1.95%
Change in each device: 0.00 points. Change in the blend: -0.30 points.
The fix: always read the main metric by device, new vs returning users and main channel, as well as in total. GA4 comparisons (Section 5) put that split next to the total.
Section 3 · Evidence ladder
Choose the evidence level before launch, because the strongest methods cannot be added afterwards
There is no single right way to measure a launch. There is a ladder of methods, each ruling out more alternative explanations and each requiring more preparation. The key point is timing: rungs 3 to 5 need a decision before release, because they depend on who gets the feature and when.
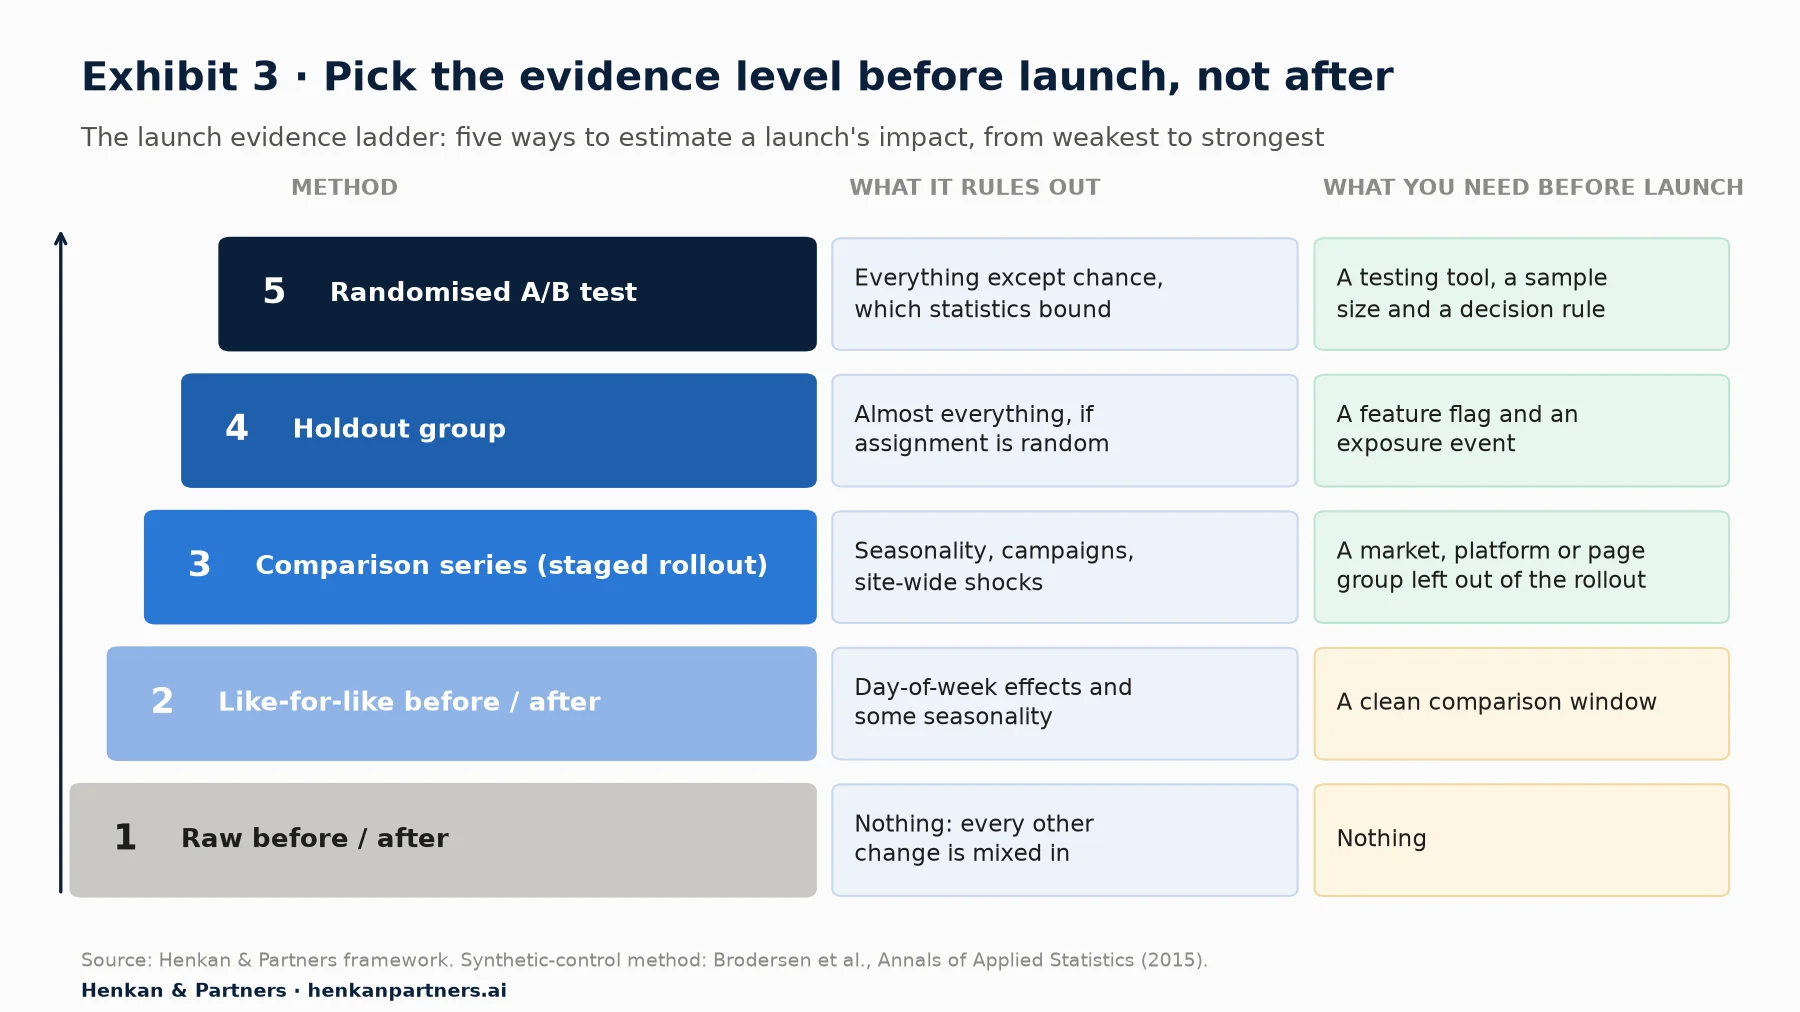
What this shows. The bottom two rungs can be done after the fact in GA4. The top three cannot: you need a market, page group or platform left out, a feature flag with a holdout, or a testing tool. Pick the rung by the cost of being wrong, not by habit.
| Rung | Use it when | Done in GA4? |
|---|---|---|
| 1 · Raw before/after | Health checks only; never for impact claims. | Yes: date comparison. |
| 2 · Like-for-like before/after | Low-stakes changes, stable traffic, no campaigns in the window. | Yes: Previous period (match day of week) or Previous year. |
| 3 · Comparison series | Staged rollouts by market, platform or page type. | Partly: comparisons, then the arithmetic in a sheet or BigQuery. |
| 4 · Holdout group | Features that will stay on; you want an ongoing read of their value. | Partly: exposure event plus audience or segment; statistics outside GA4. |
| 5 · A/B test | Expensive or risky decisions; changes to pricing, checkout, navigation. | No: run it in a testing tool; GA4 can receive the variant. |
Why intuition is not enough
Product teams overrate how often their changes work. Kohavi and Thomke reported in Harvard Business Review that at Microsoft, one-third of tested ideas proved effective, one-third were neutral and one-third had negative results; at Google and Bing, only about 10% to 20% of experiments generated positive results. Spotify reports a win rate of about 12% in the two organisations that run around 80% of its experiments, and Optimizely, in its write-up of 127,000 experiments run on its platform, reports that only 12% produce a statistically significant improvement on the primary metric (vendor data).
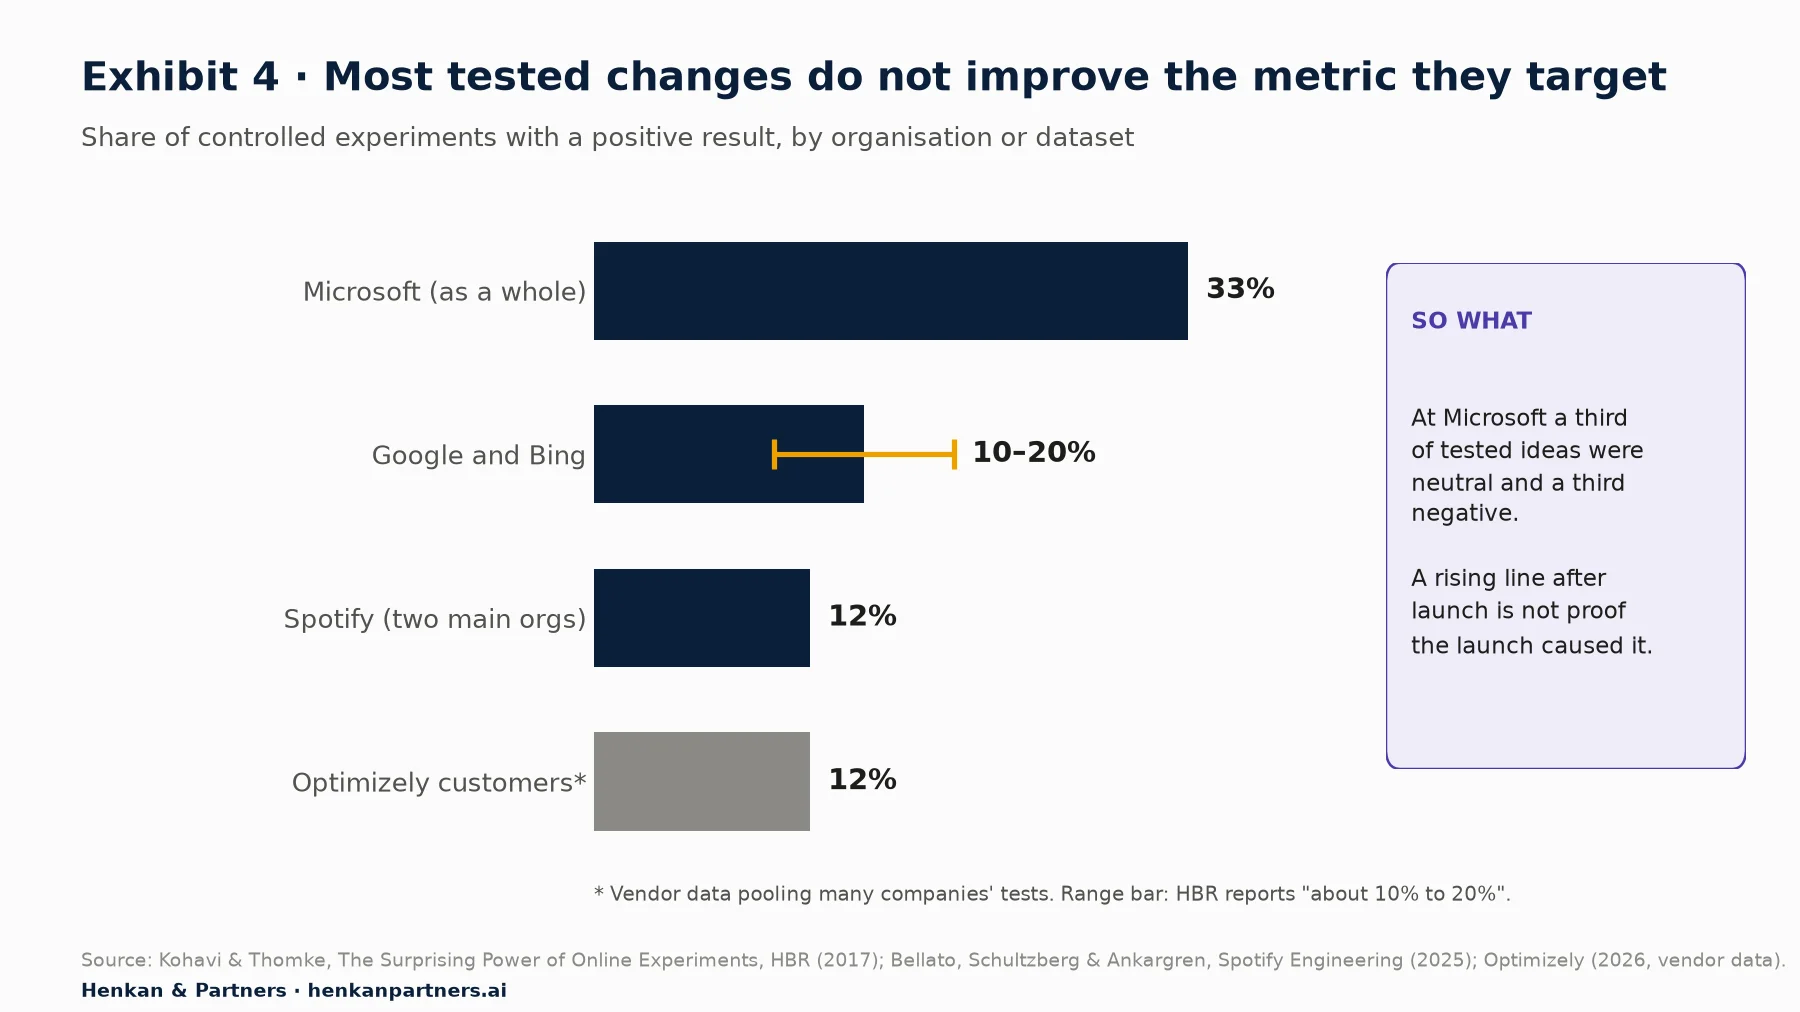
What this shows. If most well-designed changes do not move the needle, then most rises seen after a launch are partly or wholly caused by something else. That is the base rate to keep in mind when a dashboard turns green. It is also why the A/B testing guide treats a test as the default for decisions that matter.
Our view. For most product teams, rung 3 is the best value. A staged rollout costs almost nothing, protects you if something breaks, and gives you a comparison series. Reserve rungs 4 and 5 for launches where a wrong call would cost real money or lock in a roadmap.
Section 4 · The plan
Write a one-page launch measurement plan two weeks before release
A measurement plan makes the team agree on success before anyone sees the data. Write it during development, attach it to the epic and review it with engineering and your analyst. Two weeks leaves time to build and test the events.
| Field | What to write | Example: "save for later" (illustrative) |
|---|---|---|
| Decision | What you will do with the answer. | Keep, change or remove; roll out to Spain or not. |
| Question | One sentence, testable. | Does saving items lift purchases, or only delay them? |
| Primary metric | One metric that decides, with its GA4 definition. | Purchase conversion rate per session (key event: purchase). |
| Adoption metric | Share of eligible users who use the feature. | Users with save_for_later ÷ users with view_item. |
| Guardrails | Metrics that must not get worse, with a threshold. | Add-to-cart rate, JavaScript errors, revenue per user: no drop beyond 5%. |
| Segments | Groups you will read separately. | Device category, new vs returning, France vs Spain. |
| Evidence level | Rung of the ladder and the comparison group. | Rung 3: Spain launches four weeks later. |
| Window | Pre and post periods, in full weeks. | 8 weeks before, 4 weeks after; skip launch day. |
| Tracking needed | Events, parameters, custom dimensions. | save_for_later with item_id and source; feature_version user property. |
| Owner and date | Who writes the readout, and when. | PM, at T+28. |
The GA4 set-up that must be done before release
Most launch readouts fail not on analysis but on missing data. These items cannot be fixed later, so put them in the definition of done for the release:
- Events and parameters for the feature are specified and built. Use the PM's guide to GA4 tracking requests for the event spec format and naming.
- Custom dimensions are registered in Admin > Custom definitions for every parameter you will report on. According to Google, new custom dimensions do not show historical data and take 24 to 48 hours to become available. A standard property can have 50 event-scoped and 25 user-scoped custom dimensions, so do not register throwaway ones.
- Key events are marked for the primary outcome if it is not already one. In Admin > Events, click the star next to the event. A standard property can have up to 30 key events (formerly called conversions).
- Data retention is checked in Admin > Data settings > Data retention. It limits how far back explorations and funnel reports can go (standard reports are not affected). If it is set to 2 months, your year-on-year comparison in explorations will be empty.
- BigQuery export is linked if you might need user-level analysis. The export only contains data from the day you link it onwards, with no backfill, so a link created after launch misses the pre-period.
- The release is QA'd in DebugView before it ships, so day 1 data is usable. Our developer path covers debugging and QA for GA4.
These steps are the product manager's share of the team's tracking plan. The shared article on the GA4 tracking plan shows how product, design, engineering and marketing request, build and check tracking together.
Section 5 · Set up GA4
In GA4, annotate the launch, fix the comparison window and set alerts before day one
Step 1: annotate the launch date
Annotations are notes attached to dates in GA4 reports. Once created, they appear across all reports and report cards that have a line graph, so anyone looking at a dip or spike sees that a release happened that day.
- Go to Reports and open any report with a line graph.
- Right-click the data point for the launch date and select Add annotation.
- Enter a title (up to 60 characters) and a description (up to 150 characters), choose a single date or a date range, and pick a colour.
- Click Create annotation.
You need the Analyst role or above to create, edit or delete annotations; Viewers can see them. A property can hold up to 1,000 annotations, and all of them can be viewed, edited or exported in Admin > Data display > Annotations. GA4 also adds system annotations when a significant data-impacting event occurs; you cannot edit or delete those, but you should read them, because they can explain a step change that is not yours.
For product managers. Agree an annotation convention with the team: for example, a title of the form "Launch · Save for later · FR" and one colour for releases, another for campaigns and another for tracking changes. Annotate campaigns and tracking changes too: they are the confounders you will need to explain in the readout.
Step 2: fix the comparison window
In any report, open the date picker at the top right, choose the post-launch range, click Compare, then choose Previous period (match day of week), Previous period or Previous year, and click Apply. Use whole weeks and match the day of the week, because most e-commerce sites convert differently at weekends. Exclude the launch day itself and the last two days, which may still be processing.
Then add comparisons for the segments in your plan. Click the comparison icon at the top right of a report and build conditions on dimensions, for example Device category = mobile. A comparison can have up to five conditions. Saved comparisons (up to 200 per property, created by Editors in Admin > Data display > Comparisons) let the whole team use the same splits.
Step 3: set alerts on guardrails
Custom insights are GA4's alerts. From an Insights card, click View all insights, then Create, and either pick a suggested insight or Create new. Choose an evaluation frequency (hourly is available for web data only, then daily, weekly or monthly), a segment, a metric and a condition: Has anomaly, a percentage change, or a threshold. Add the email addresses of the people who should be notified. A property can have up to 50 custom insights, and you need the Editor or Administrator role.
For a launch, three alerts usually suffice: an hourly anomaly on the purchase key event, a daily alert if add-to-cart events drop by more than your guardrail threshold, and a daily alert on your error event if you track one. The general case for guardrails, and how to set harm thresholds, is in our article on guardrail metrics.
Step 4: watch day one in Realtime, but do not judge it
Reports > Realtime shows activity in the last 30 minutes. Use it on launch day to check the new events arrive and nothing has disappeared, not to judge impact. Google says intraday data in standard properties takes 2 to 6 hours and daily data 12 hours or more, that data can change for 24 to 48 hours, and that attribution credit for key events can shift for up to 12 days.
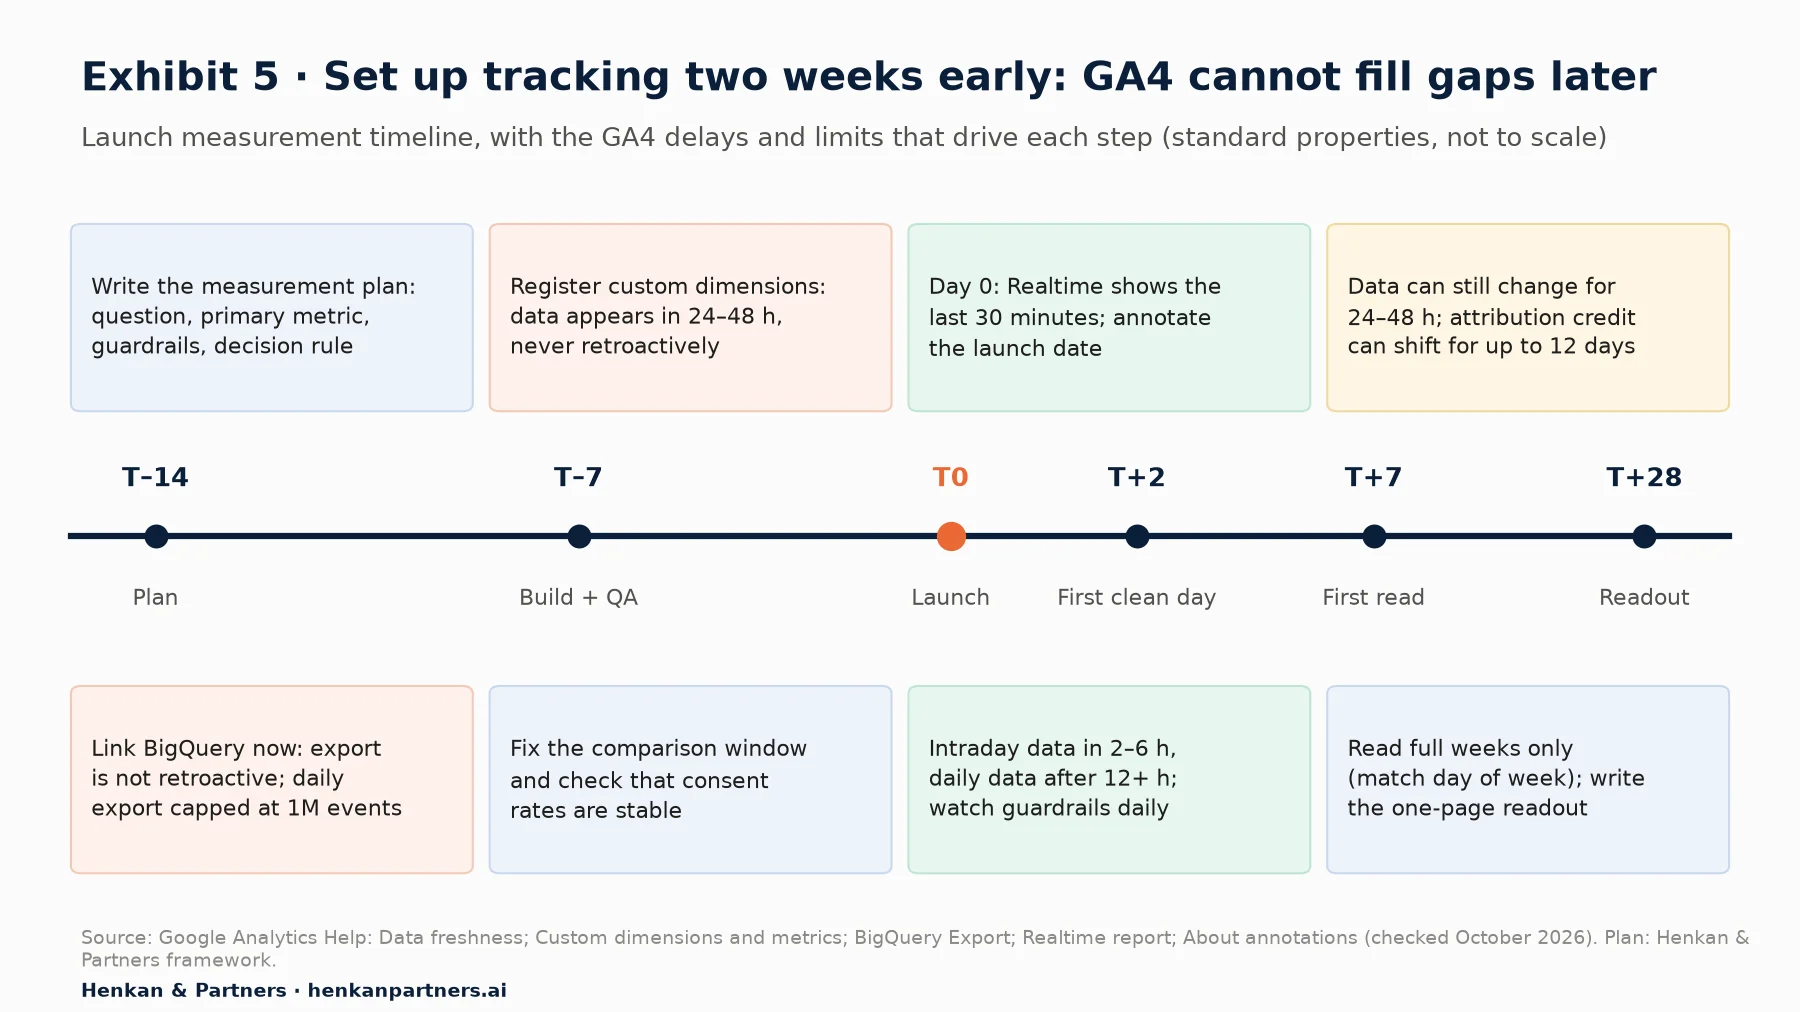
What this shows. Most of the work happens before launch. After it, the main discipline is patience: the first full week is a health check, and a decision needs at least two to four full weeks, longer if your traffic is small or seasonal.
Agree the rollback rule in advance
Write down, before launch, which guardrail moves will make you roll back, and who decides. For example: "If purchases per session fall more than 5% against the comparison market for three consecutive days, the PM and the tech lead switch the flag off and investigate." A rule set in advance stops a team from explaining away bad numbers after the fact, and stops it from rolling back on one noisy day.
Section 6 · Staged rollout
A staged rollout gives you a comparison series almost for free
If the feature goes to one market, platform or page type first, the group that waits is a natural comparison. Whatever affects both groups (seasonality, a site-wide campaign, a payday) shows up in both lines. The difference between their changes is your estimate of the launch effect. Statisticians call this difference-in-differences.
Worked example: "save for later" in France, then Spain
An illustrative retailer launches "save for later" on product pages in France. Spain gets it four weeks later. The team reads weekly purchase conversion rate per session for both markets, eight weeks before and four weeks after.
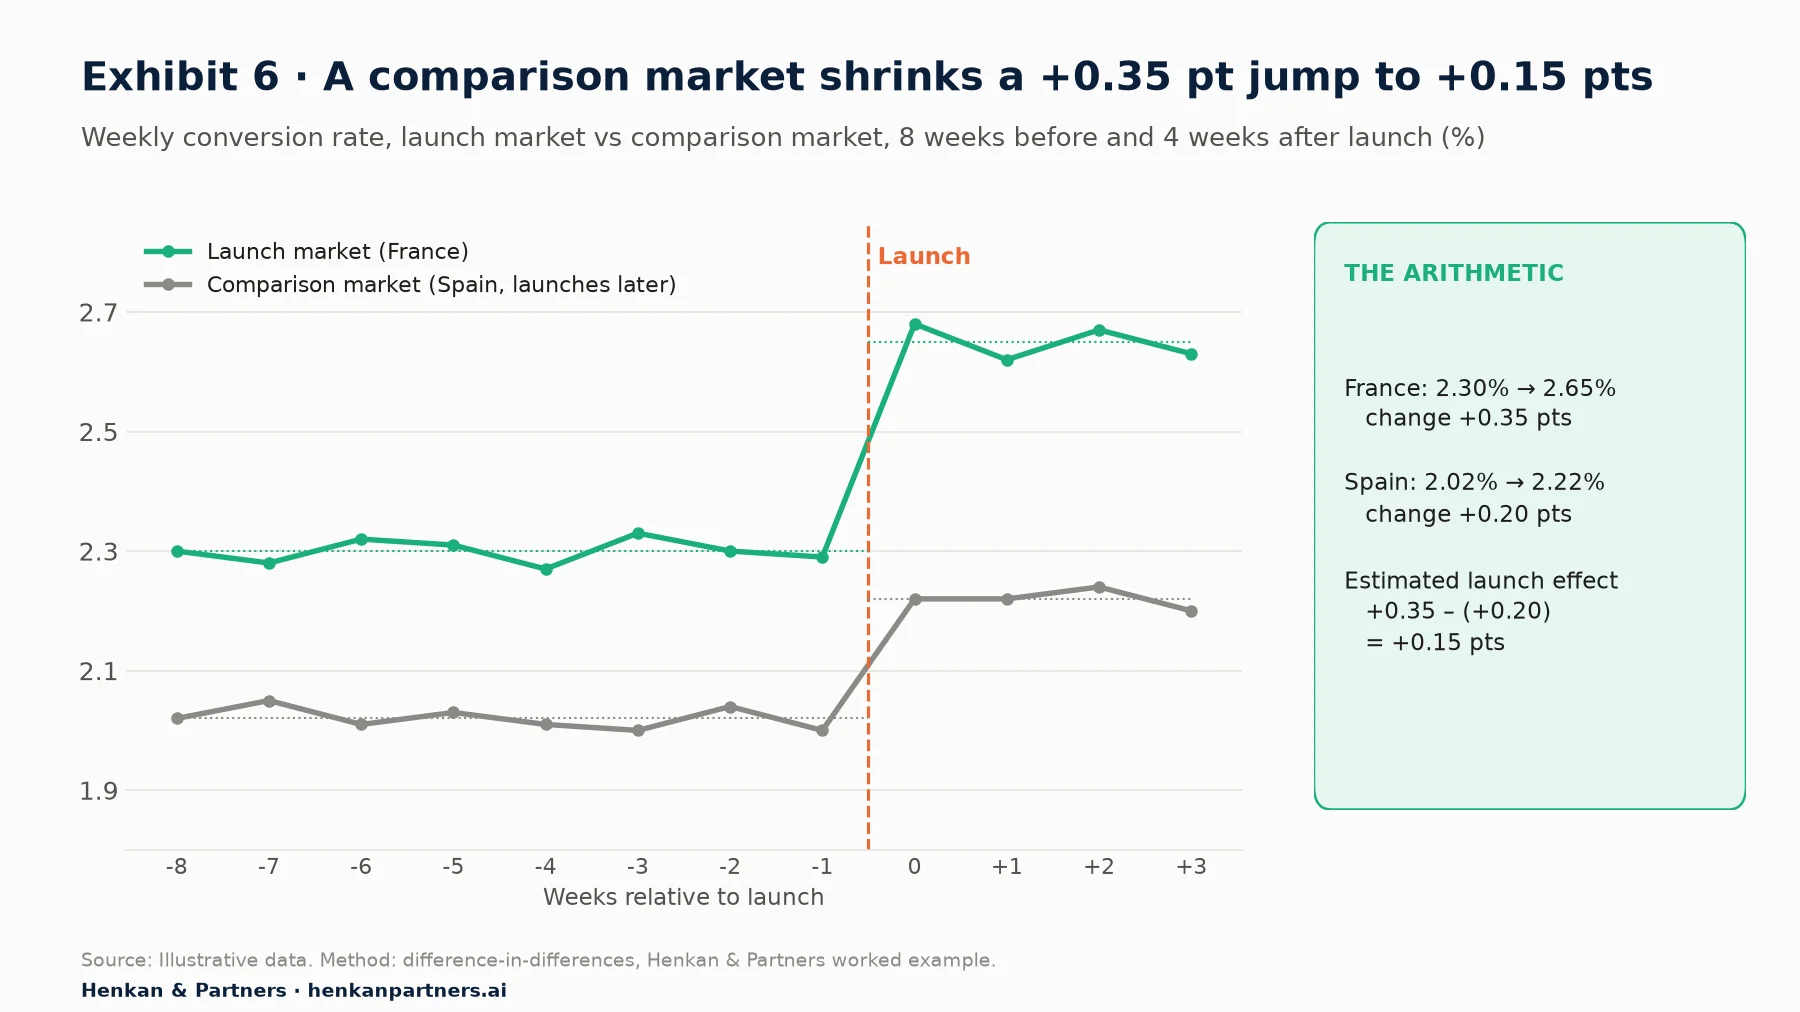
What this shows. France rose by 0.35 points. Spain, which did not have the feature, rose by 0.20 points in the same weeks, because of a payday and an email campaign sent to both markets. The estimated launch effect is the difference: about +0.15 points, less than half the raw jump. The parallel lines before launch are what make the method credible; if the two markets had been moving apart already, the estimate would be biased.
Launch effect = (France after − France before) − (Spain after − Spain before)
             = (2.65% − 2.30%) − (2.22% − 2.02%)
             = 0.35 − 0.20 = +0.15 points
How to get the numbers out of GA4
- Open Explore, create a Free form exploration, and import the dimensions Country and Week and the metrics Sessions and Transactions; conversion rate is one divided by the other (or use Session key event rate if purchase is your only key event).
- Set the date range to cover the full pre and post periods, in whole weeks.
- Put Week in rows and Country in columns, and filter to the launch and comparison markets.
- Export to a sheet and compute the averages and the difference-in-differences as above.
- Check the exploration's data quality icon. Explorations in standard properties are sampled above 10 million events per query; if the icon reports sampling, shorten the date range or use BigQuery.
Two cautions. A comparison series only rules out what affects both groups equally: a France-only campaign would still bias the result. And this arithmetic gives no confidence interval; for a range, use a method such as Google's CausalImpact (Brodersen et al., 2015), which builds the counterfactual from comparison series. The funnel and cohort analysis guide shows how to put intervals on conversion rates.
Section 7 · Holdouts and A/B tests
When the decision is expensive, keep a holdout or run an A/B test, and send the variant to GA4
A holdout is a randomly chosen group of users who do not get the feature (in our experience usually 5% to 10%), kept for weeks or months. An A/B test is the same idea, run with a fixed sample size and a decision rule. Both remove almost every confounder, because chance alone decides who sees what. Both must be set up before launch, usually through a feature-flag system or a testing tool.
Send exposure to GA4 so you can read the groups
GA4 does not assign users to groups. Your flag or testing tool does, and then sends the assignment to GA4. Google's developer guide for experiment integrations recommends an event named `experience_impression` with a parameter `exp_variant_string` in the form tool ID-experience ID-variant ID. Register that parameter as a custom dimension, and you can then build comparisons, segments or audiences for each group.
- Read guardrails and secondary metrics in GA4 by comparing the groups side by side.
- Decide with the testing tool's statistics, not with GA4's. GA4 shows totals and rates, not confidence intervals or sample-ratio checks. The sample size and duration guide explains how long a test needs.
- Keep the audience logic simple. Google notes that audiences cannot be paused and that archived audiences lose their names, so name them clearly and clean them up after the test.
For product managers. A holdout is often easier to sell than a test. "We ship to 90% now and keep 10% back for six weeks to measure the value" sounds like a launch, not a delay, and it gives you the strongest evidence you can get after the fact.
Disclosure: Henkan & Partners runs A/B testing programmes for clients and works with several testing-tool vendors.
Section 8 · BigQuery
Move to BigQuery when you need unsampled, user-level or long-window answers
The GA4 interface is enough for most launch readouts. Move to the BigQuery export when one of these limits gets in the way:
| Limit in the GA4 interface | Why it matters for a launch | What BigQuery gives you |
|---|---|---|
| Sampling in explorations above 10 million events per query (standard) | Large sites reading several weeks of data get approximate numbers. | Every raw event, unsampled. |
| Data retention for explorations: 2 or 14 months in standard properties (up to 50 months for event data in 360) | Year-on-year or long retention reads can be cut off. | History kept as long as you store it, from the day you linked. |
| Thresholding on some reports | Small segments can be withheld. | No thresholds on raw events (Google signals data is not exported). |
| Fixed metric definitions | You may need conversion by first exposure date, or per user over 28 days. | Your own definitions in SQL. |
| Modelled consent data in reports | Blended reports include modelling; the export does not. | Observed data only, so numbers differ from the interface. |
Know the export's own limits. The daily export for standard properties is capped at 1 million events a day; streaming export arrives within minutes but carries no completeness guarantee and costs $0.05 per gigabyte. Daily tables can be updated for up to two days with late events. Above all, the export does not backfill data from before the link: link it before launch.
A starting query for the worked example, counting users and buyers per market and week (adapt the project, dataset and dates):
SELECT
  geo.country AS country,
  DATE_TRUNC(PARSE_DATE('%Y%m%d', event_date), WEEK(MONDAY)) AS week,
  COUNT(DISTINCT user_pseudo_id) AS users,
  COUNT(DISTINCT IF(event_name = 'purchase', user_pseudo_id, NULL)) AS buyers
FROM `my-project.analytics_123456789.events_*`
WHERE _TABLE_SUFFIX BETWEEN '20260601' AND '20260830'
  AND geo.country IN ('France', 'Spain')
GROUP BY country, week
ORDER BY week, country
This counts browsers, not people, and it will not match GA4 reports exactly; how GA4 works explains why. The developer path's article on the GA4 BigQuery export covers the schema and cost control in detail.
Section 9 · AI
AI assistants can pull the numbers and draft the readout, but they cannot tell you what caused the change
Large language models connected to GA4 make launch reporting faster. Google publishes an experimental, read-only Google Analytics MCP server (Model Context Protocol, the standard that lets AI assistants call external tools) with tools such as `run_report`, `run_funnel_report` and `run_realtime_report`. An assistant connected to it can pull the weekly numbers for both markets, compute the difference-in-differences and draft the readout in minutes.
Use AI for the mechanical work: pulling the same report every week, checking guardrails, drafting the readout. Keep three things human:
- The causal claim. An assistant will happily describe a rise after launch as an effect of the launch. Only the design (the rung on the ladder) supports that claim.
- The definitions. Check which metric, date range, attribution setting and filters the assistant used. Ask it to show the request it sent.
- The decision. Roll out, change or remove is a product call that weighs evidence against strategy and cost.
Section 10 · The readout
End with a one-page readout that states the decision, the evidence level and what you still don't know
A good launch readout is short, starts with the decision and is honest about uncertainty. It is written for people who will not open GA4, and it uses the same structure every time: decision, evidence level, primary metric (estimated effect next to the raw change), adoption, guardrails, what else moved, and what you still don't know.
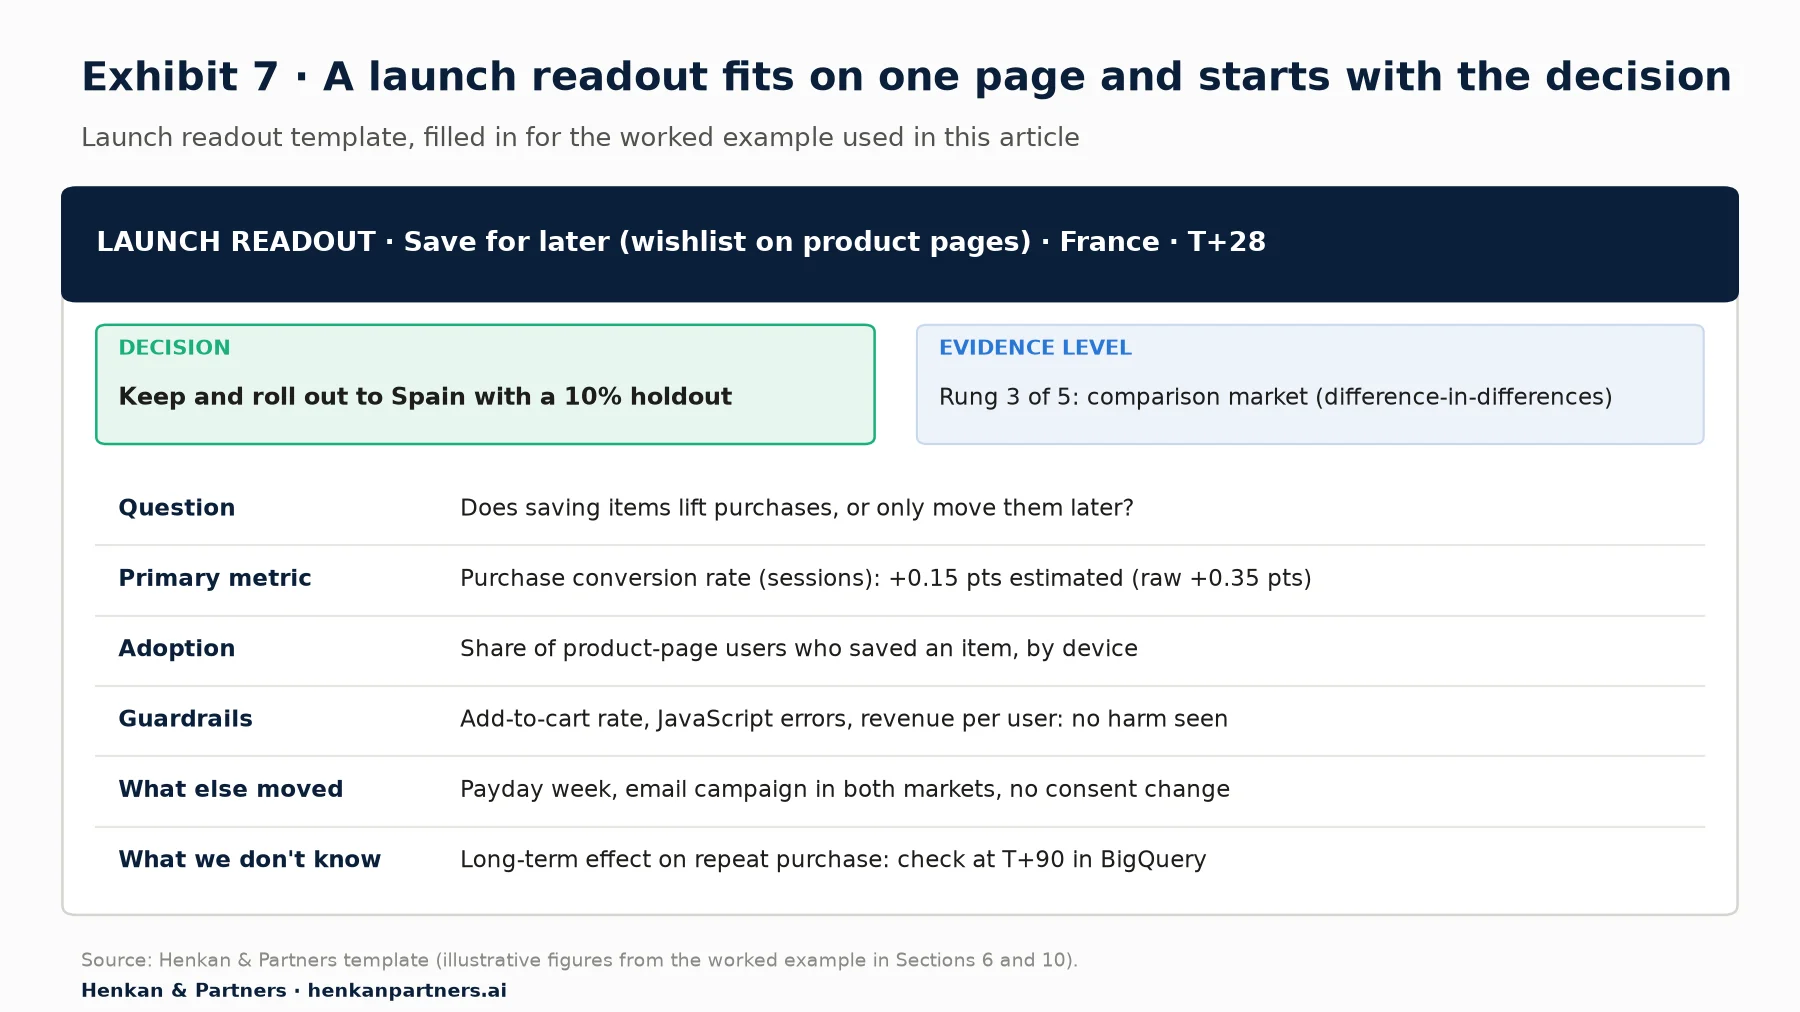
What this shows. The decision comes first and the evidence level second, so a reader knows how much weight to put on the numbers. The "what else moved" line names the confounders, and the "what we don't know" line sets up the next measurement rather than overselling this one.
For how to present results to executives, designers and engineers, see how to talk about experimentation to every stakeholder.
Section 11 · Next steps
What to do next
1. Pick your next launch and choose its rung
Take the next release on the roadmap and decide which question the readout must answer and which rung of the evidence ladder it needs. If it is rung 3 or above, talk to engineering this week about a staged rollout or a flag.
2. Write the one-page measurement plan
Fill in Table 3 with your analyst, attach it to the epic, and add the tracking items to the definition of done. To brief developers, download the GA4 Tracking Request Kit: it includes the event spec template, naming convention and QA checklist.
3. Set up GA4 before release day
Register custom dimensions, link BigQuery if needed, check data retention, save comparisons for your segments and create two or three custom insights on guardrails. Then annotate the launch on the day.
4. Read in full weeks, against a comparison
Do a health check at T+7, and the impact read at T+28 or later. Always show the raw change next to the estimated effect, and always split by device and new vs returning users.
5. Make the readout a habit
Use the same one-page format for every launch and store readouts where the team can find them. After a few quarters, you will know which kinds of features pay off. If you want help setting up launch measurement or a holdout programme, Talk to us.
FAQ
Frequently asked questions about measuring a product launch in GA4
Frequently asked questions
What is product launch measurement?
Product launch measurement estimates the effect of a release on user behaviour and business results by comparing what happened with a credible estimate of what would have happened without the launch, using a comparison market, a holdout group or an A/B test.
How do I measure a product launch in GA4?
Decide the question and the primary metric before launch, make sure the feature's events and custom dimensions are collecting data, annotate the launch date, and compare full weeks after launch with full weeks before, matched by day of week. For impact claims, compare against a group that did not get the feature: a market that launches later, a holdout or an A/B test.
What is a before and after analysis, and why is it unreliable?
A before and after analysis compares a metric in a period after a change with a period before it. It is unreliable for impact because seasonality, campaigns, changes in traffic mix, tracking edits and consent changes land in the same window and cannot be separated from the launch.
How do I add an annotation in GA4?
Open a report with a line graph under Reports, right-click the data point for the date, select Add annotation, enter a title (up to 60 characters) and description (up to 150), choose a date or range and a colour, then click Create annotation. You need the Analyst role or above. Manage them in Admin > Data display > Annotations.
How long should I wait before judging a launch in GA4?
Do not read the last two days, because GA4 data can change for 24 to 48 hours. Use the first full week as a health check and read impact after at least two to four full weeks, longer if your traffic is low or the season is changing.
Can GA4 run A/B tests?
No. GA4 has no built-in testing engine, and Google Optimize was closed on 30 September 2023. Run tests in a testing tool or feature-flag system and send the variant to GA4, for example with the experience_impression event and the exp_variant_string parameter, to analyse groups in reports.
When should I use BigQuery instead of the GA4 interface for a launch?
When explorations are sampled, when data retention cuts off the comparison period, when small segments are thresholded, or when you need custom definitions such as conversion per user since first exposure. Link the export before launch, because it does not backfill earlier data.
Key terms
- Annotation
- A note attached to a date or date range in GA4 reports. It matters because it tells everyone reading a chart that a launch, campaign or tracking change happened then.
- Counterfactual
- An estimate of what would have happened without the launch. It matters because every impact estimate is the gap between what happened and the counterfactual.
- Comparison (GA4)
- A GA4 report feature that shows a subset of data, defined by dimension conditions, next to the total. It matters because it puts device, user type or market splits beside every metric.
- Confounder
- Anything other than the launch that changes the metric in the same period, such as a campaign or a season. It matters because confounders are what make before/after comparisons misleading.
- Custom insight
- A user-defined GA4 alert that flags anomalies, percentage changes or thresholds, optionally by email. It matters because it catches guardrail problems without someone checking reports daily.
- Difference-in-differences
- An estimate of effect that subtracts the change in a comparison group from the change in the treated group. It matters because it removes shocks that affect both groups equally.
- Evidence ladder
- A Henkan & Partners framework ranking five launch-measurement methods from raw before/after to A/B test. It matters because it makes the strength of each claim explicit.
- Exposure event
- An event recording that a user was assigned to, or saw, a variant or feature. It matters because it lets GA4 split metrics by group.
- Guardrail metric
- A metric that must not get worse when you launch, such as add-to-cart rate or errors. It matters because a feature can win on its own metric while harming the business.
- Holdout group
- A random share of users kept without the feature for a period. It matters because it gives a clean comparison after the feature is otherwise fully launched.
- Key event
- An event marked in GA4 as important to the business, formerly called a conversion. It matters because key events are the outcomes GA4 reports and attributes.
- Mix shift
- A change in the composition of traffic, such as more mobile or more new users. It matters because it can move an average metric without any change in behaviour.
- Novelty effect
- Extra usage of a new feature simply because it is new. It matters because early adoption figures can overstate lasting value.
- Seasonality
- Regular, calendar-driven swings in demand. It matters because it can be larger than a feature's effect and GA4 does not adjust for it.
Sources
All sources checked in October 2026. GA4 interface paths, limits and delays come from Google's official documentation and apply to standard (non-360) properties unless stated; Google changes GA4 often, so check the current help pages before relying on a limit. Optimizely's win rate is vendor data from its customer base. Exhibits 1, 3, 6 and 7 and Tables 2 and 3 are Henkan & Partners frameworks or templates with illustrative data; Exhibits 2 and 4 show sourced data; Exhibit 5 combines Google documentation with our framework.
- Google Analytics Help (2026). About annotations.
- Google Analytics Help (2026). Data freshness.
- Google Analytics Help (2026). Change and compare date ranges in reports.
- Google Analytics Help (2026). Apply comparisons to reports.
- Google Analytics Help (2026). Analytics Insights.
- Google Analytics Help (2026). About key events.
- Google Analytics Help (2026). Custom dimensions and metrics.
- Google Analytics Help (2026). Data retention.
- Google Analytics Help (2026). About data sampling.
- Google Analytics Help (2026). Data thresholds.
- Google Analytics Help (2026). BigQuery Export.
- Google Analytics Help (2026). About behavioral modeling for consent mode.
- Google Analytics Help (2026). Realtime report.
- Google for Developers (2026). Create an experiment integration with Google Analytics.
- Google Optimize Help (2023). Sunset of Google Optimize.
- Google (2026). Google Analytics MCP Server (Experimental).
- US Census Bureau (2026). Quarterly Retail E-Commerce Sales, 2nd Quarter 2026.
- Kohavi, R. & Thomke, S., Harvard Business Review (2017). The Surprising Power of Online Experiments.
- Bellato, M., Schultzberg, M. & Ankargren, S., Spotify Engineering (2025). Beyond Winning: Spotify's Experiments with Learning Framework.
- Optimizely (2026). Top 10 takeaways from running 127,000 experiments (vendor data).
- Brodersen, K. H., Gallusser, F., Koehler, J., Remy, N. & Scott, S. L., Annals of Applied Statistics (2015). Inferring causal impact using Bayesian structural time-series models.